Uptrick is an AI-powered indicator and systems provider built for traders who want structure, consistency, and real results — not a signal service or guru-style brand.
Uptrick provides advanced indicators and complete trading systems. You can follow predefined systems that are already structured and ready to use, or build your own system using the full indicator suite. The goal is not to create dependency — it is to give you a framework you can trust and operate with.
Built on AI
Uptrick runs heavily on AI. AI agents support the business, optimize workflows, and shape how systems are developed and delivered. This same mindset applies to trading — the edge today comes from structured, system-based decision making, not from manual guessing.
Why Systems Matter
Trading without a system is inconsistent. Systems provide clear rules, consistency, repeatability, and reduced emotional decisions. Markets are too competitive for random trading.
◆Stop guessing. Start using systems. Let them work.
Learn, Don't Follow
Uptrick is built for traders who want to improve, not just copy signals. You come here to learn how systems work, apply them properly, build consistency, and become profitable over time.
◈ Setup
Get Started
Follow these steps to connect your accounts and unlock full access to all Uptrick indicators, systems, and Discord channels.
Setup Steps
1
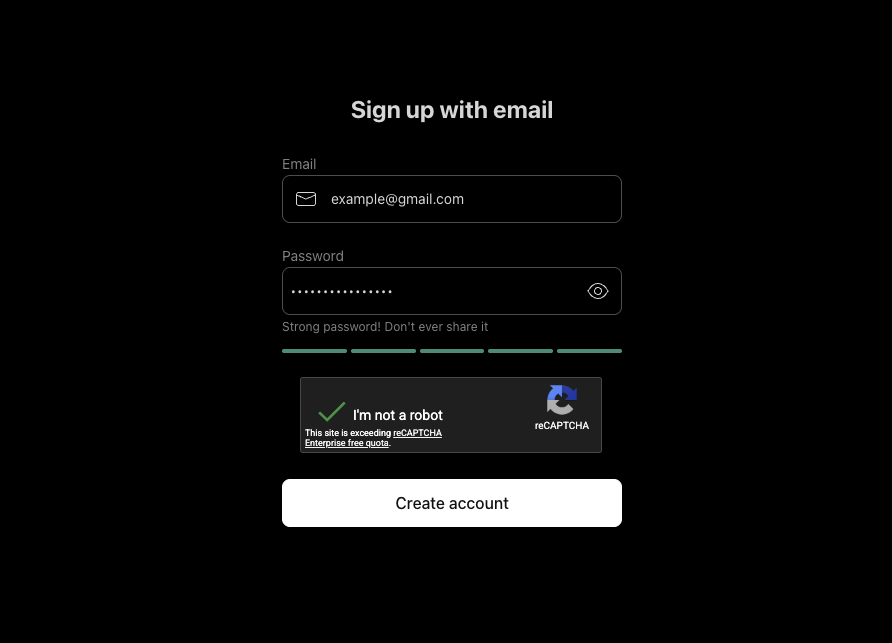
Set Up TradingView Account
Create or log into your TradingView account. This is where all Uptrick indicators live — you'll need it to receive access after purchasing.
2
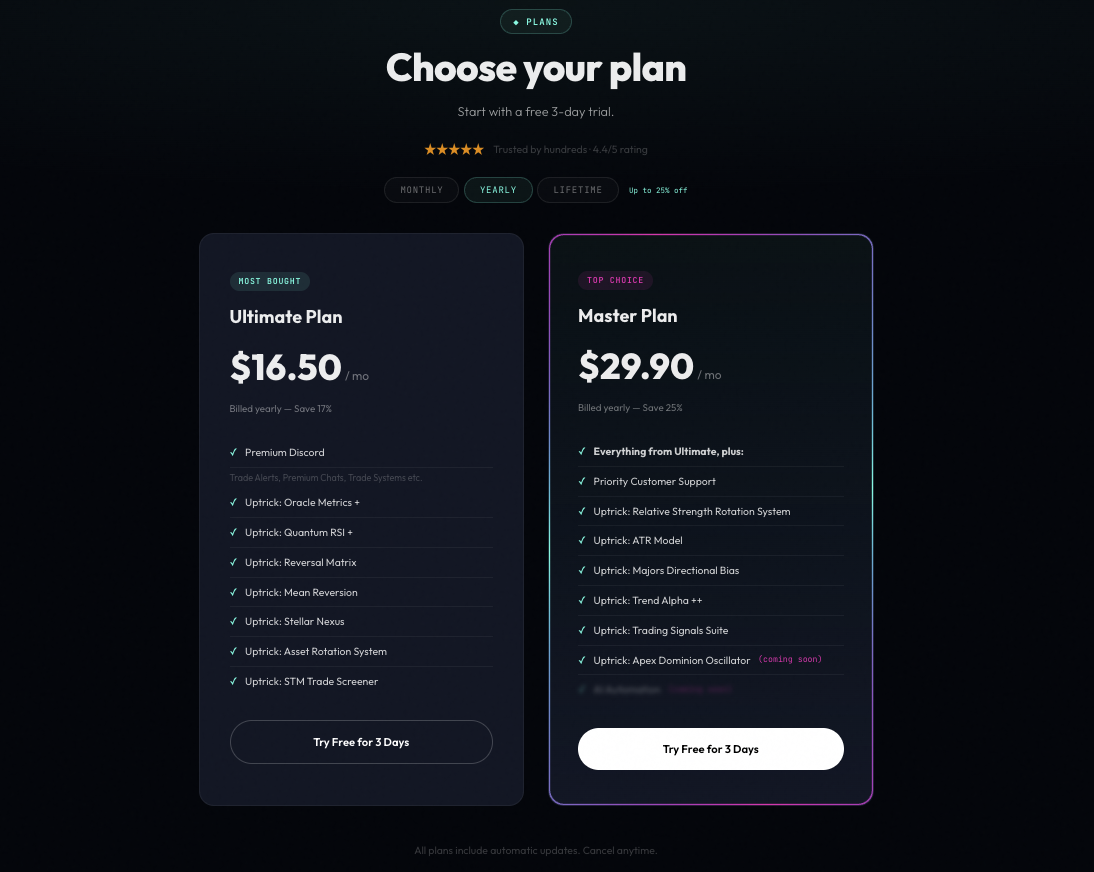
Choose a Plan
Visit uptrick.io and choose the plan that fits your trading style. Every plan includes a 3-day free trial so you can explore before fully committing.
3
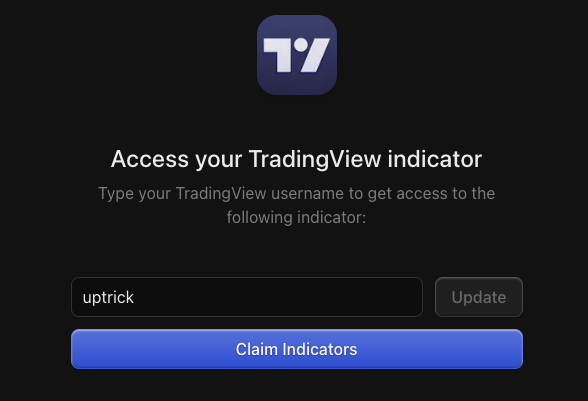
Claim Indicators
After purchase, submit your TradingView username. Your account will receive access to all premium indicators included in your plan.
4
Claim Discord Roles
Submit your Discord username to receive the correct role — Master or Ultimate — unlocking all channels, systems, alerts, and support.
5
All Done!
Access is granted instantly in most cases, and within 24 hours at most. You're now ready to use the full Uptrick suite.
ℹNeed help? Reach out in Discord or email support@uptrick.io
◈ Community
Socials
Find Uptrick across every platform. Join the community, follow for updates, and get access through the links below.
Whop
Purchase your Uptrick subscription through Whop. All plans, trials, and billing are managed here. Start with the 3-day free trial before committing.
The main community. Live trade discussions, indicator-specific channels, real-time support, and structured systems content. Included with every paid plan.
A signal system for simple Daily trend following or filtered lower-timeframe trading.
Introduction
Choose one workflow and keep it consistent. On Daily, follow the signals directly. On 1h and below, use Algo mode to filter noise and manage the TP/SL boxes.
How to Use
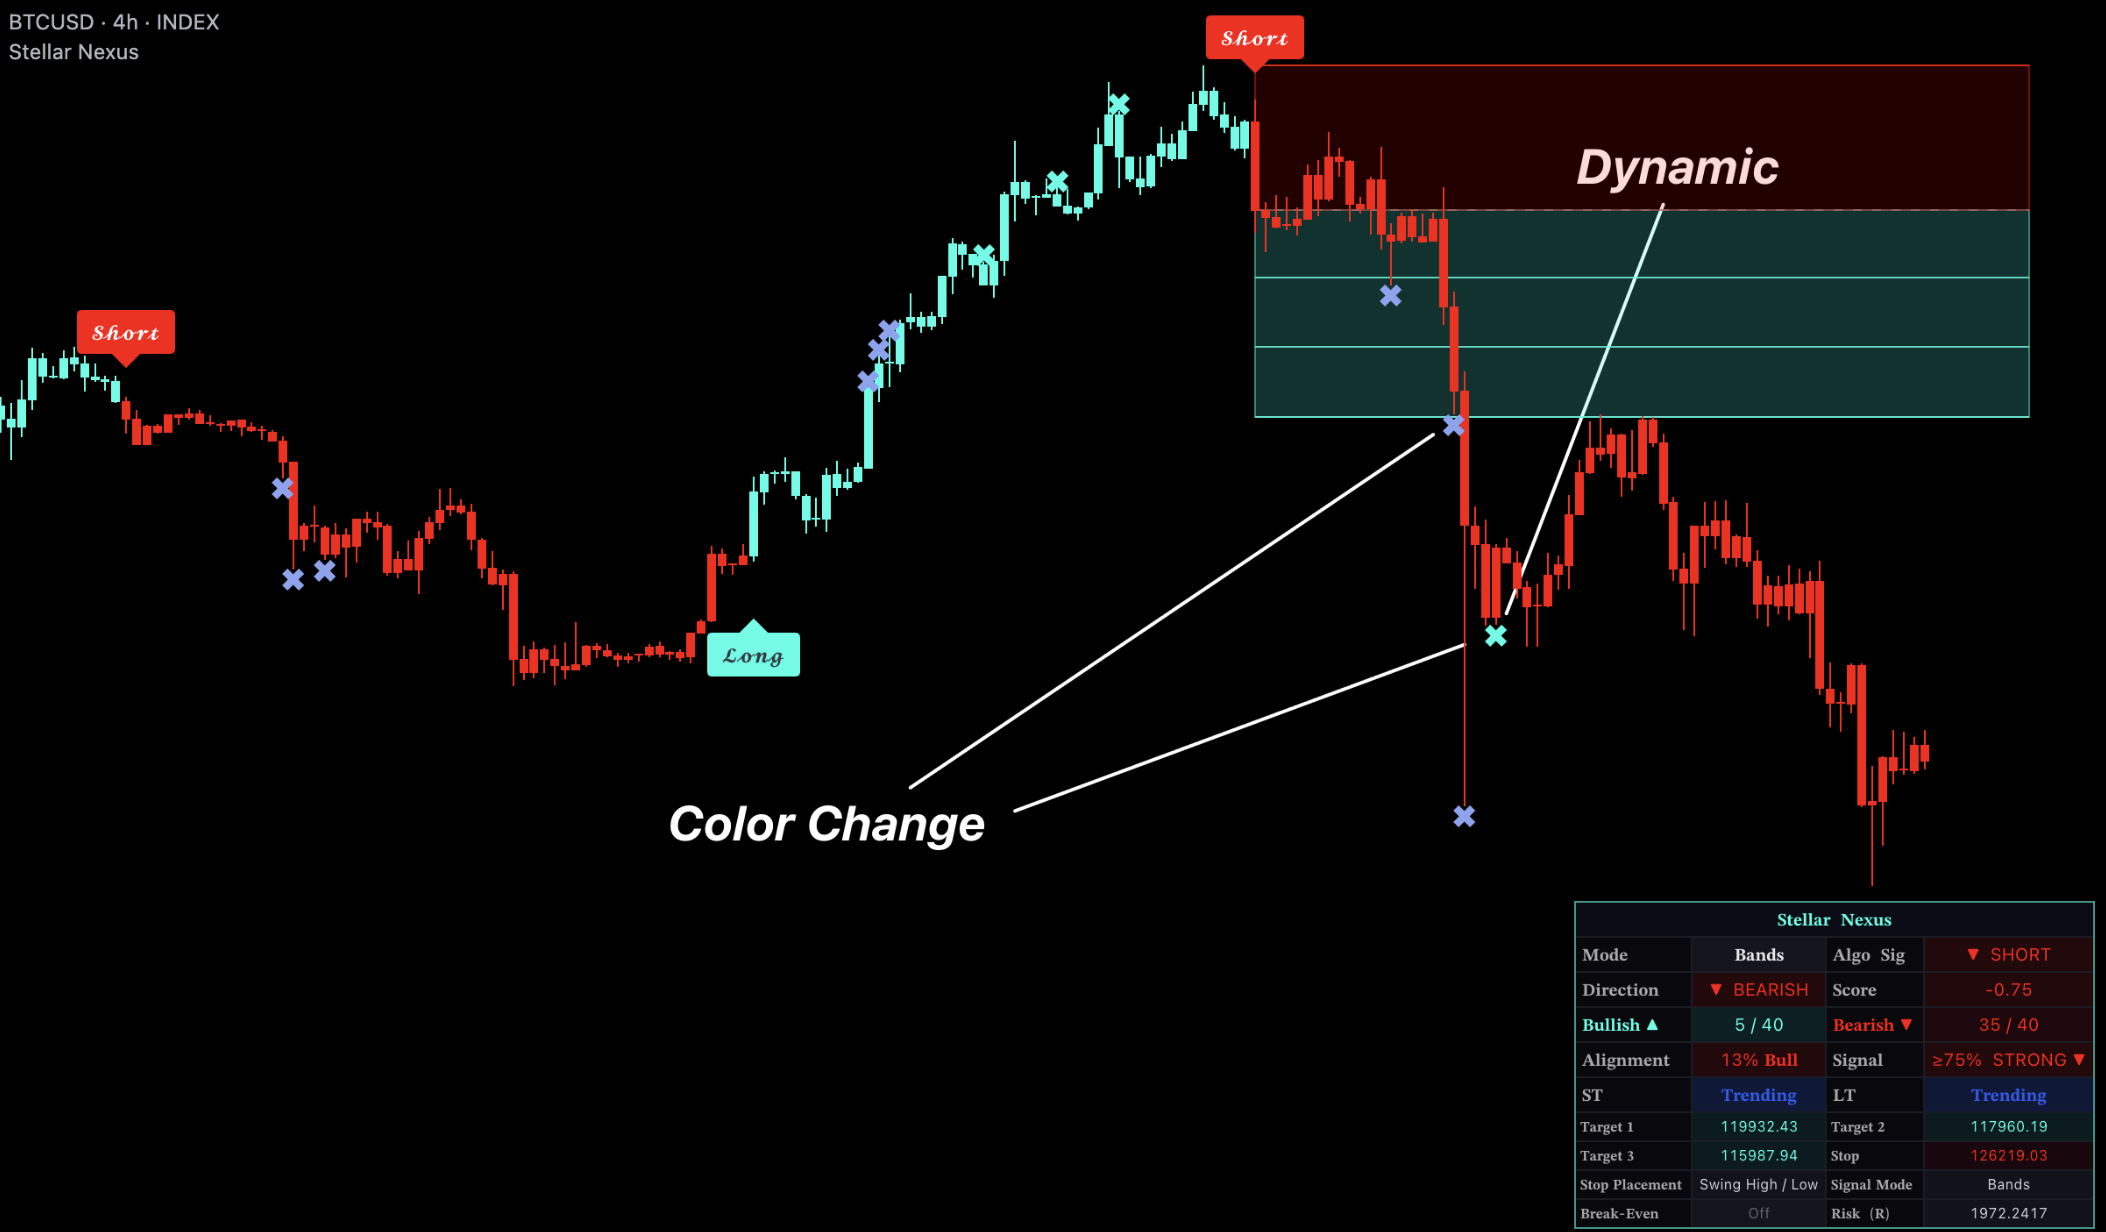
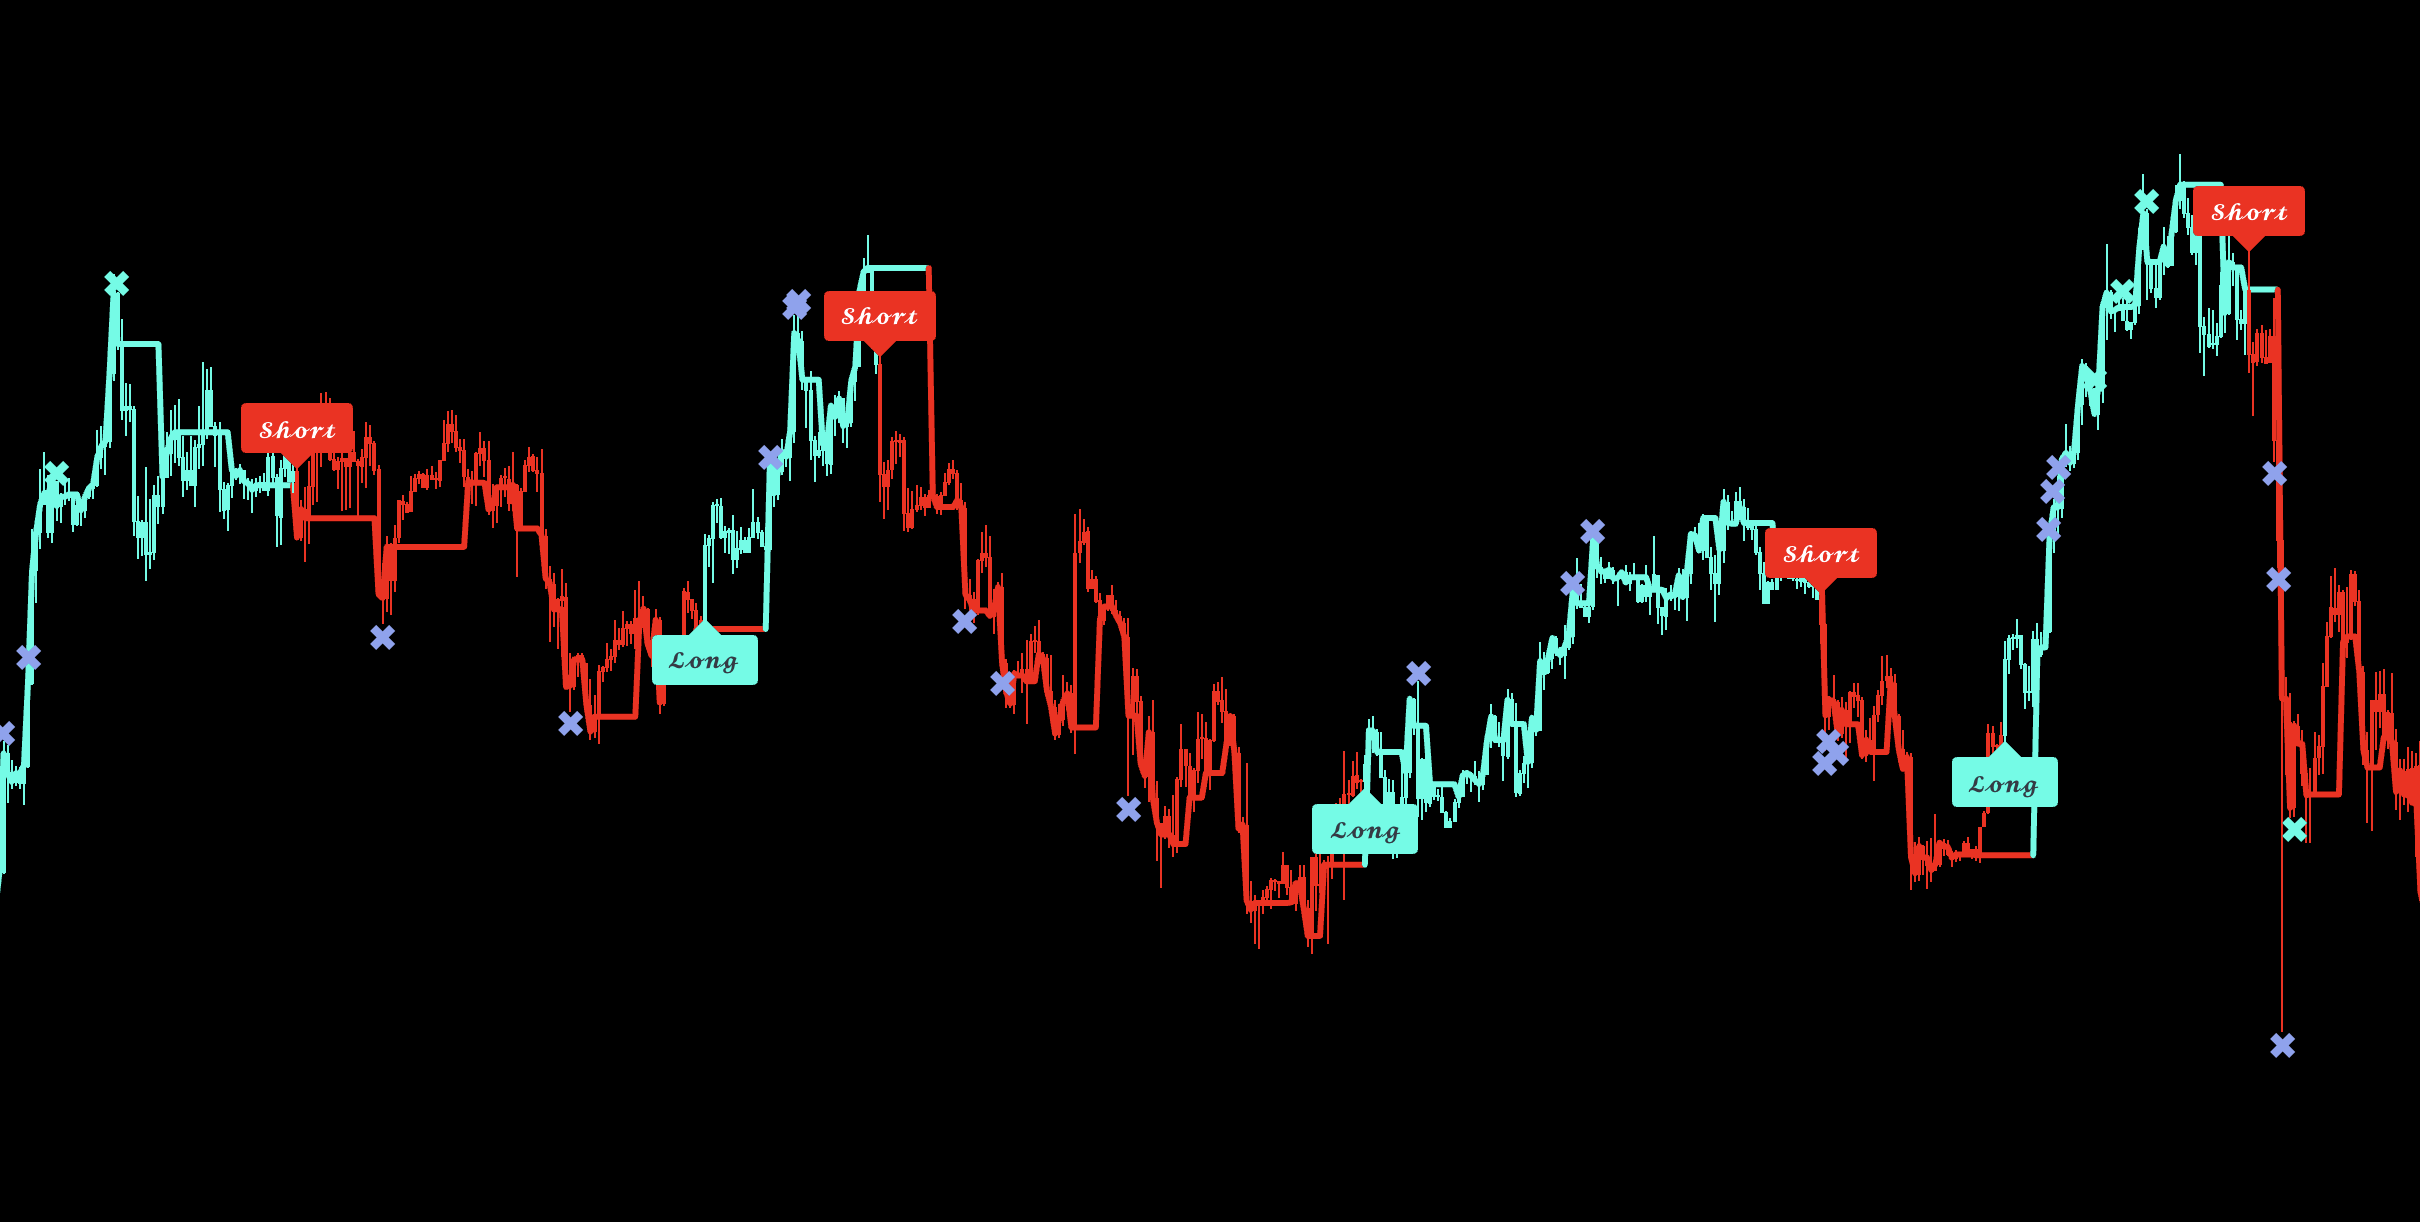
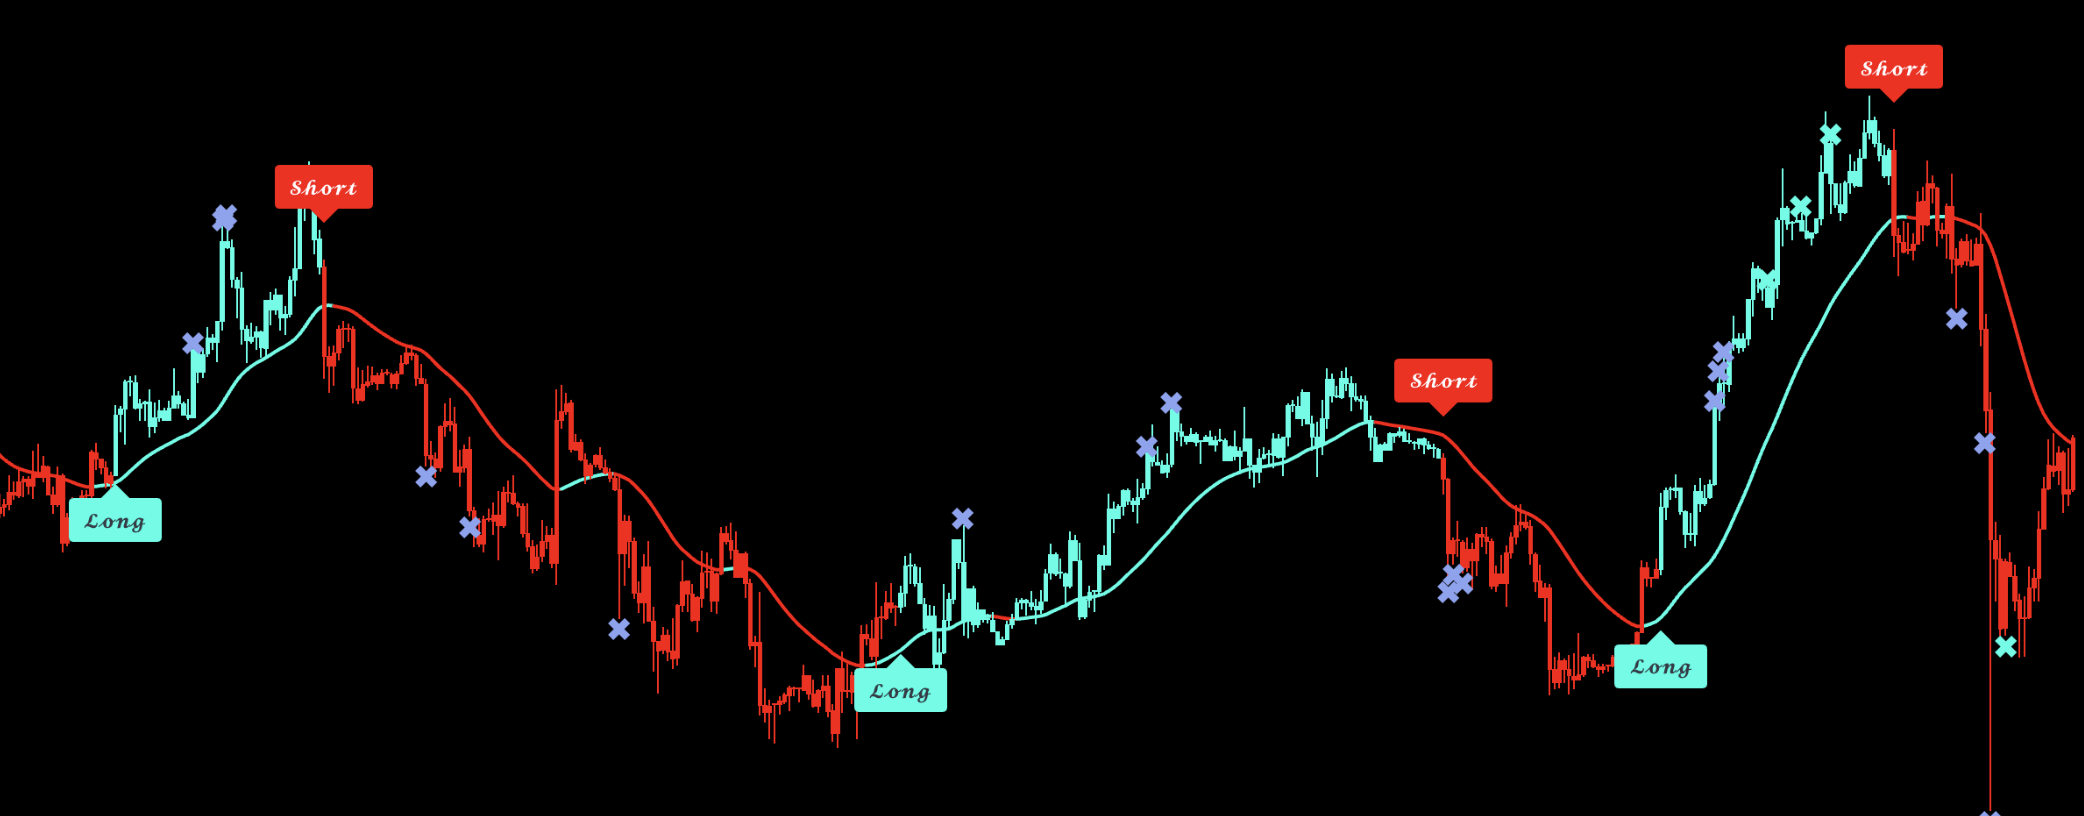
Bands Mode — Daily
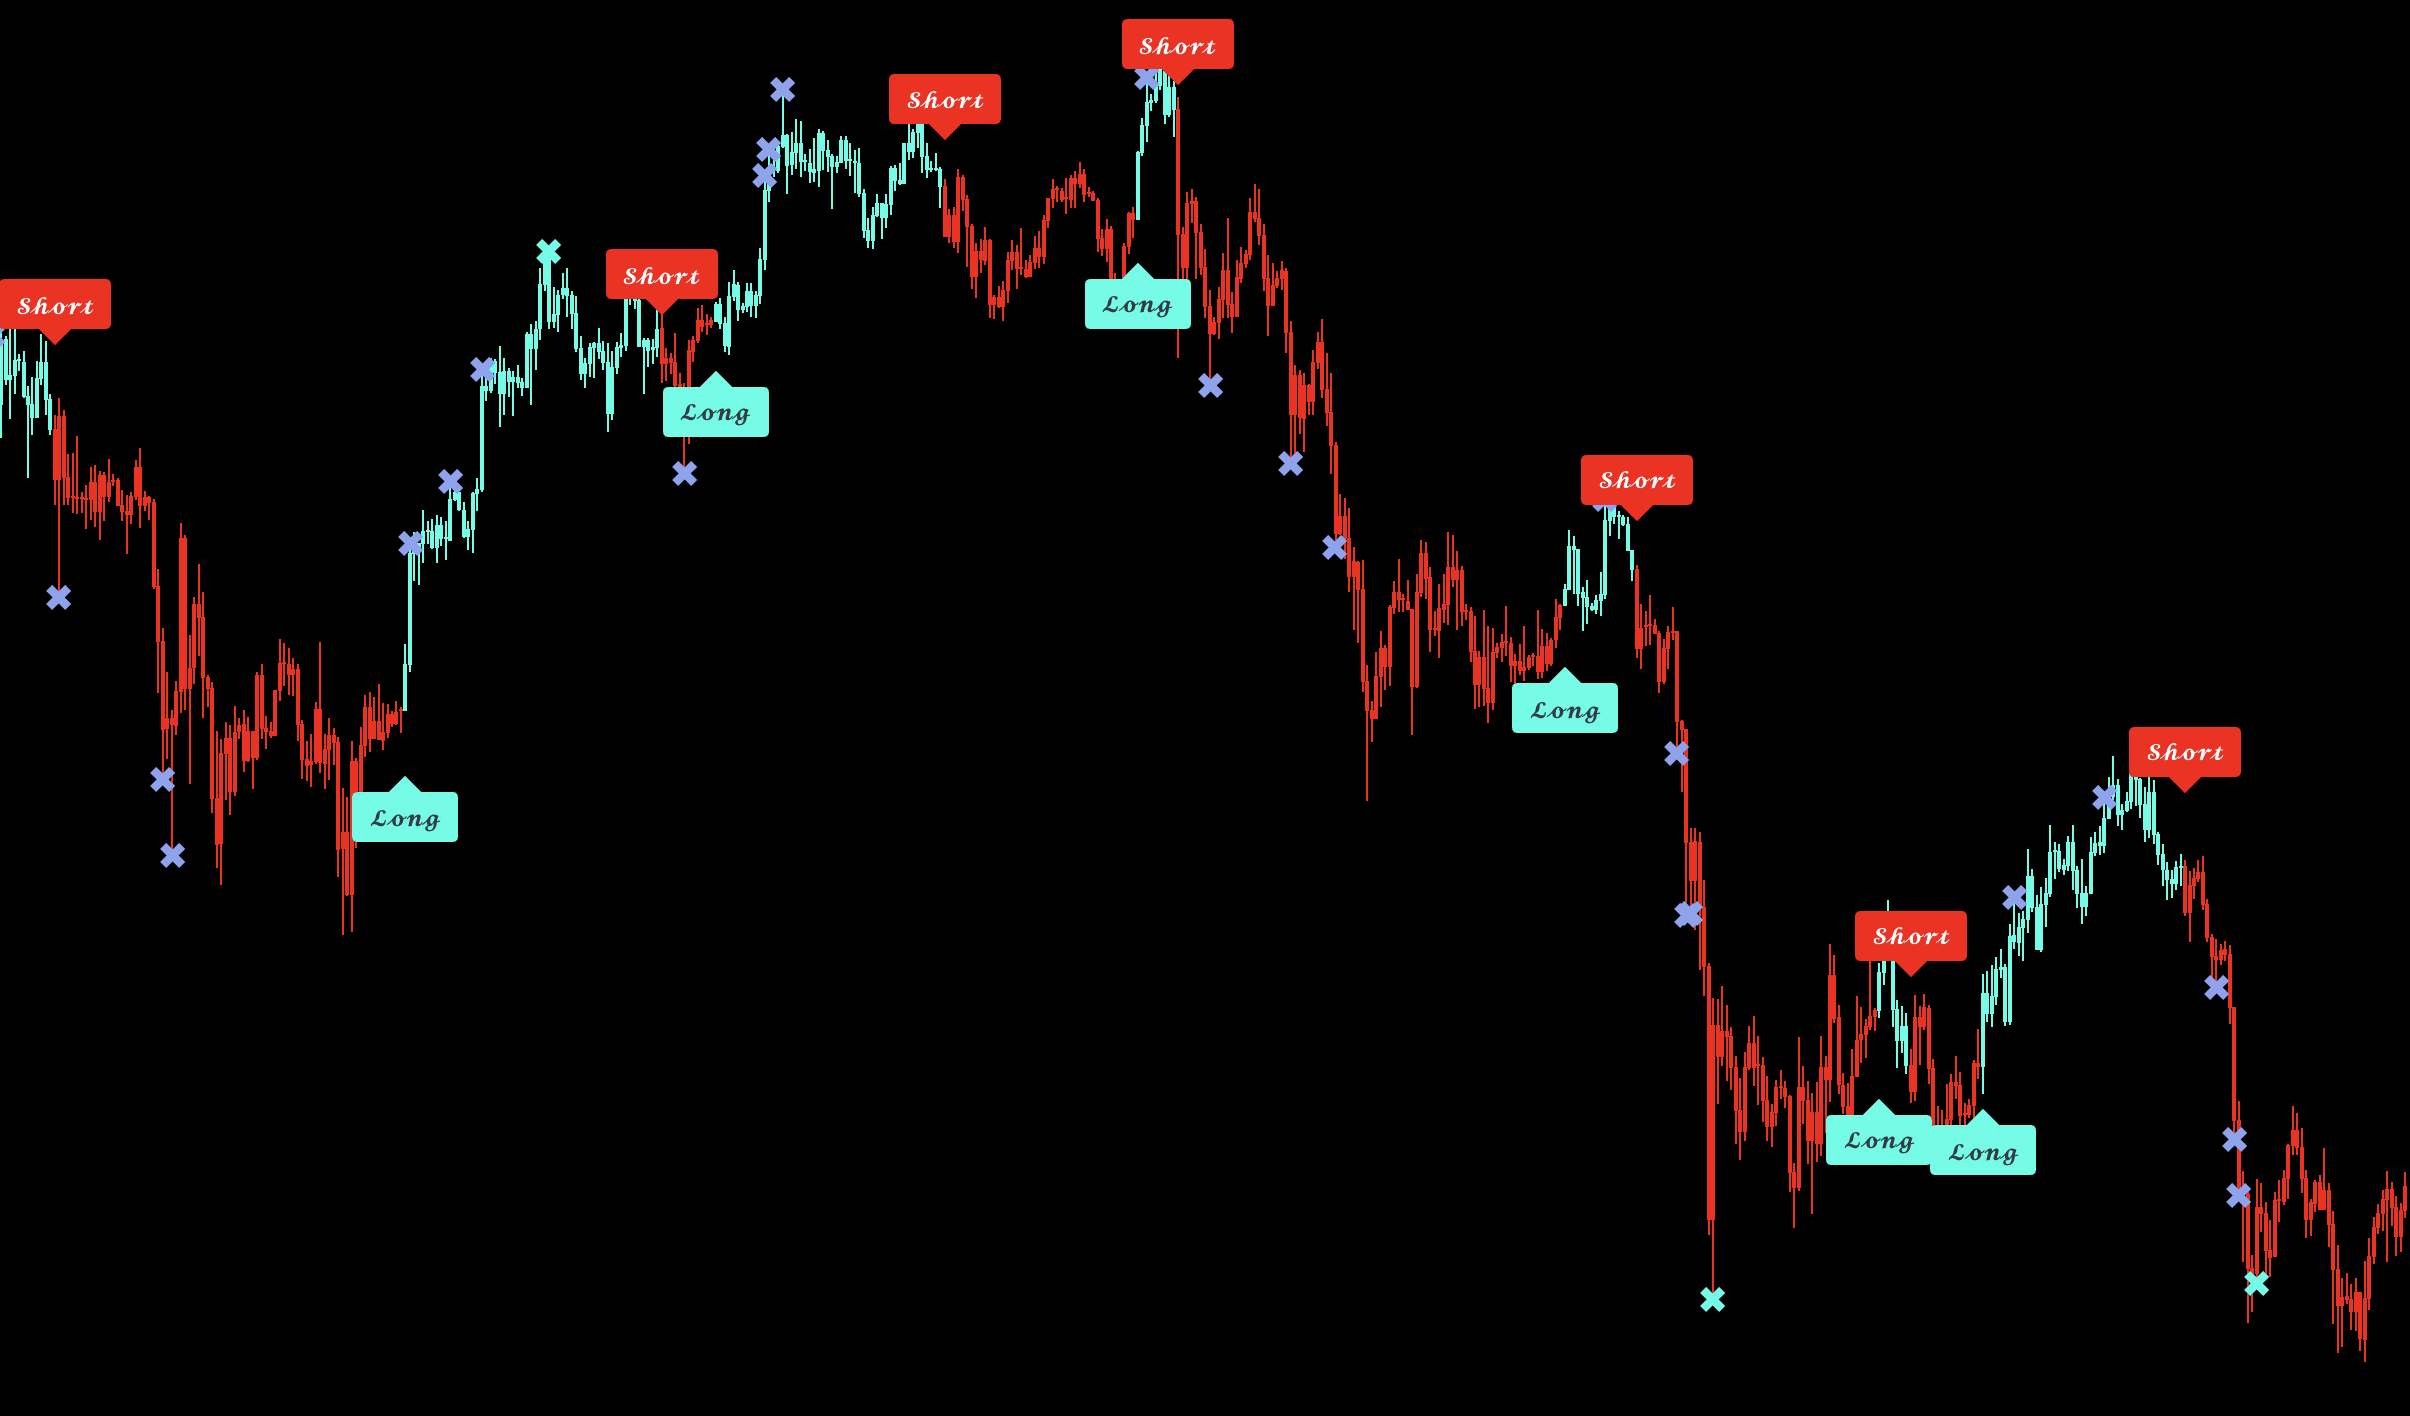
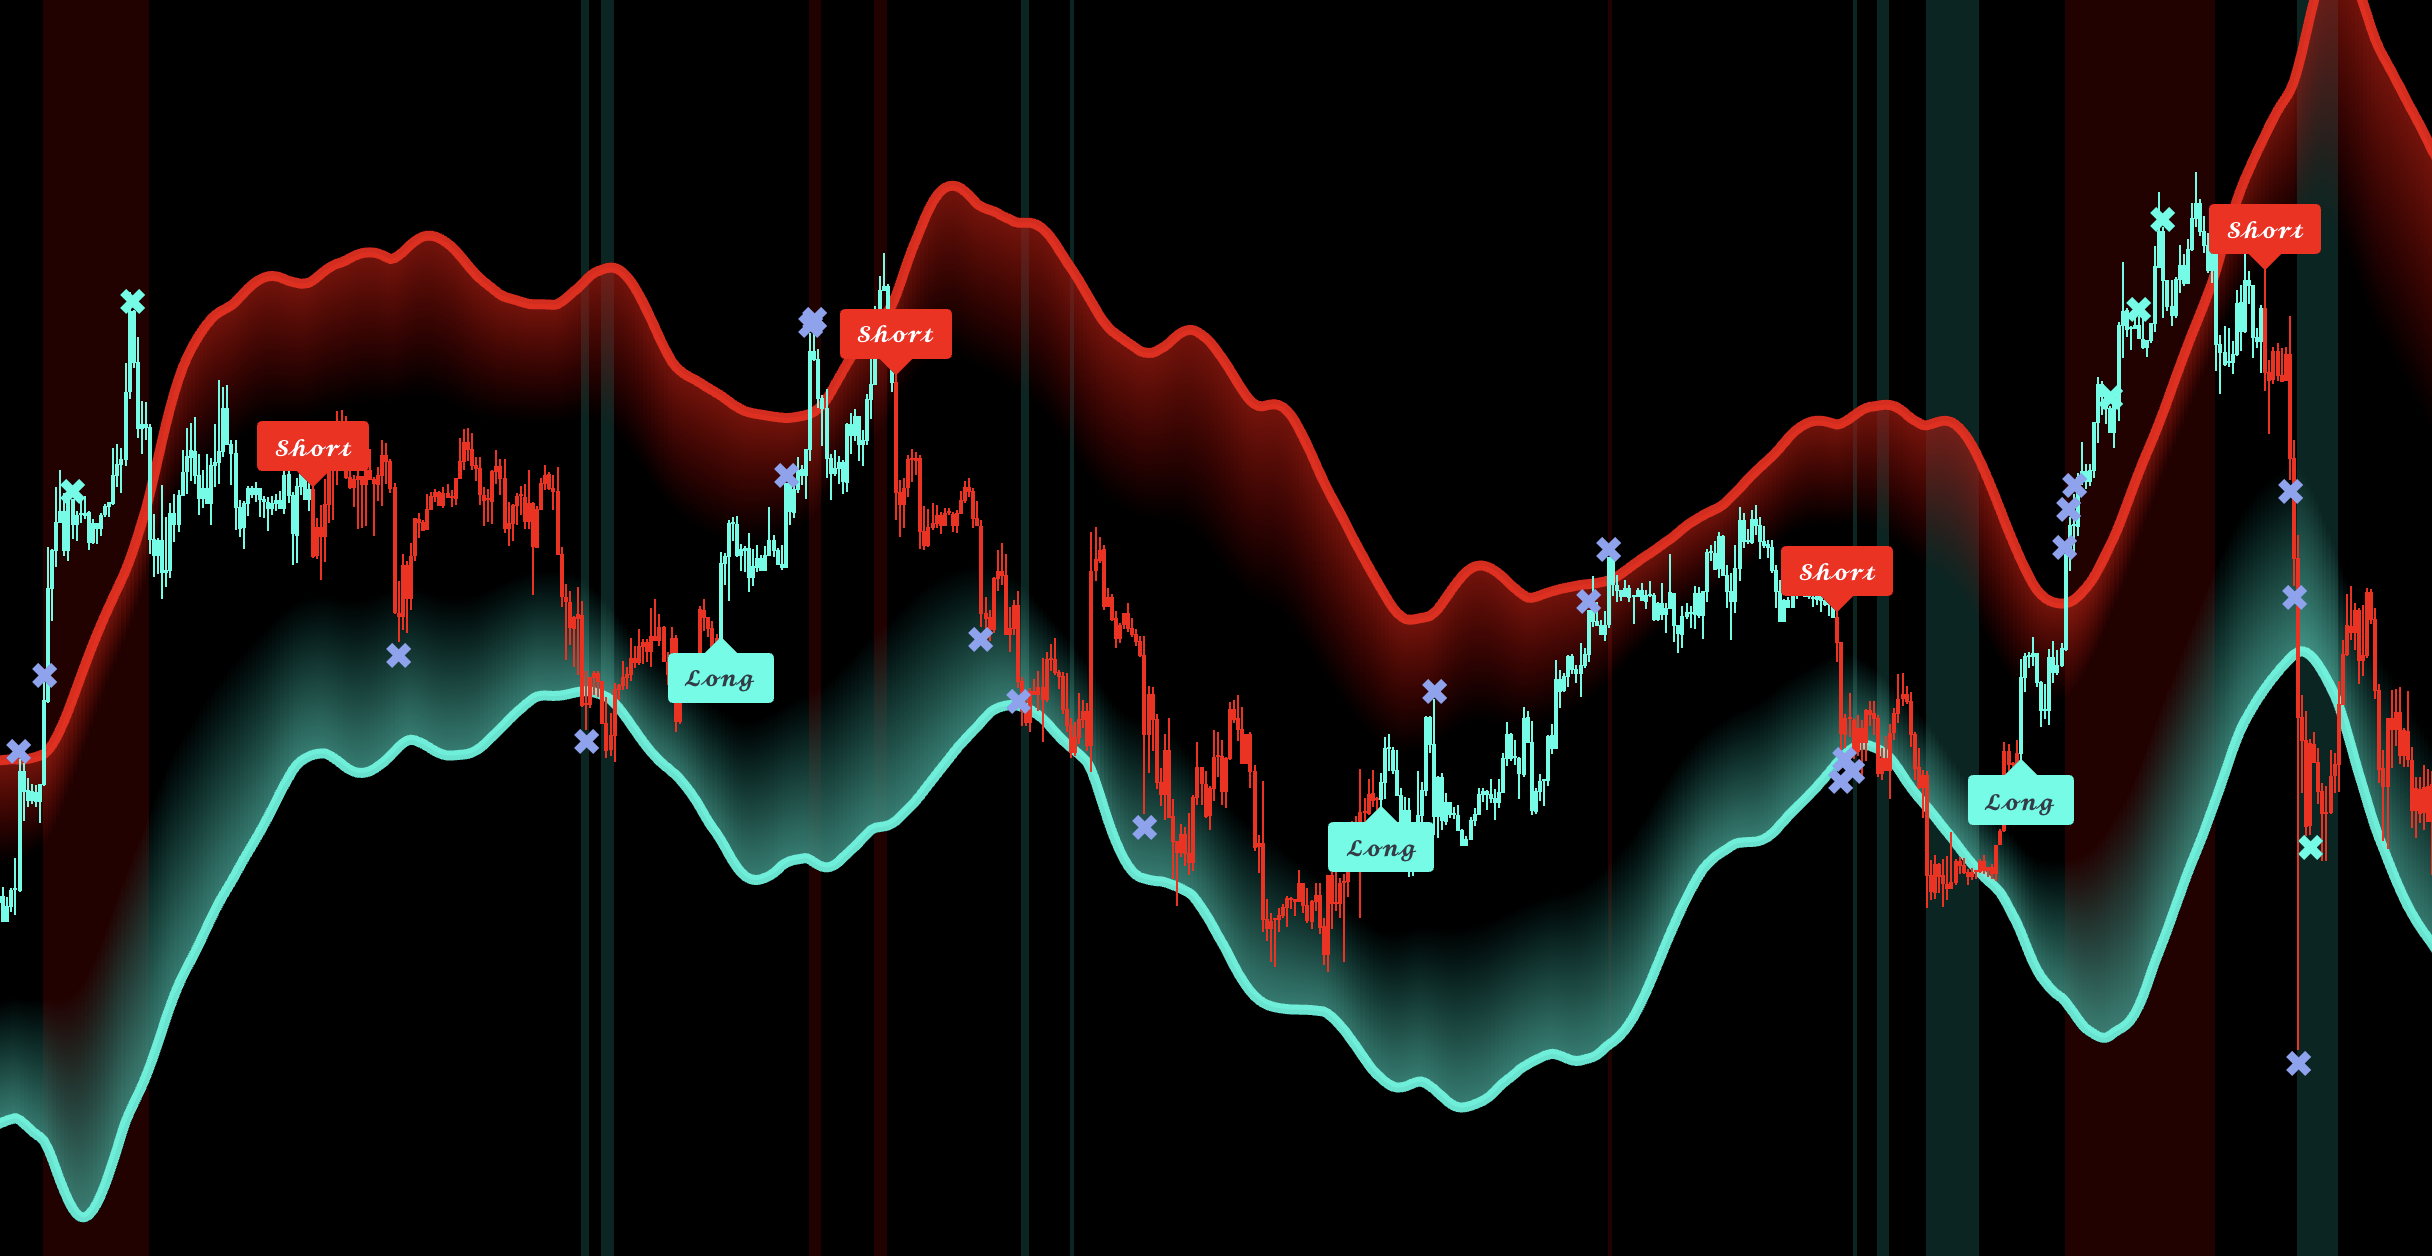
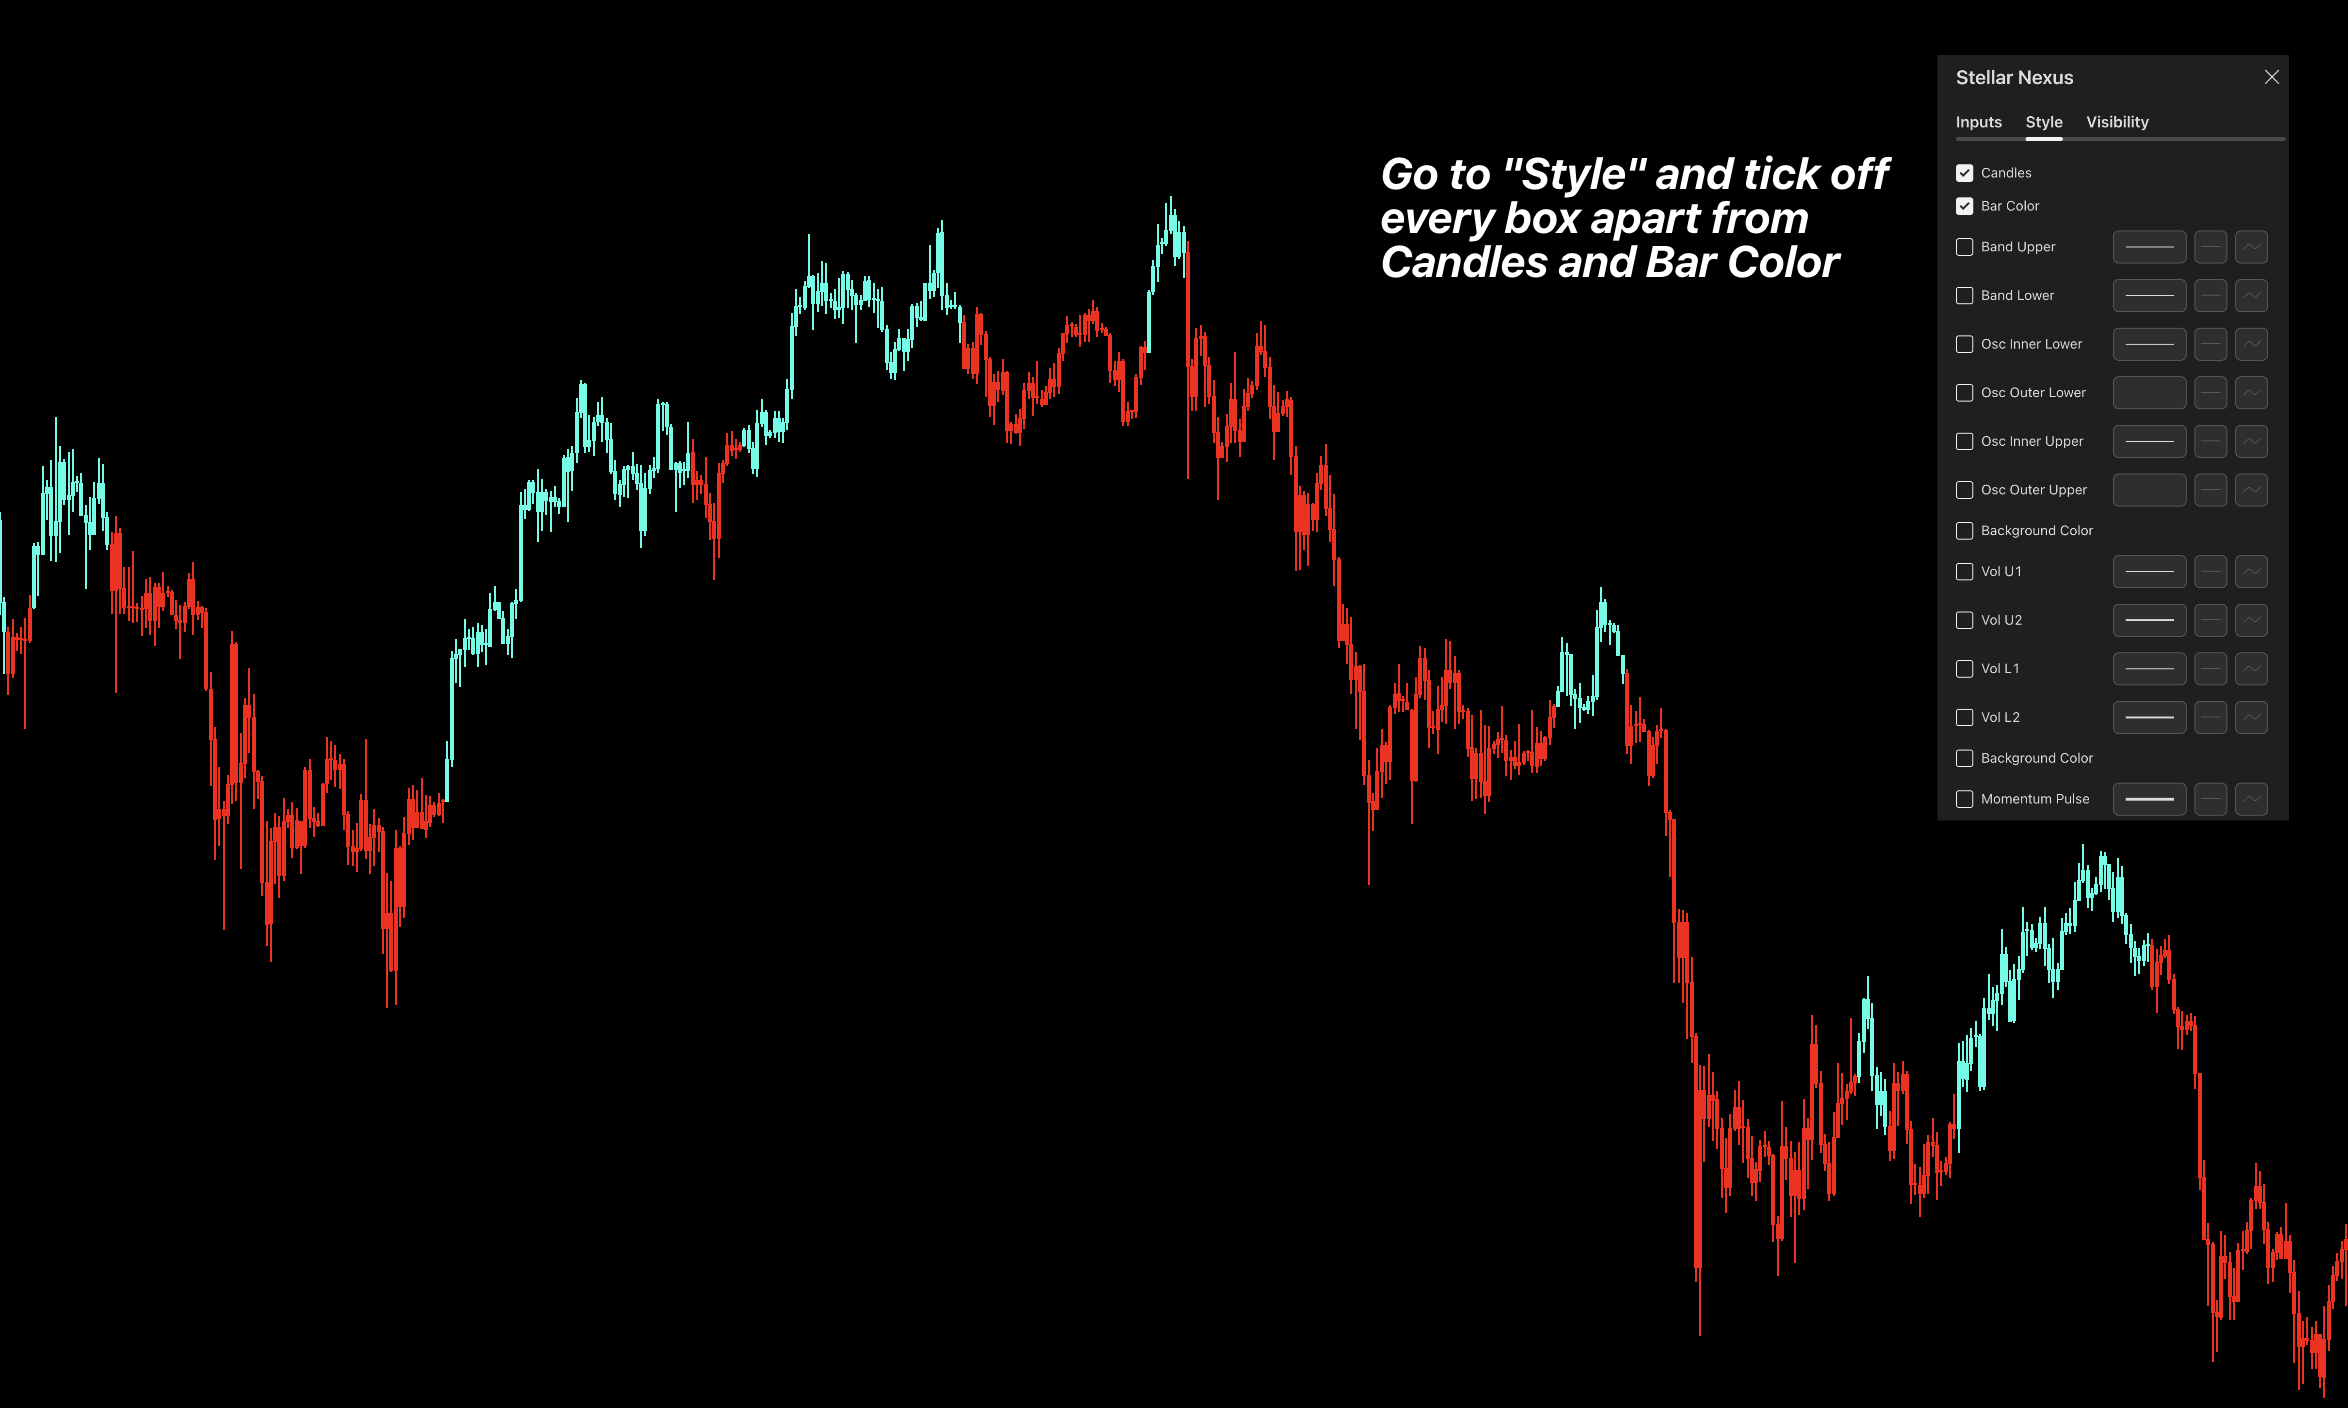
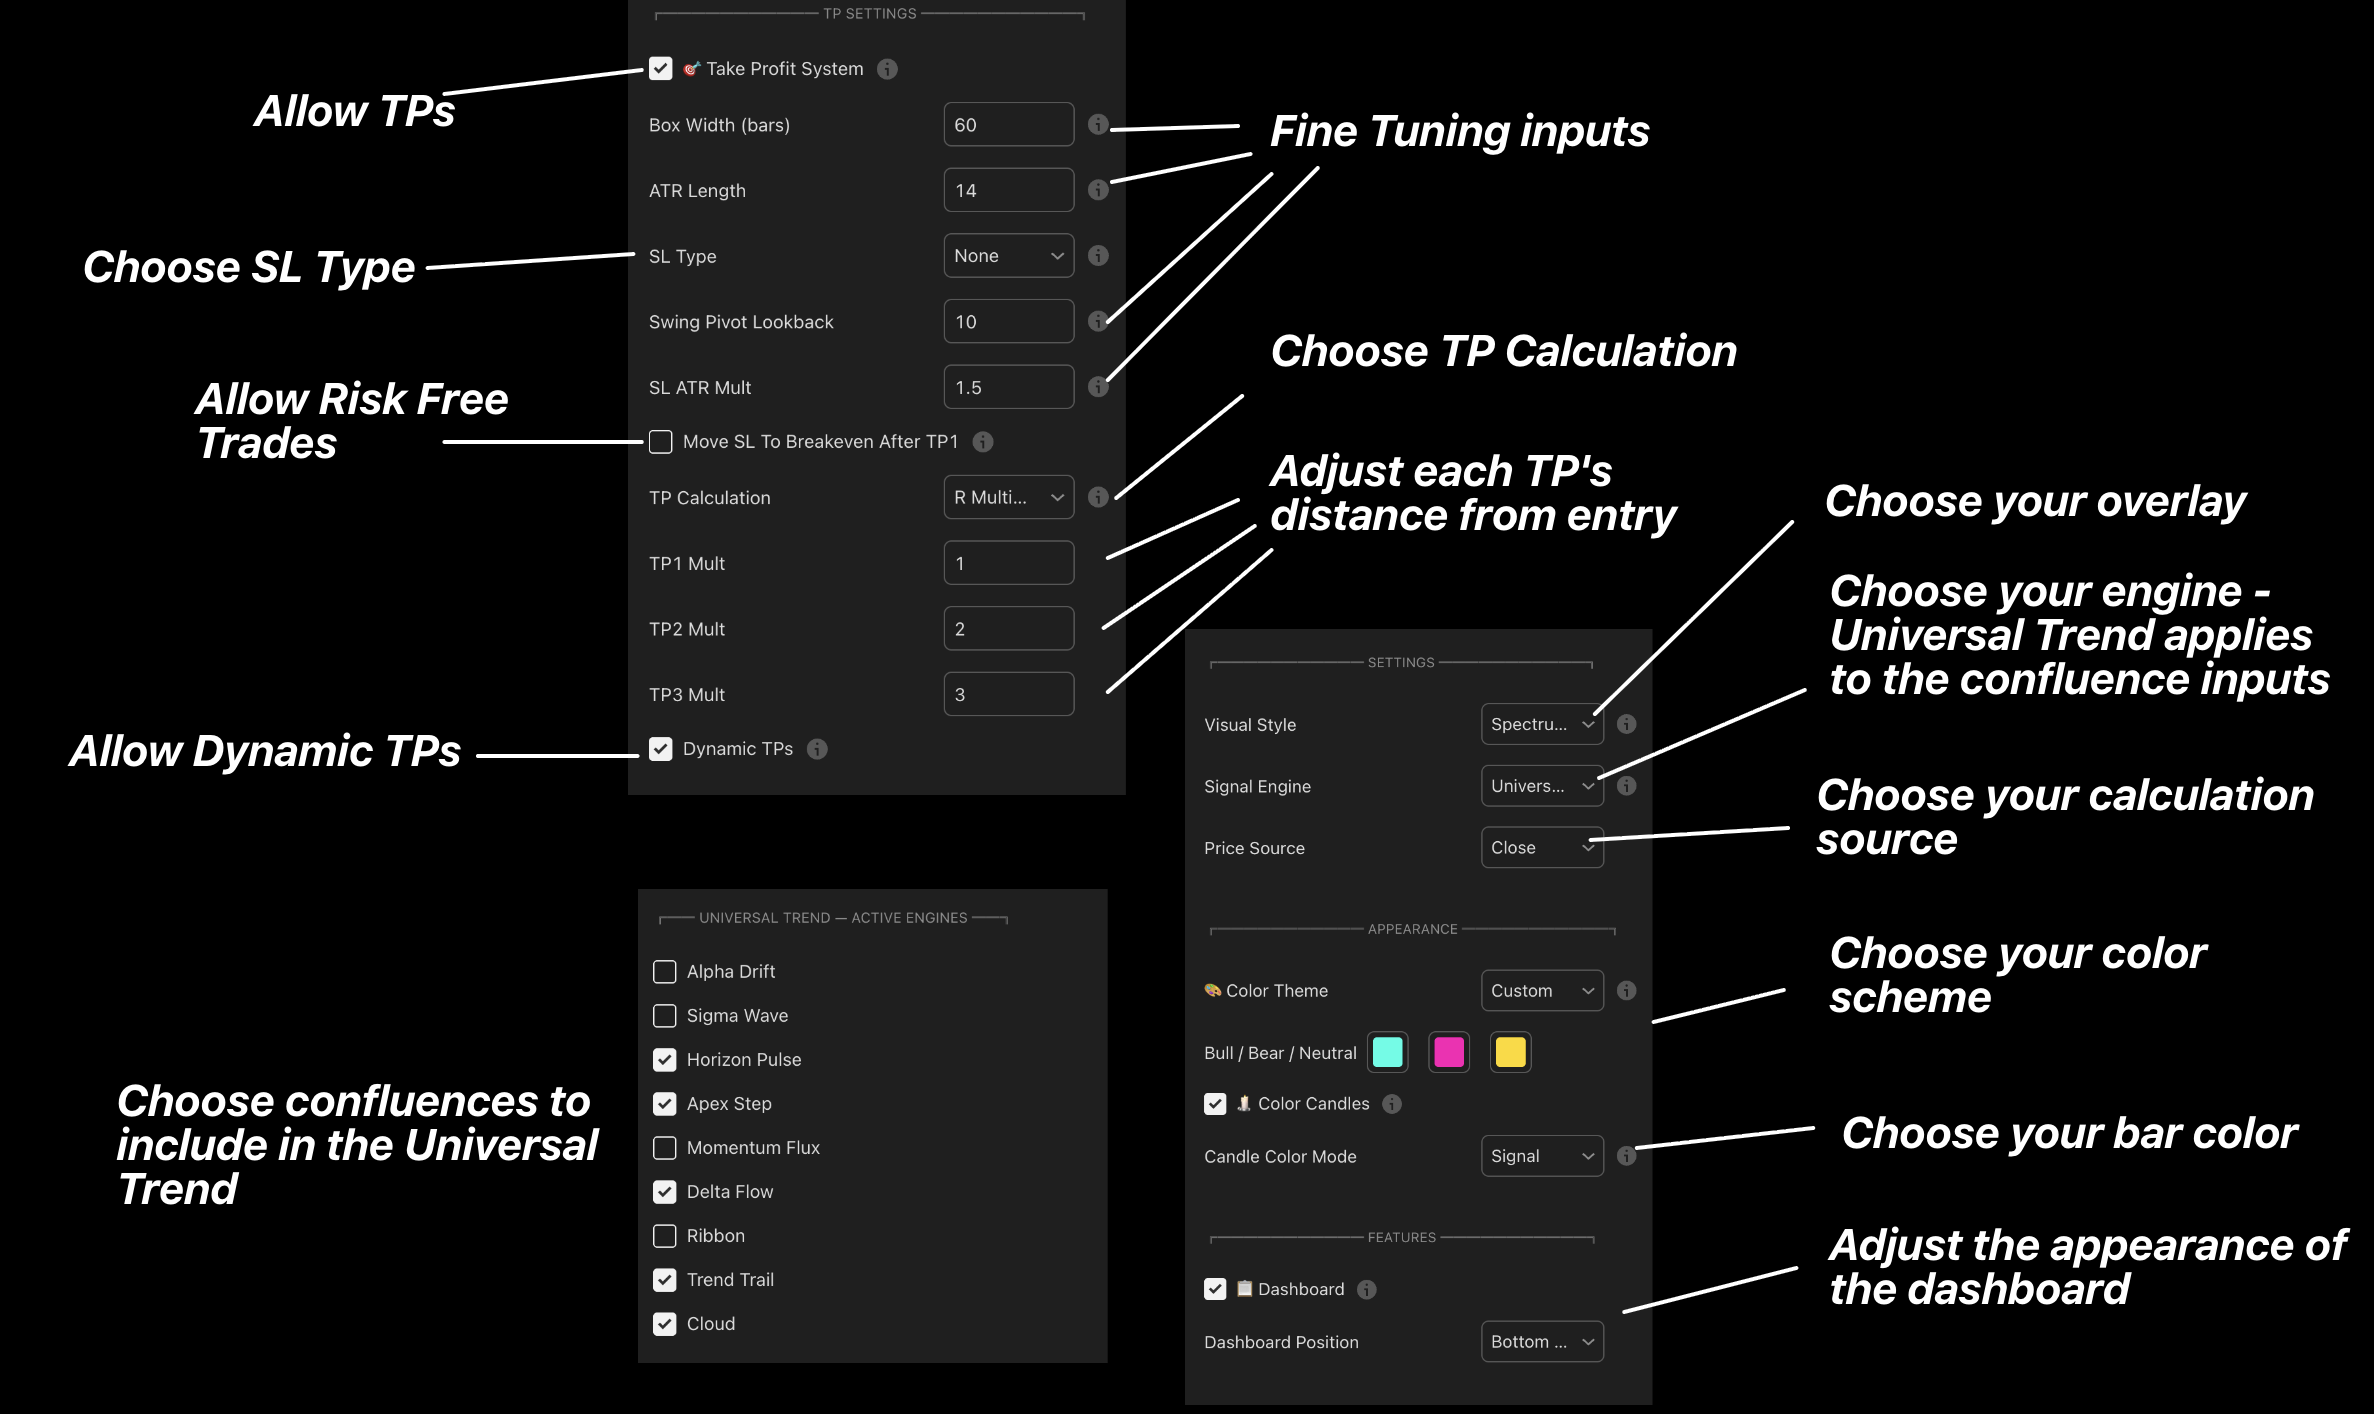
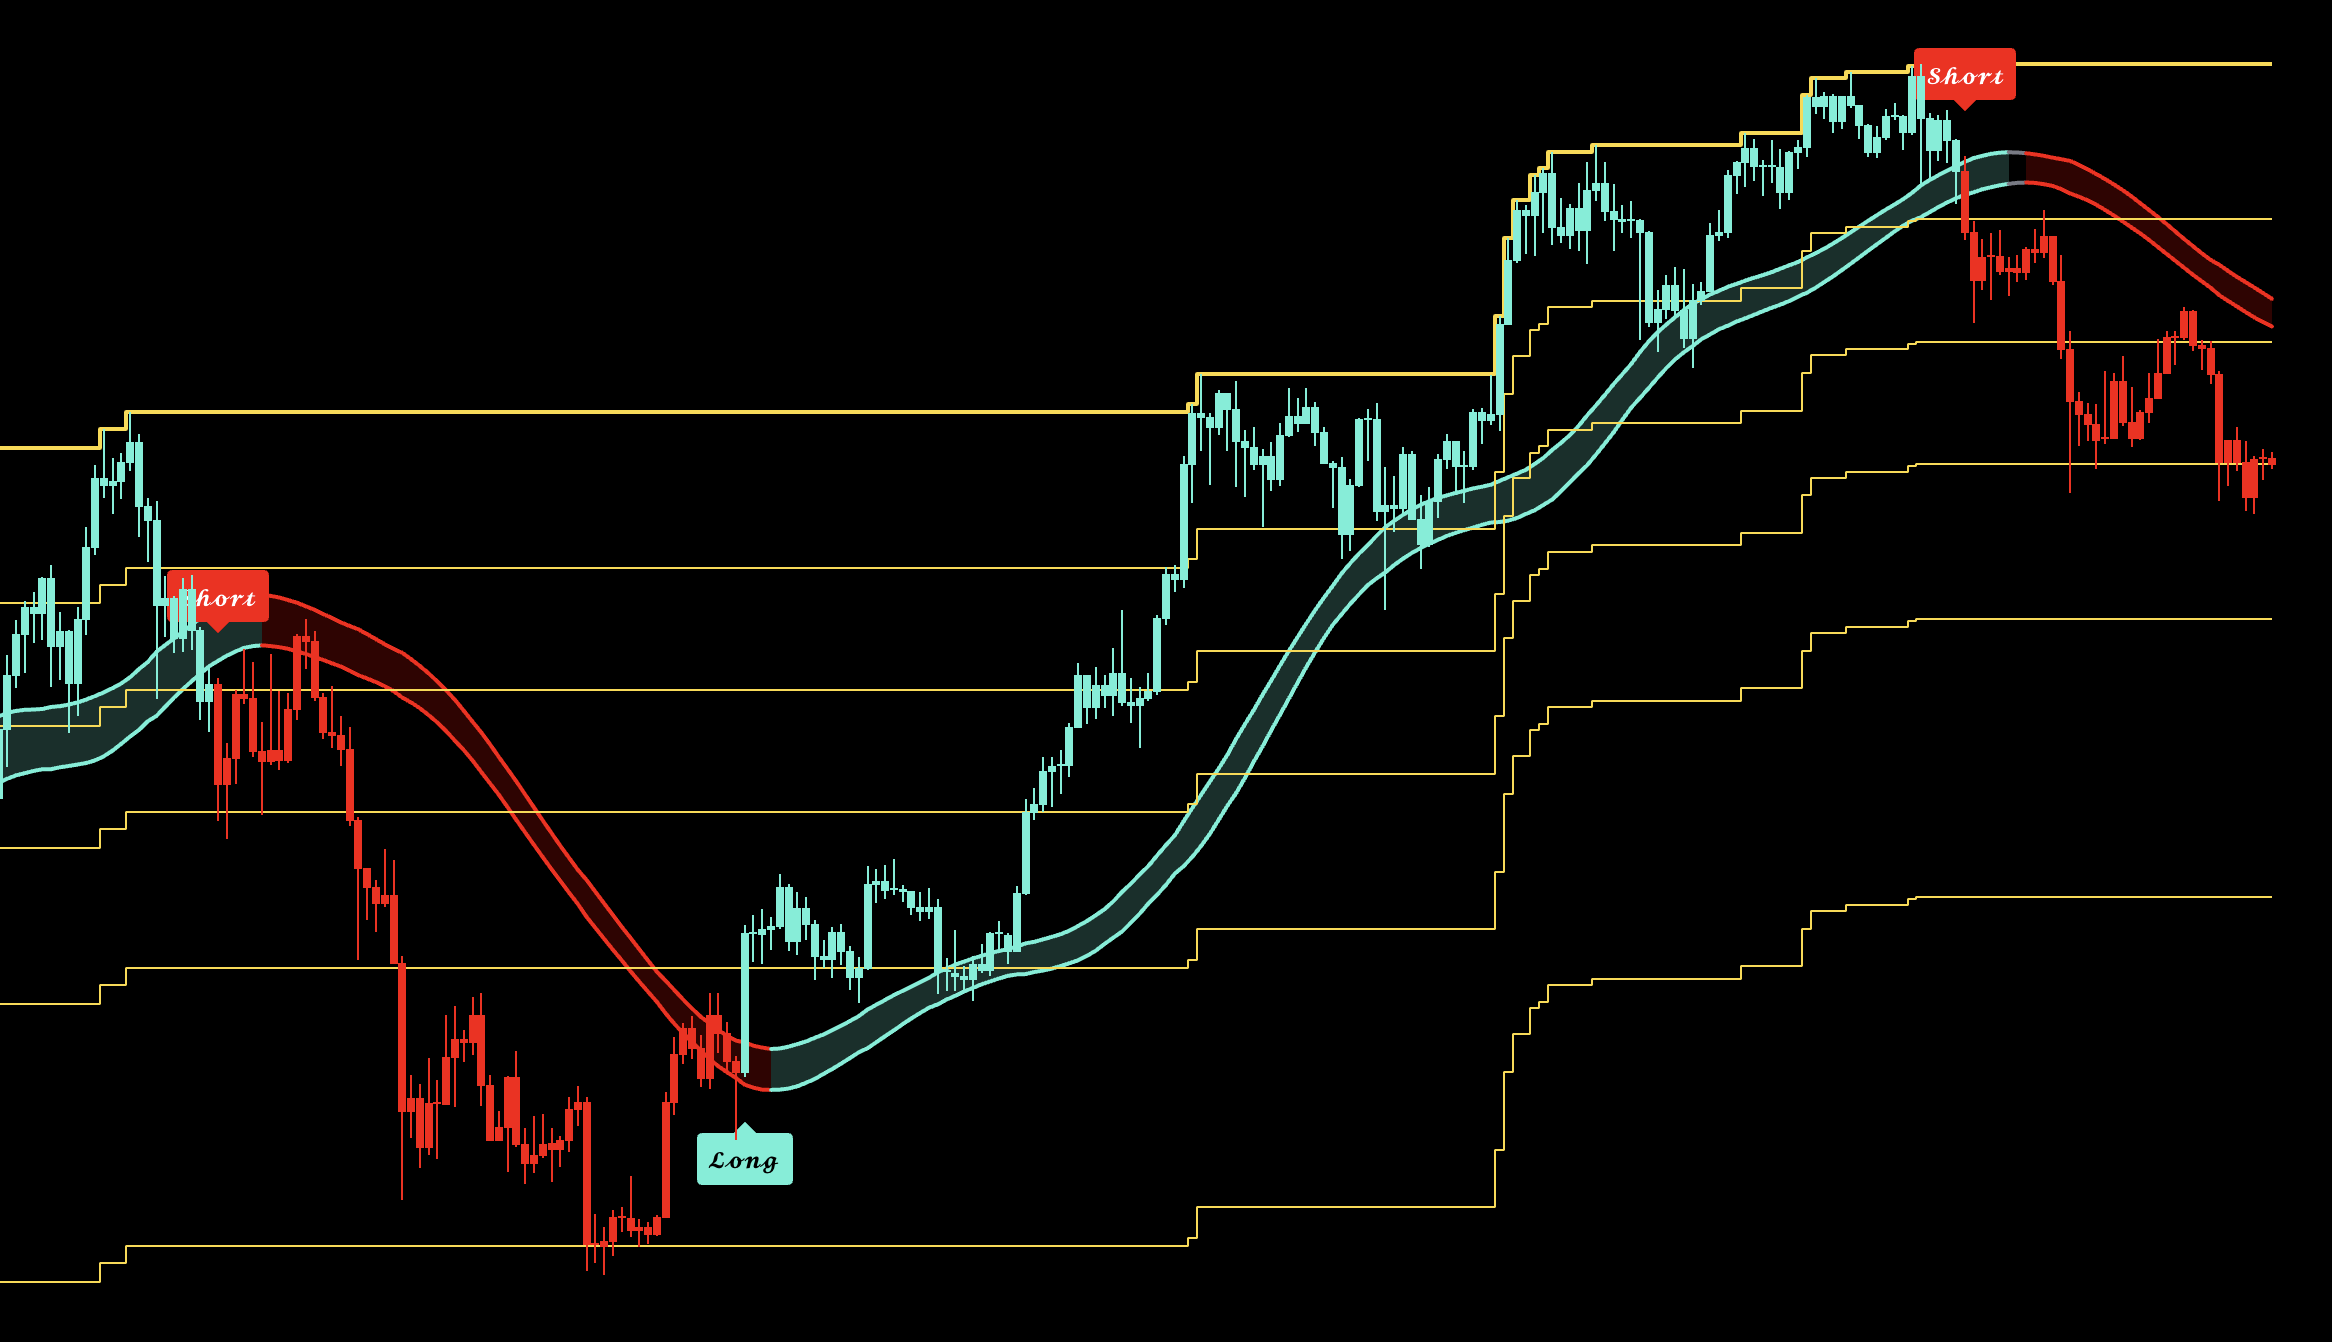
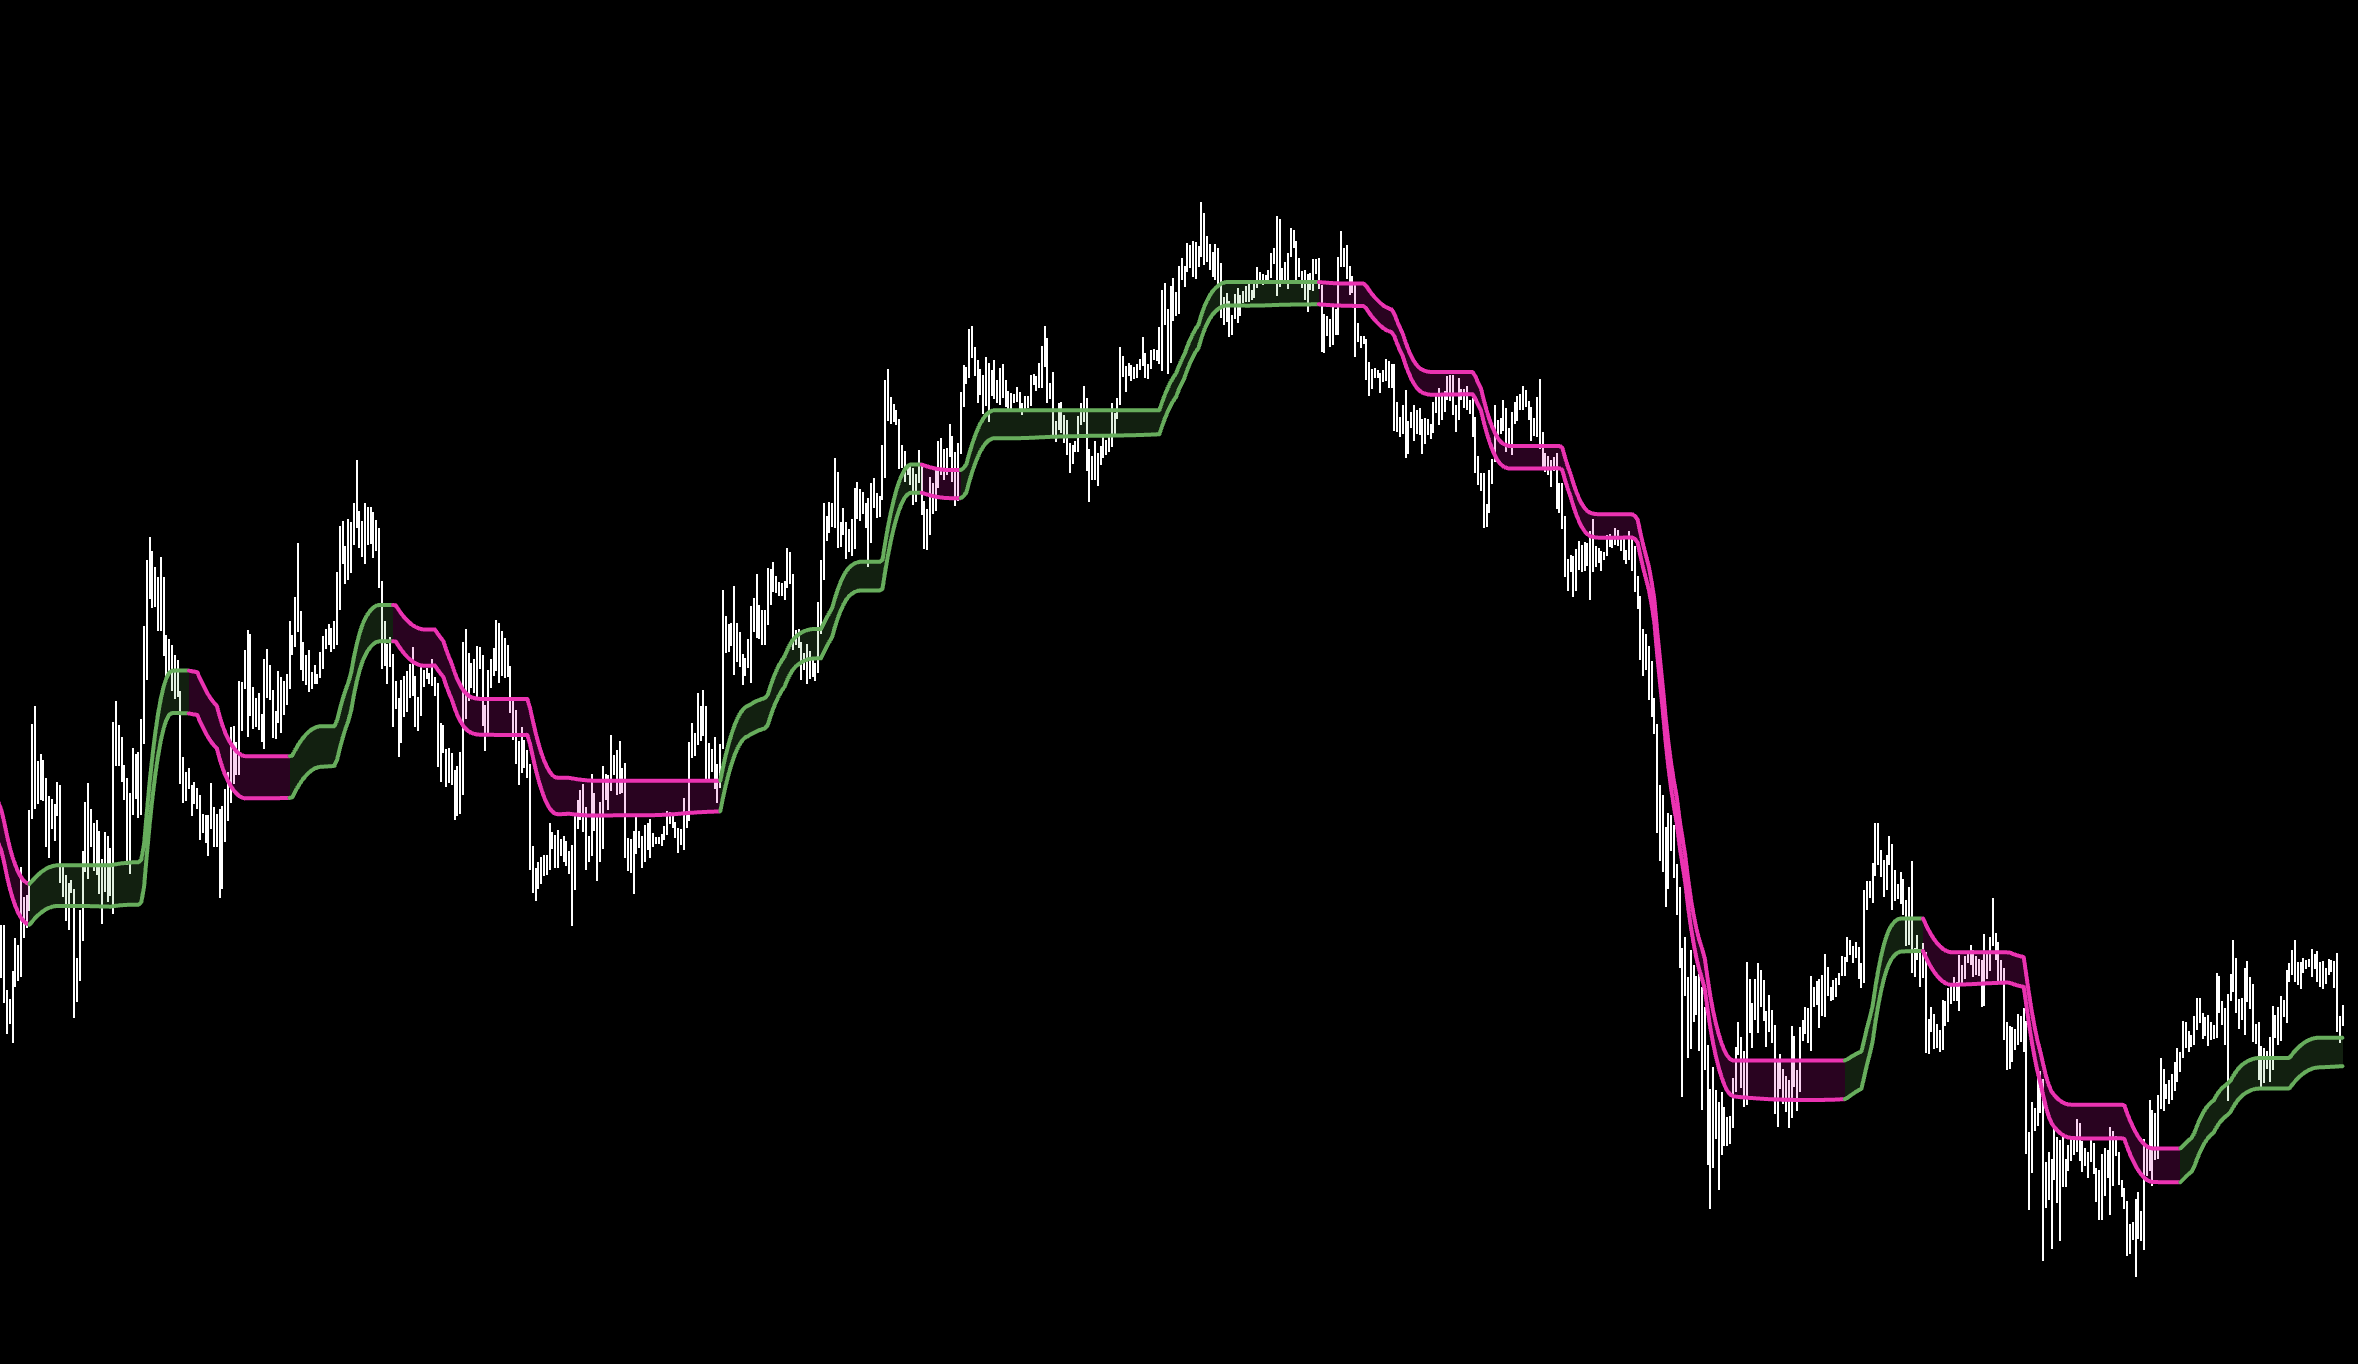
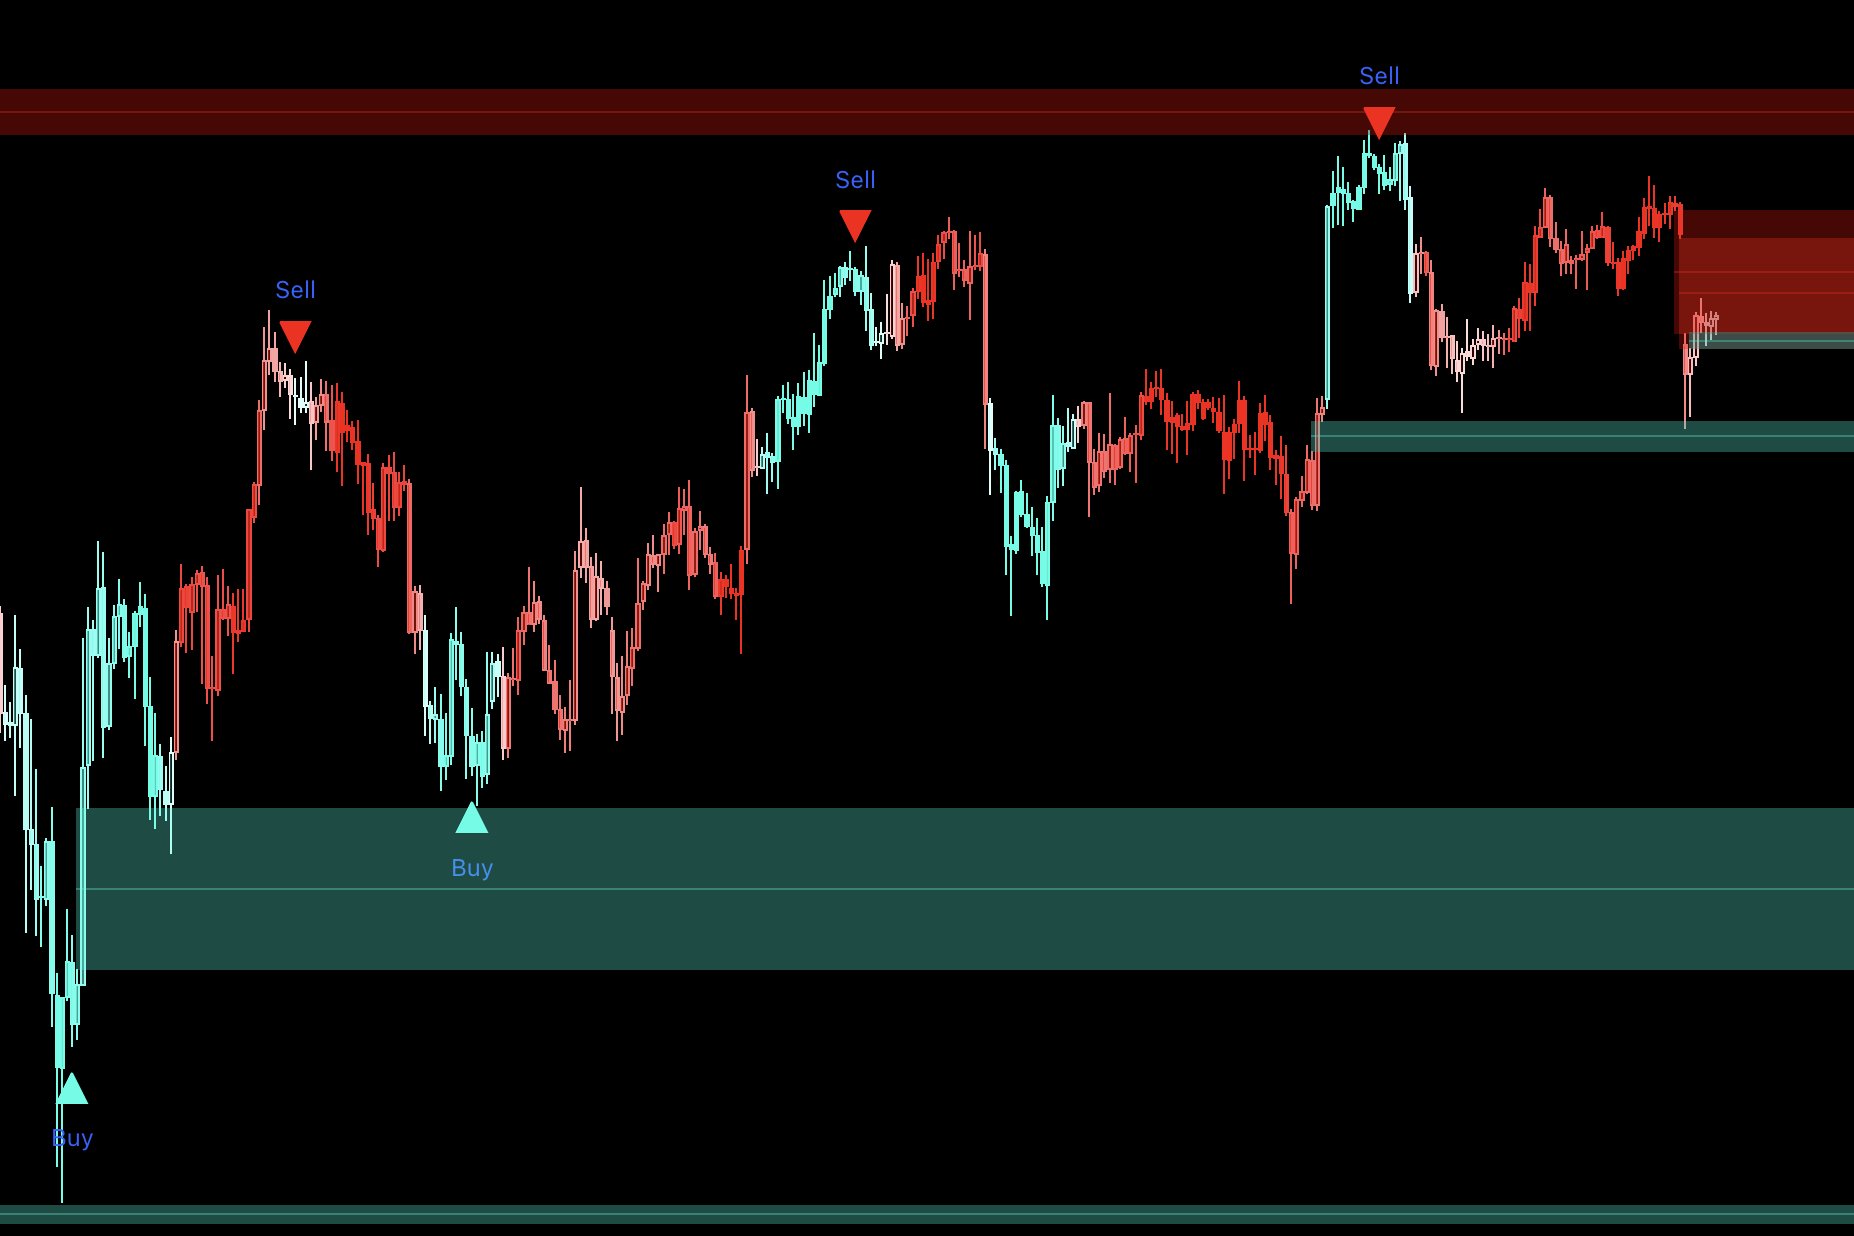
Set the chart to 1D and use Bands mode. Enter on the confirmed Long or Short signal and stay aligned until the opposite signal. The bands show the active directional framework around price, but the signal remains the instruction—no extra confirmation is needed.
Here is how the TP inputs work for the Daily workflow: turn off TP1–TP3, Dynamic TP, and SL for a clean trend-following chart. Use this only when your plan is to follow direction from one signal to the next.
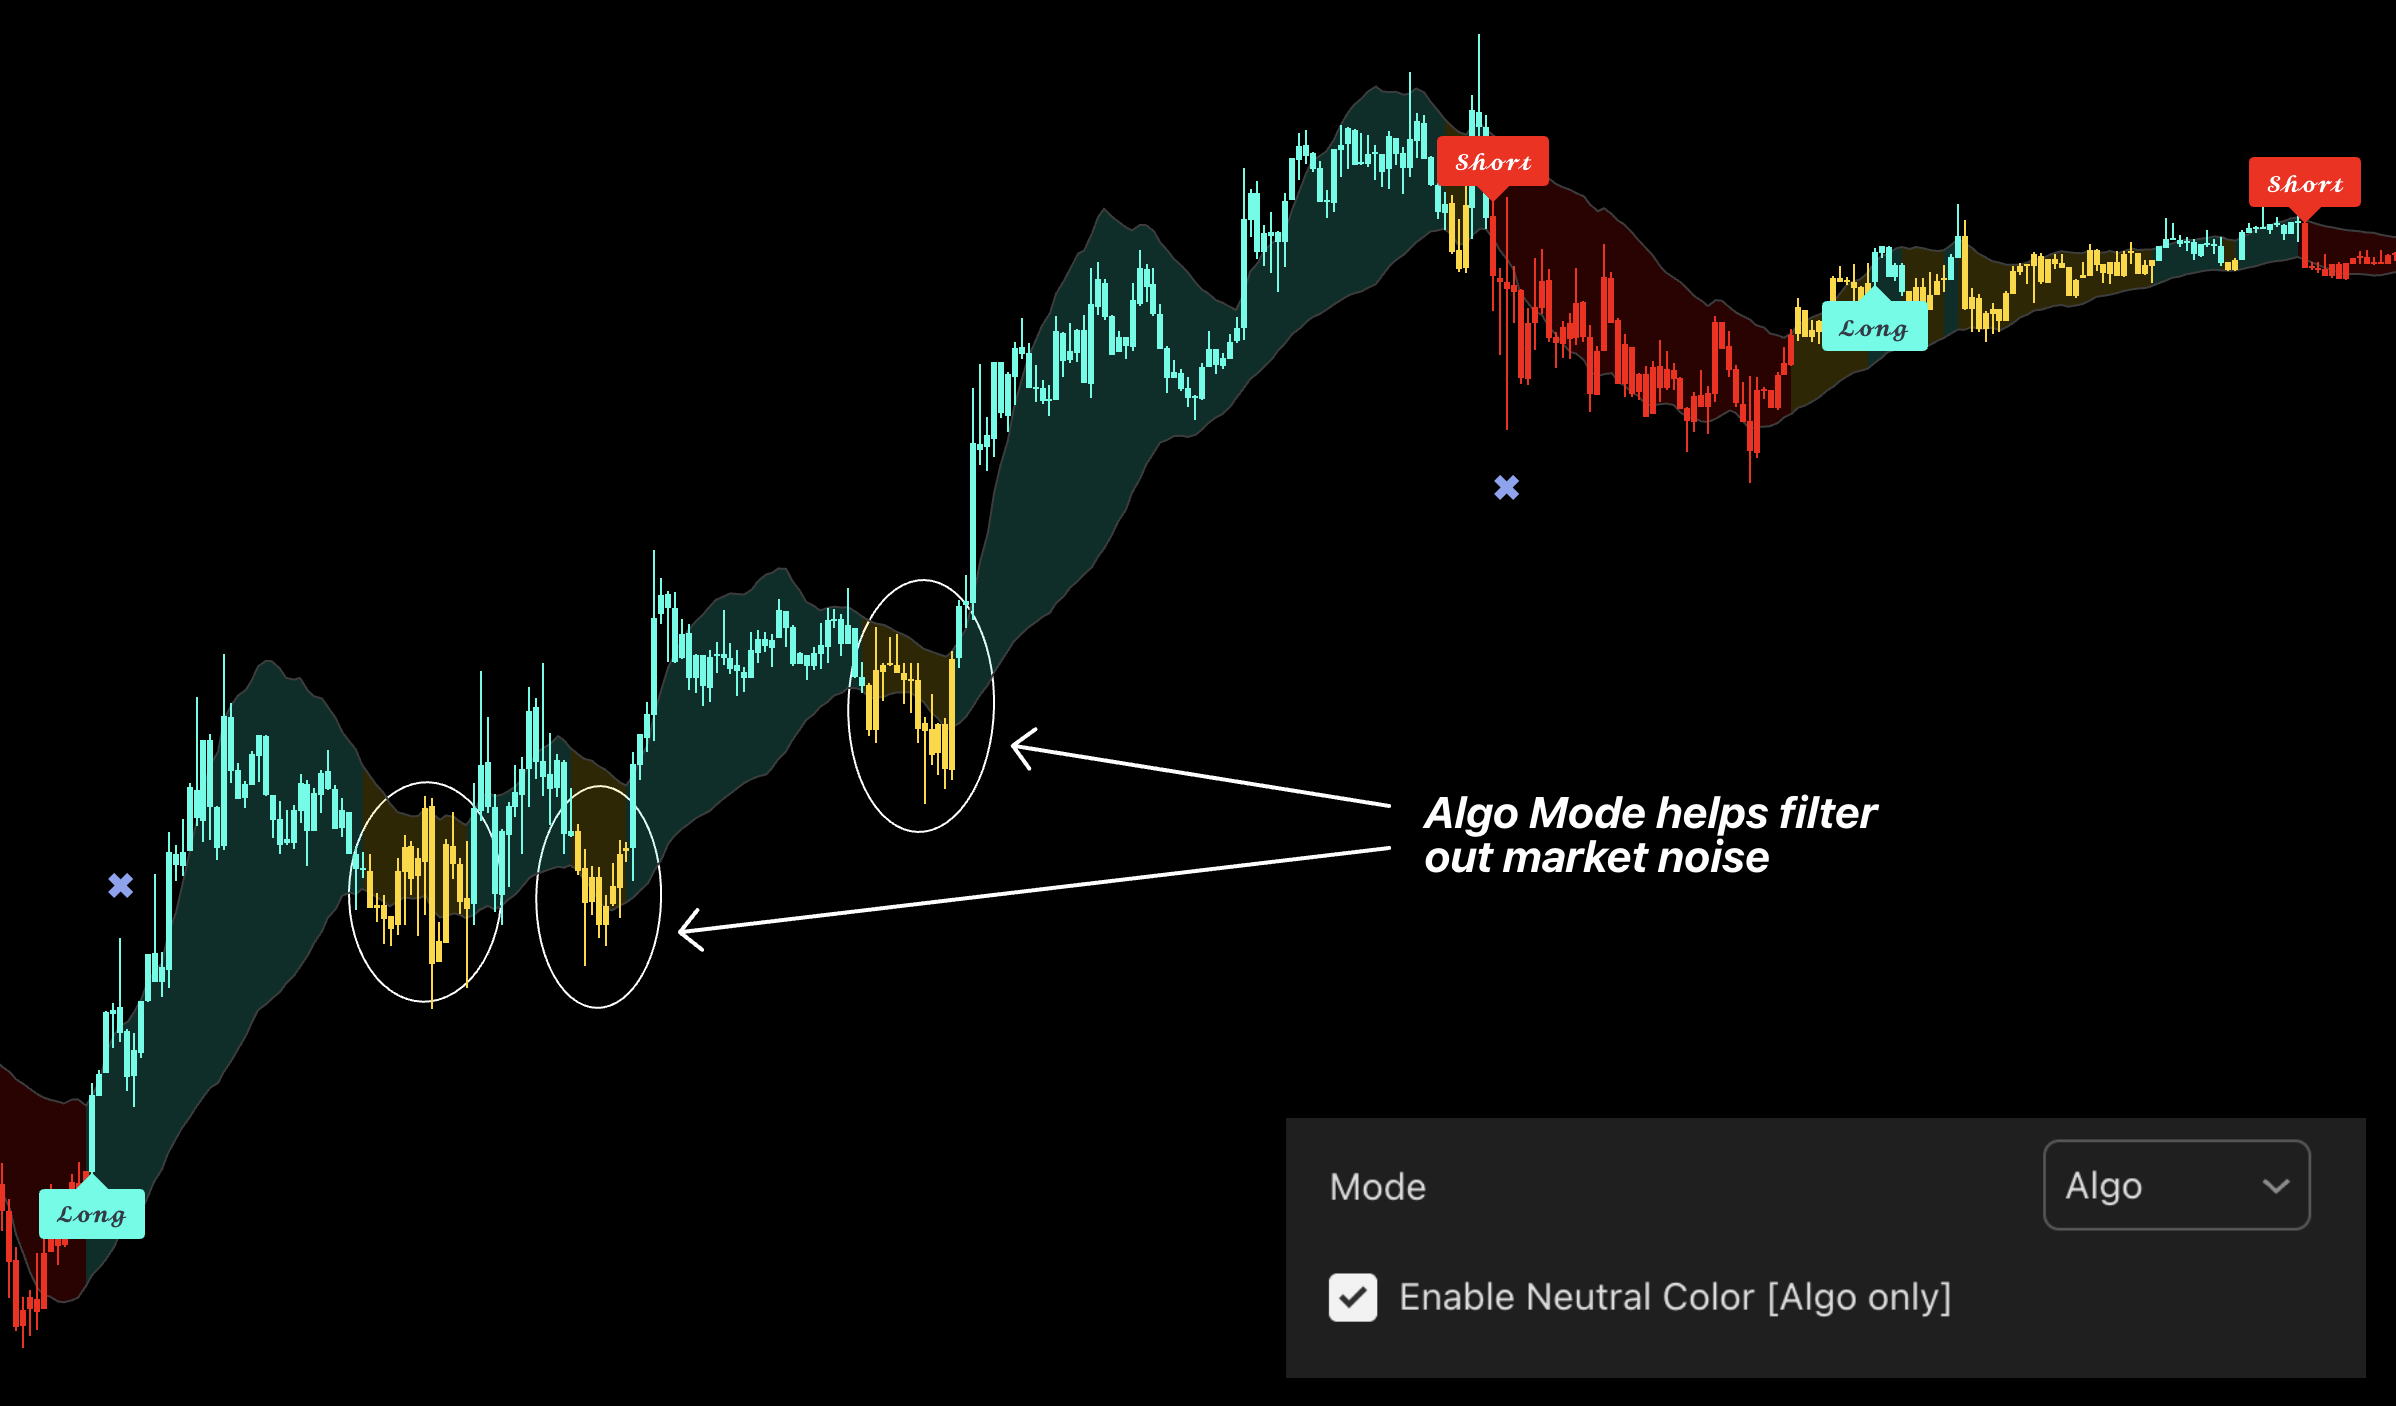
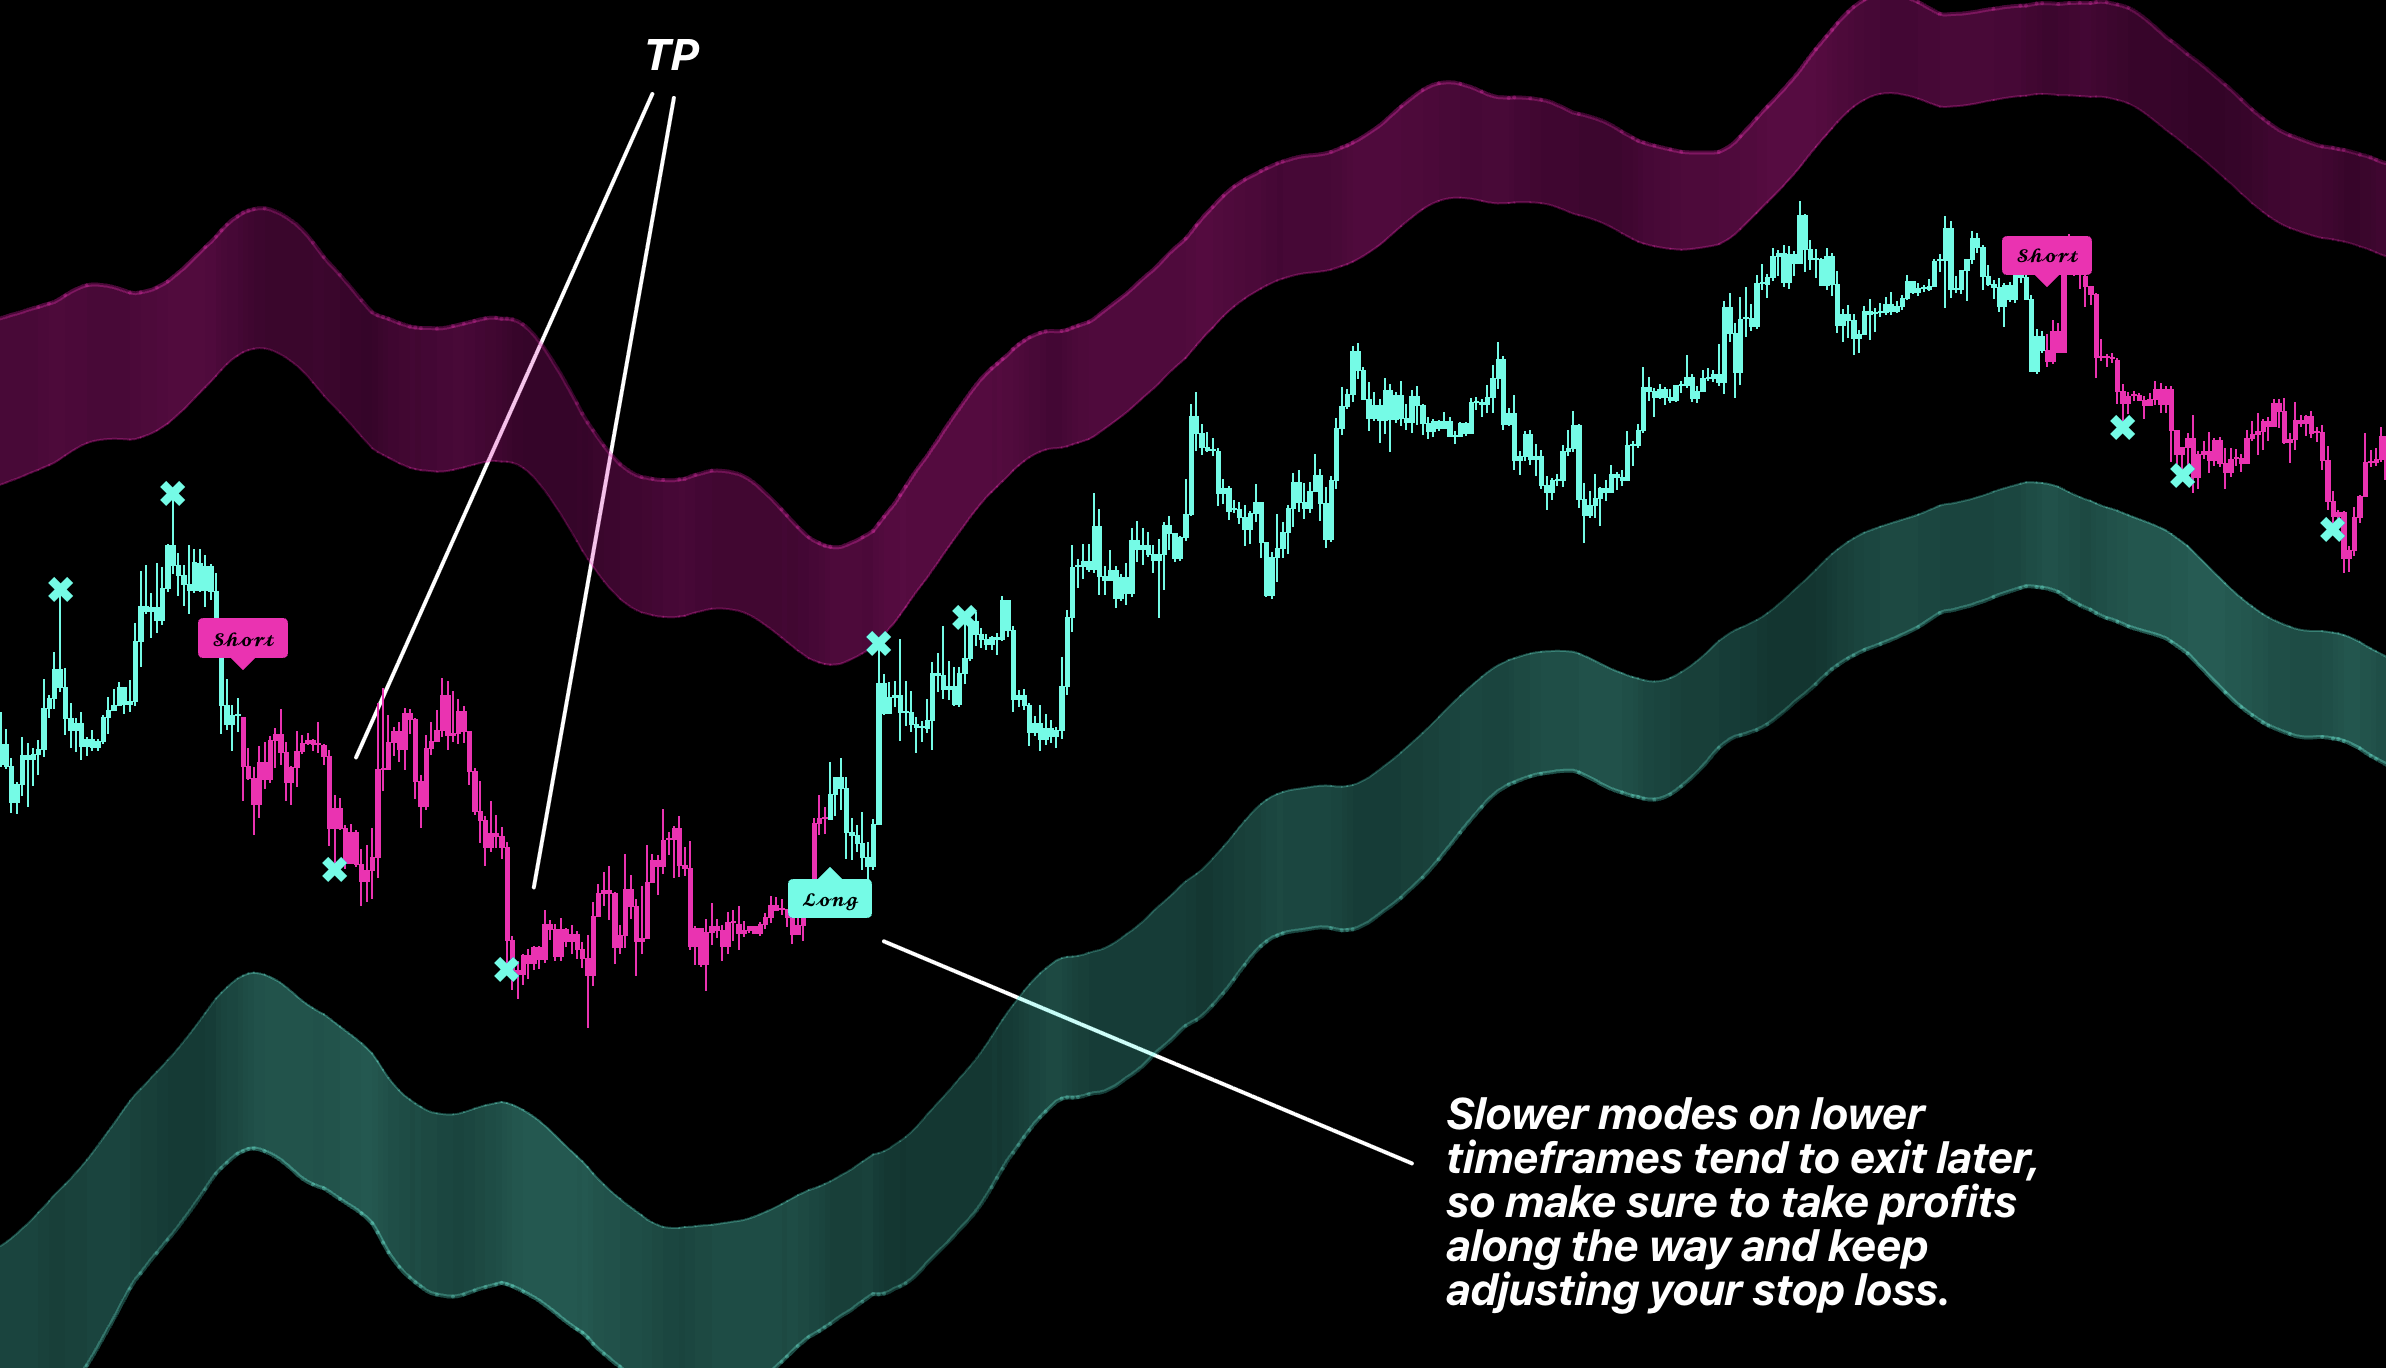
Algo Mode — 1h and Below
Use Algo mode. Its slower confirmation removes more intraday noise, so neutral or delayed transitions are intentional. The slightly later entry is normally a better trade-off here than on Daily and helps prevent reacting to every lower-timeframe move.
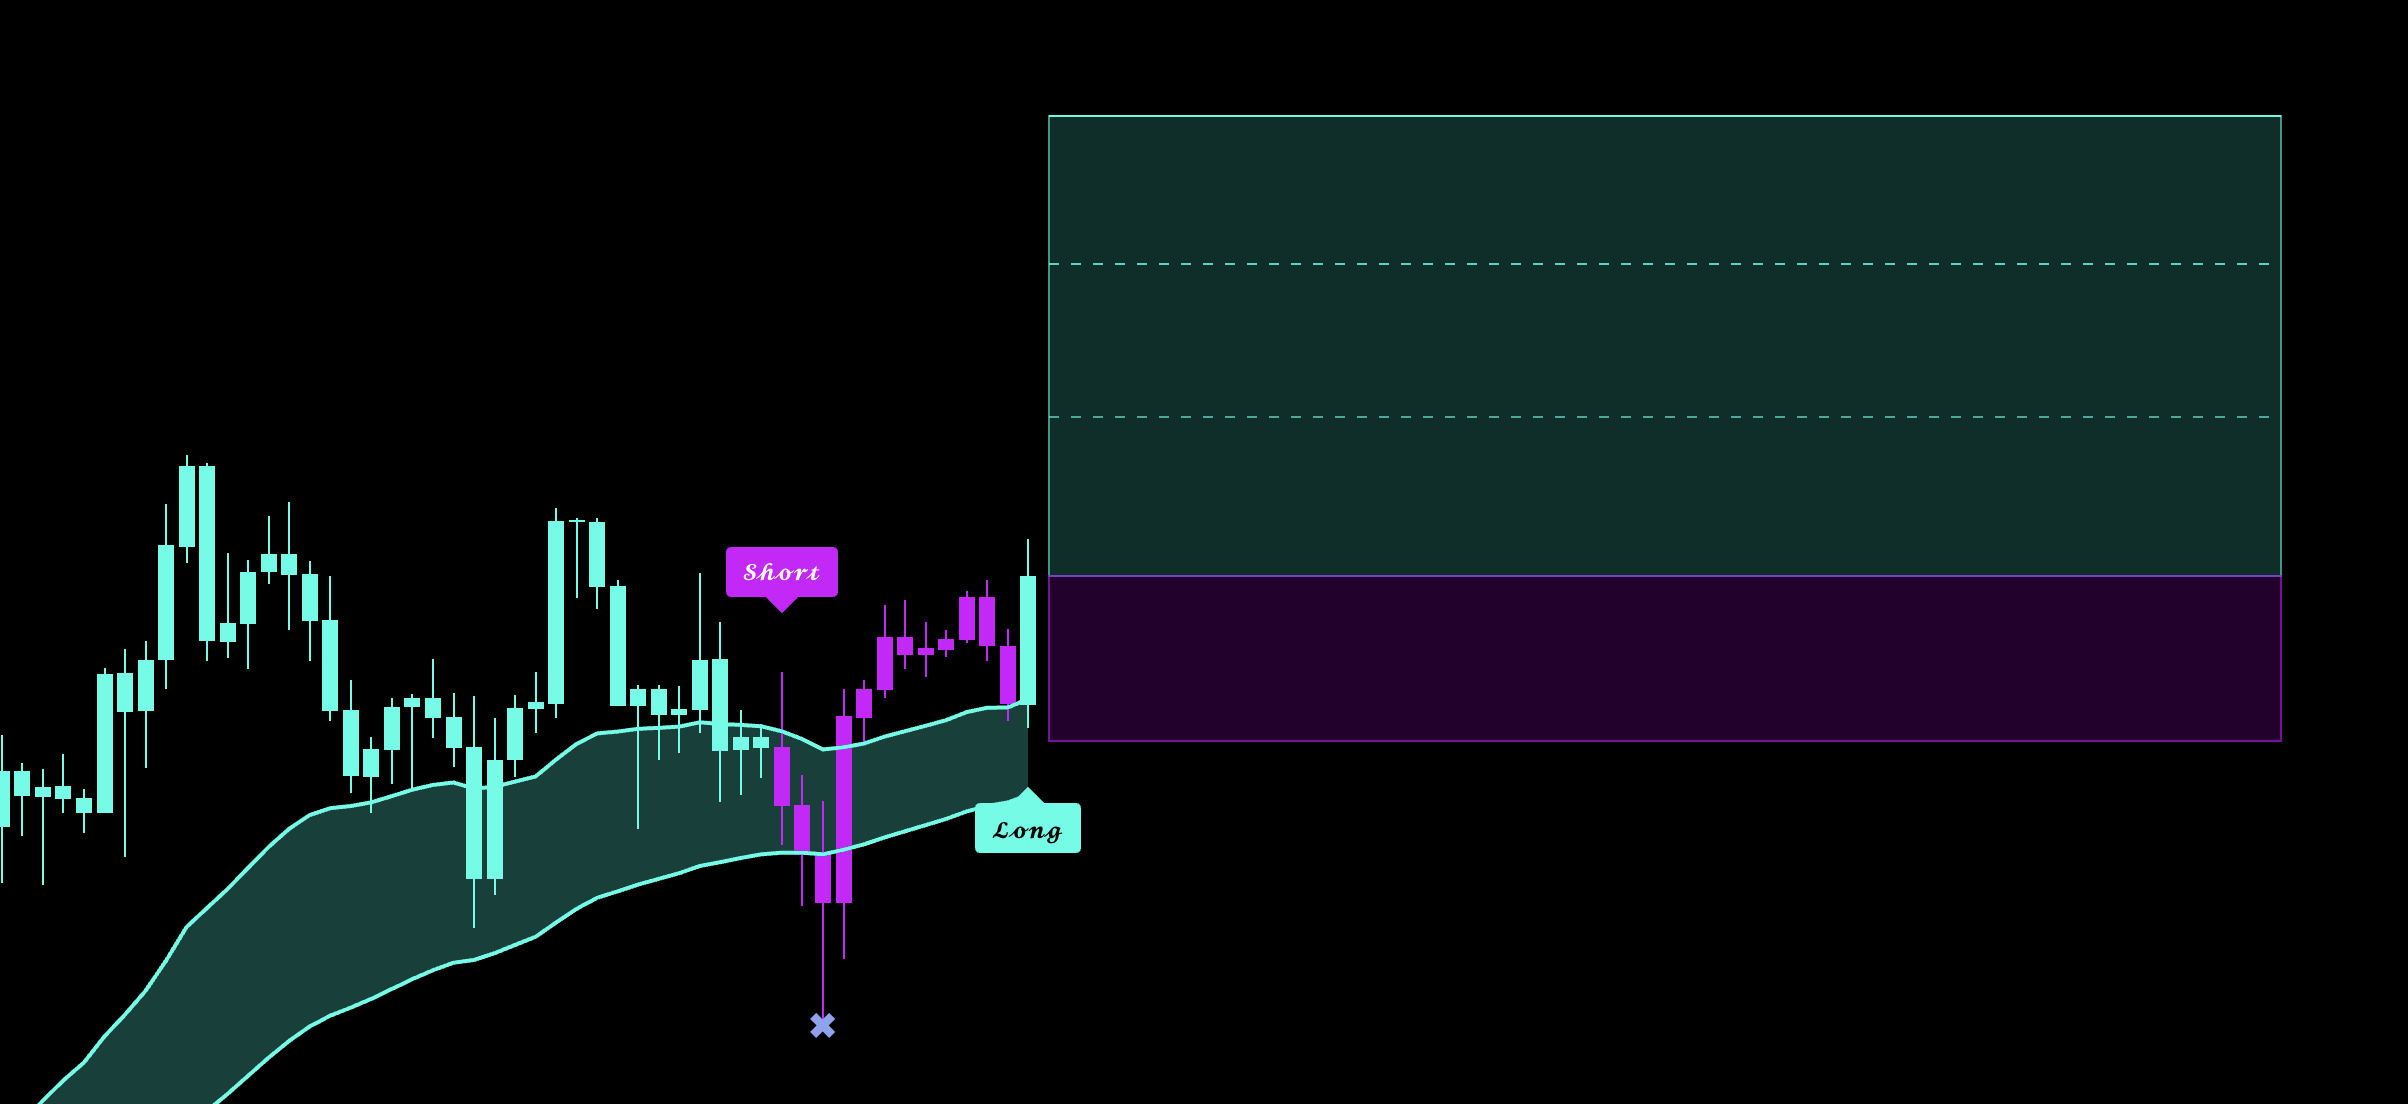
TP / SL System
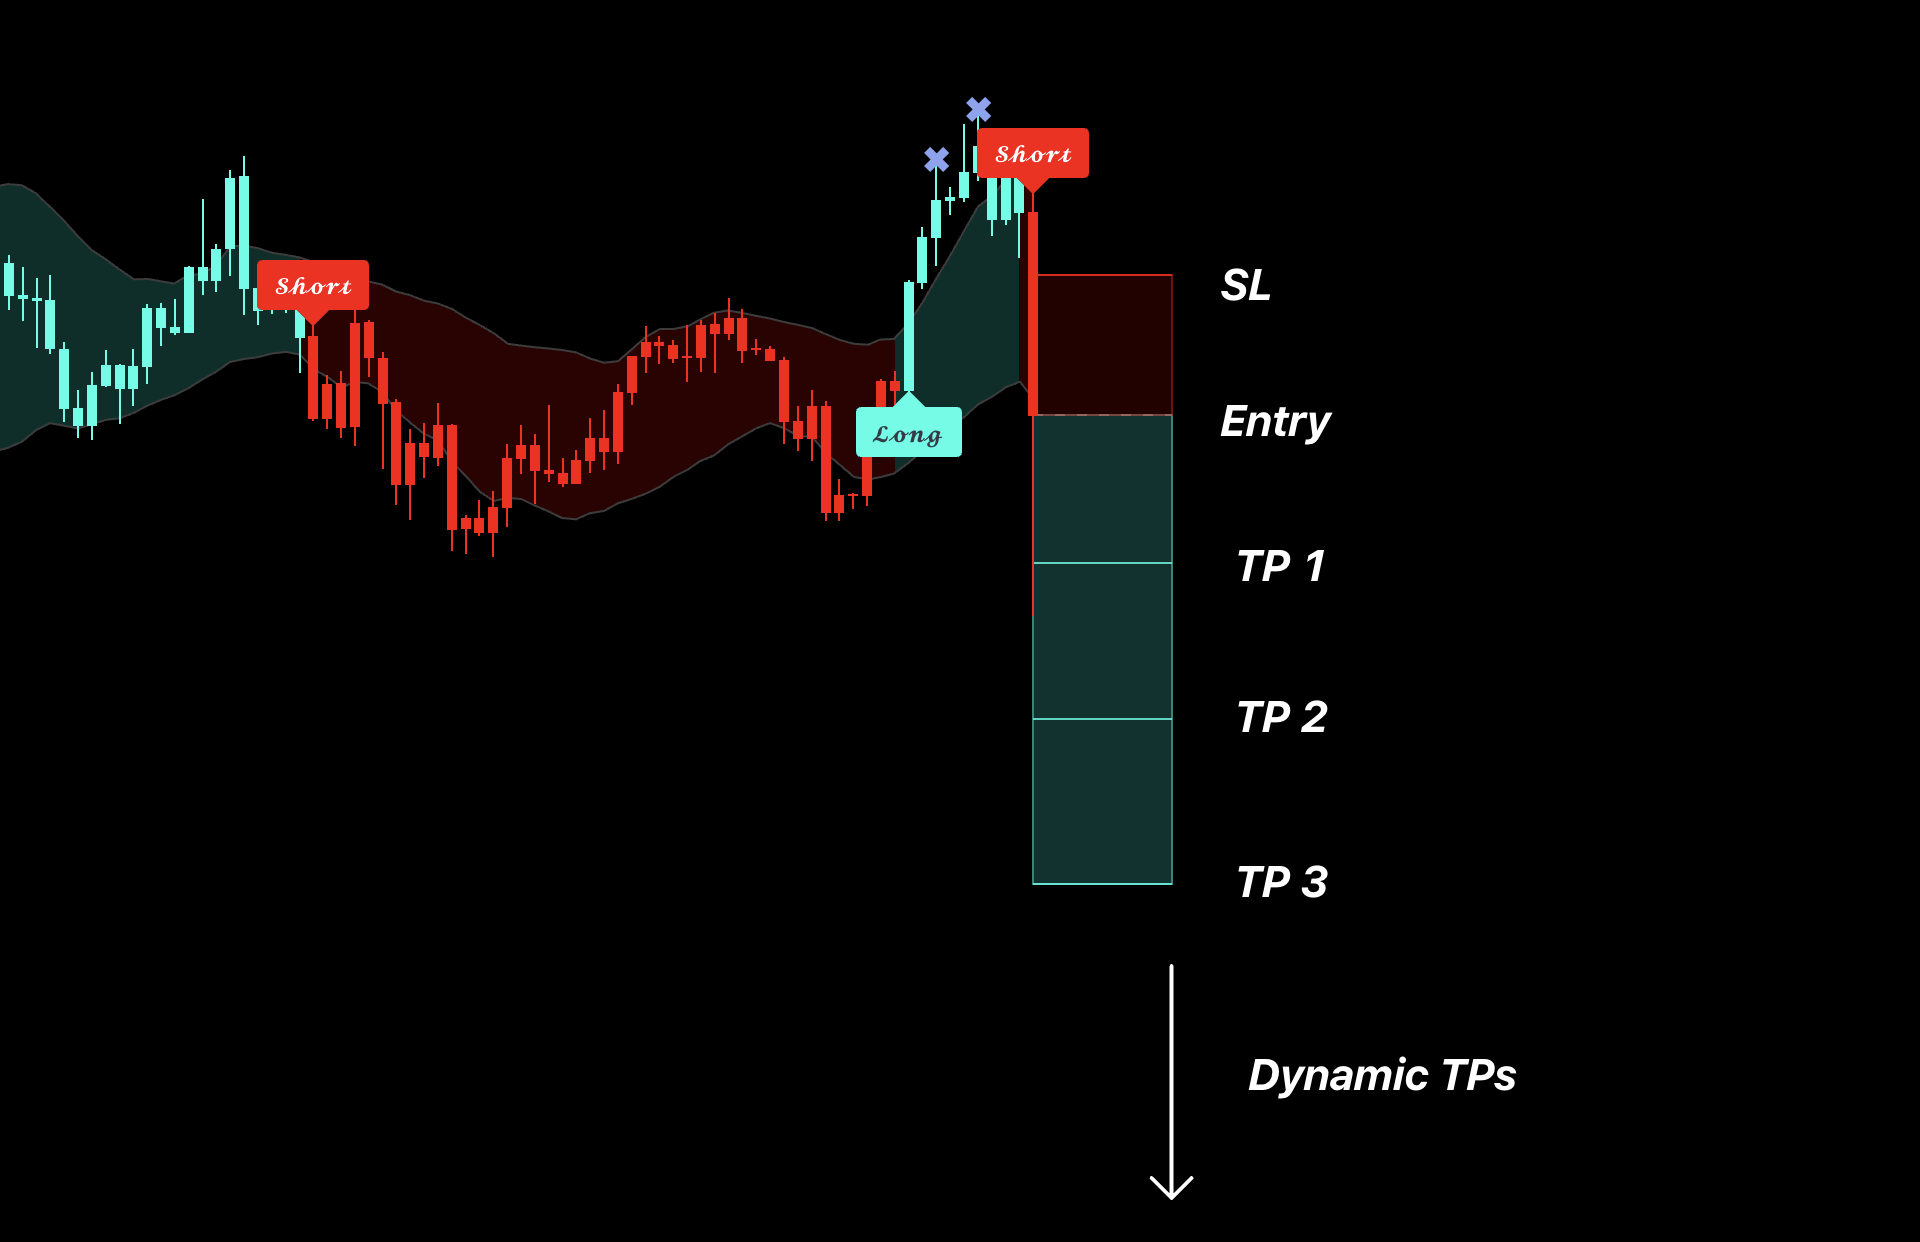
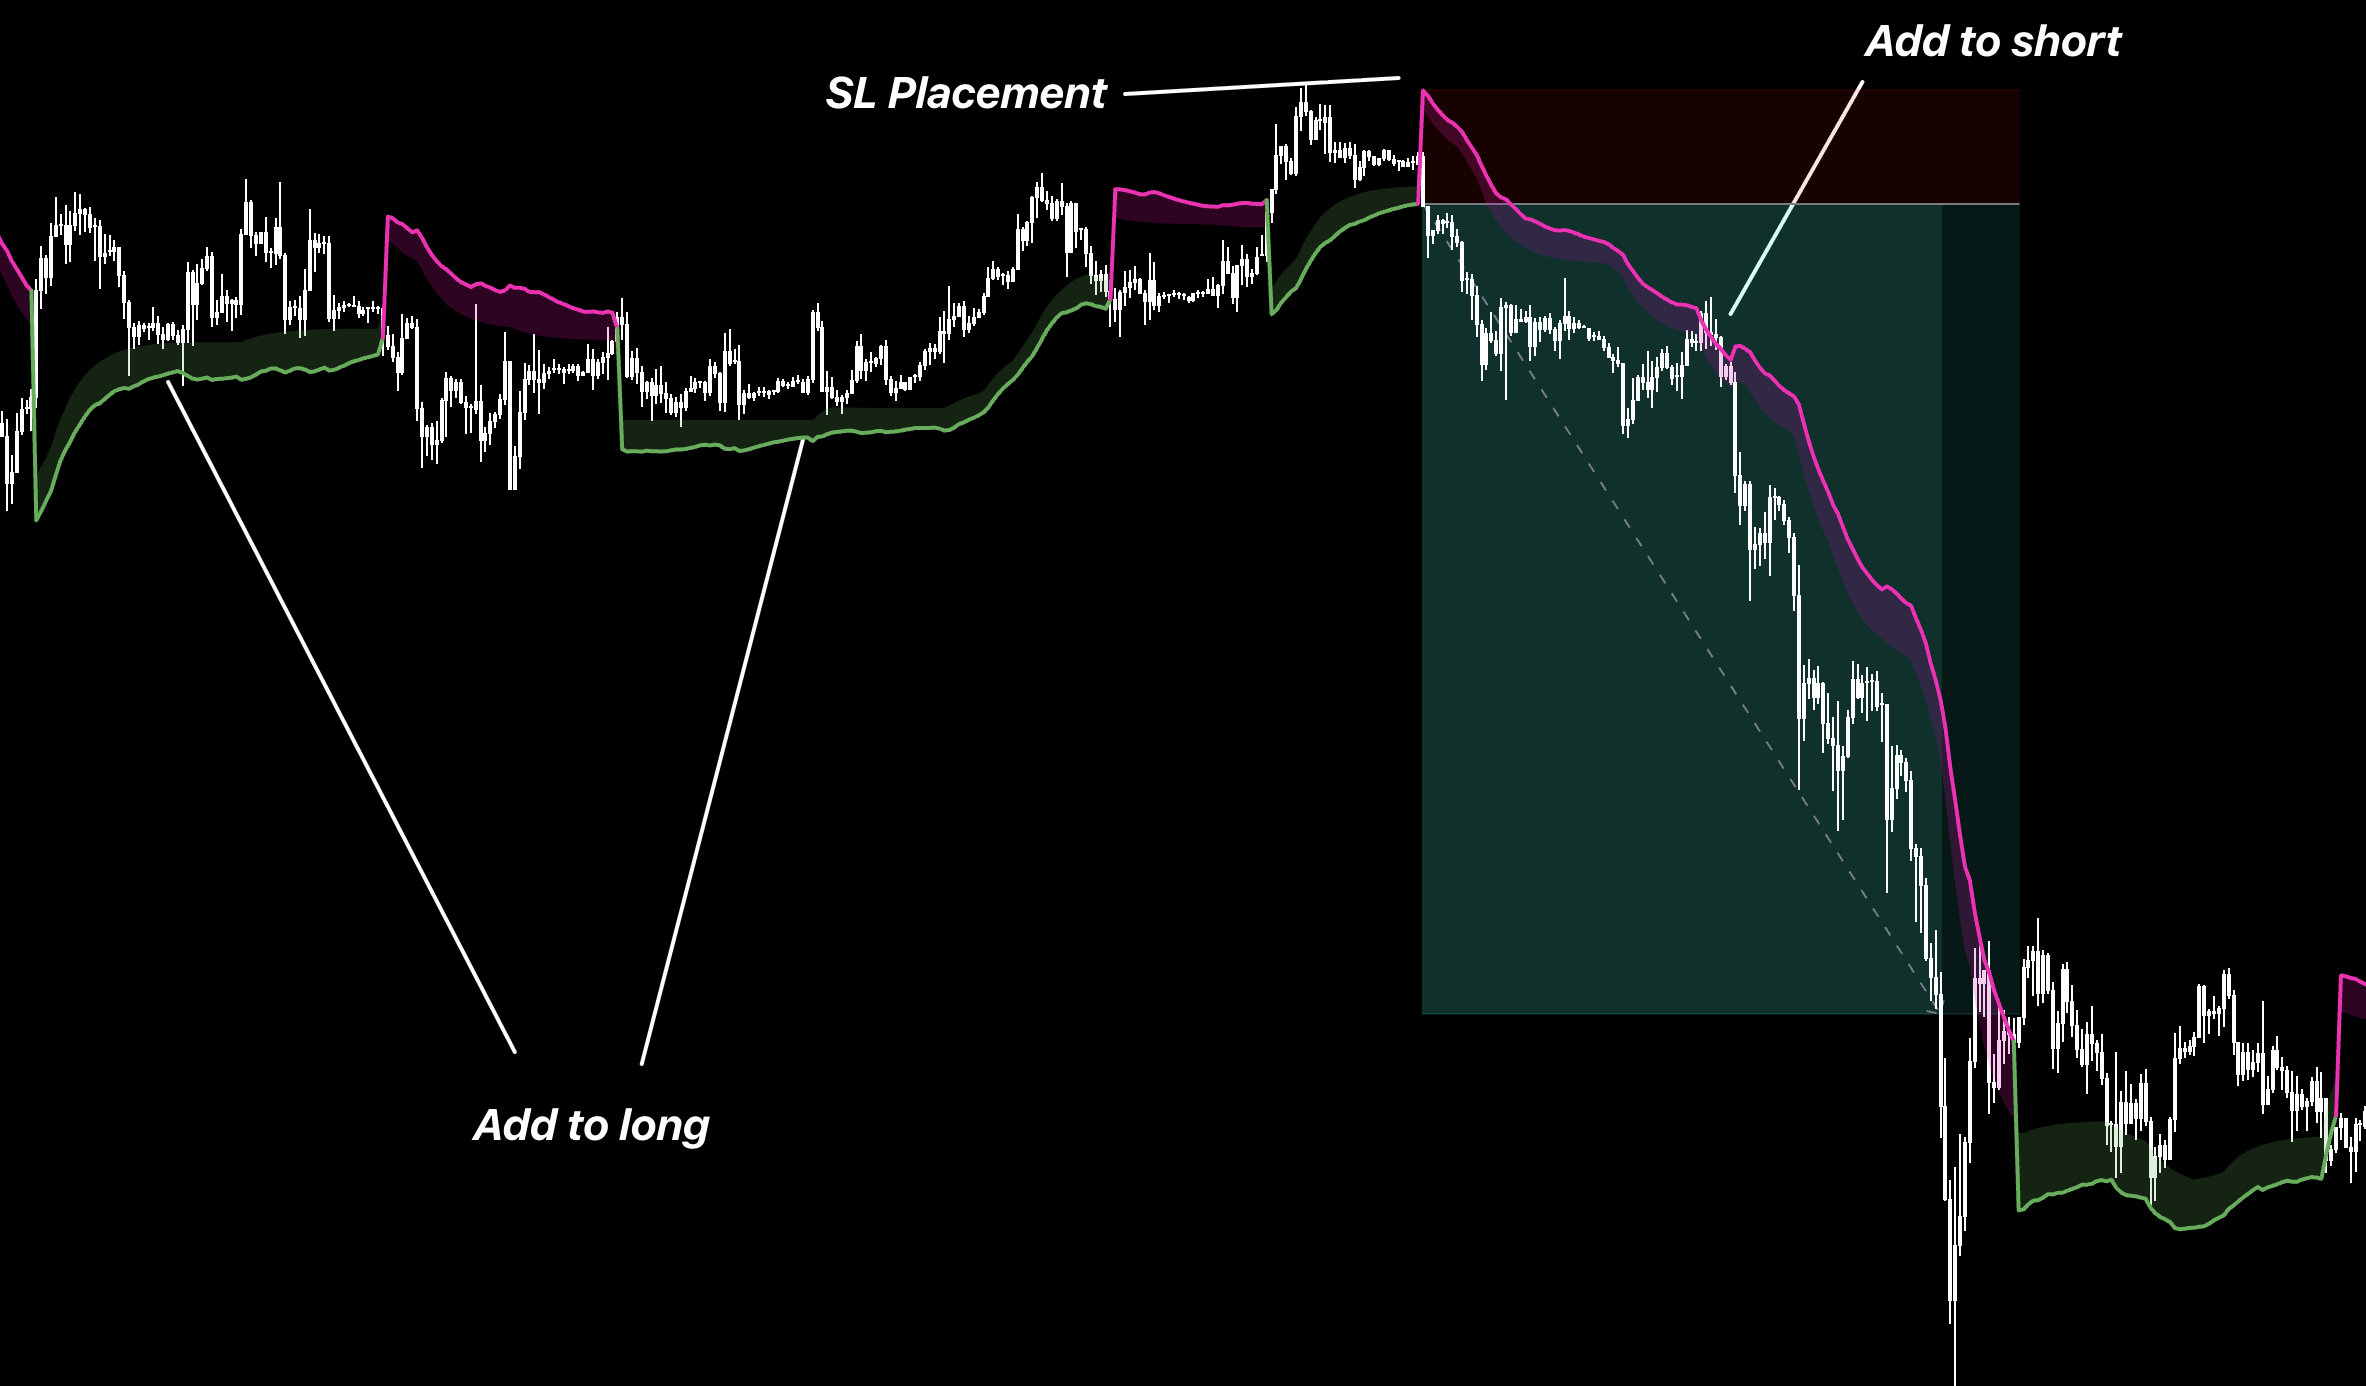
When TP/SL is enabled, use the displayed levels as a step-by-step trade-management plan.
Enter after the confirmed signal and place risk at the displayed SL.
Scale out at TP1, TP2, and TP3.
Move SL to break-even after TP1.
Respect a Dynamic TP if it closes the trade early.
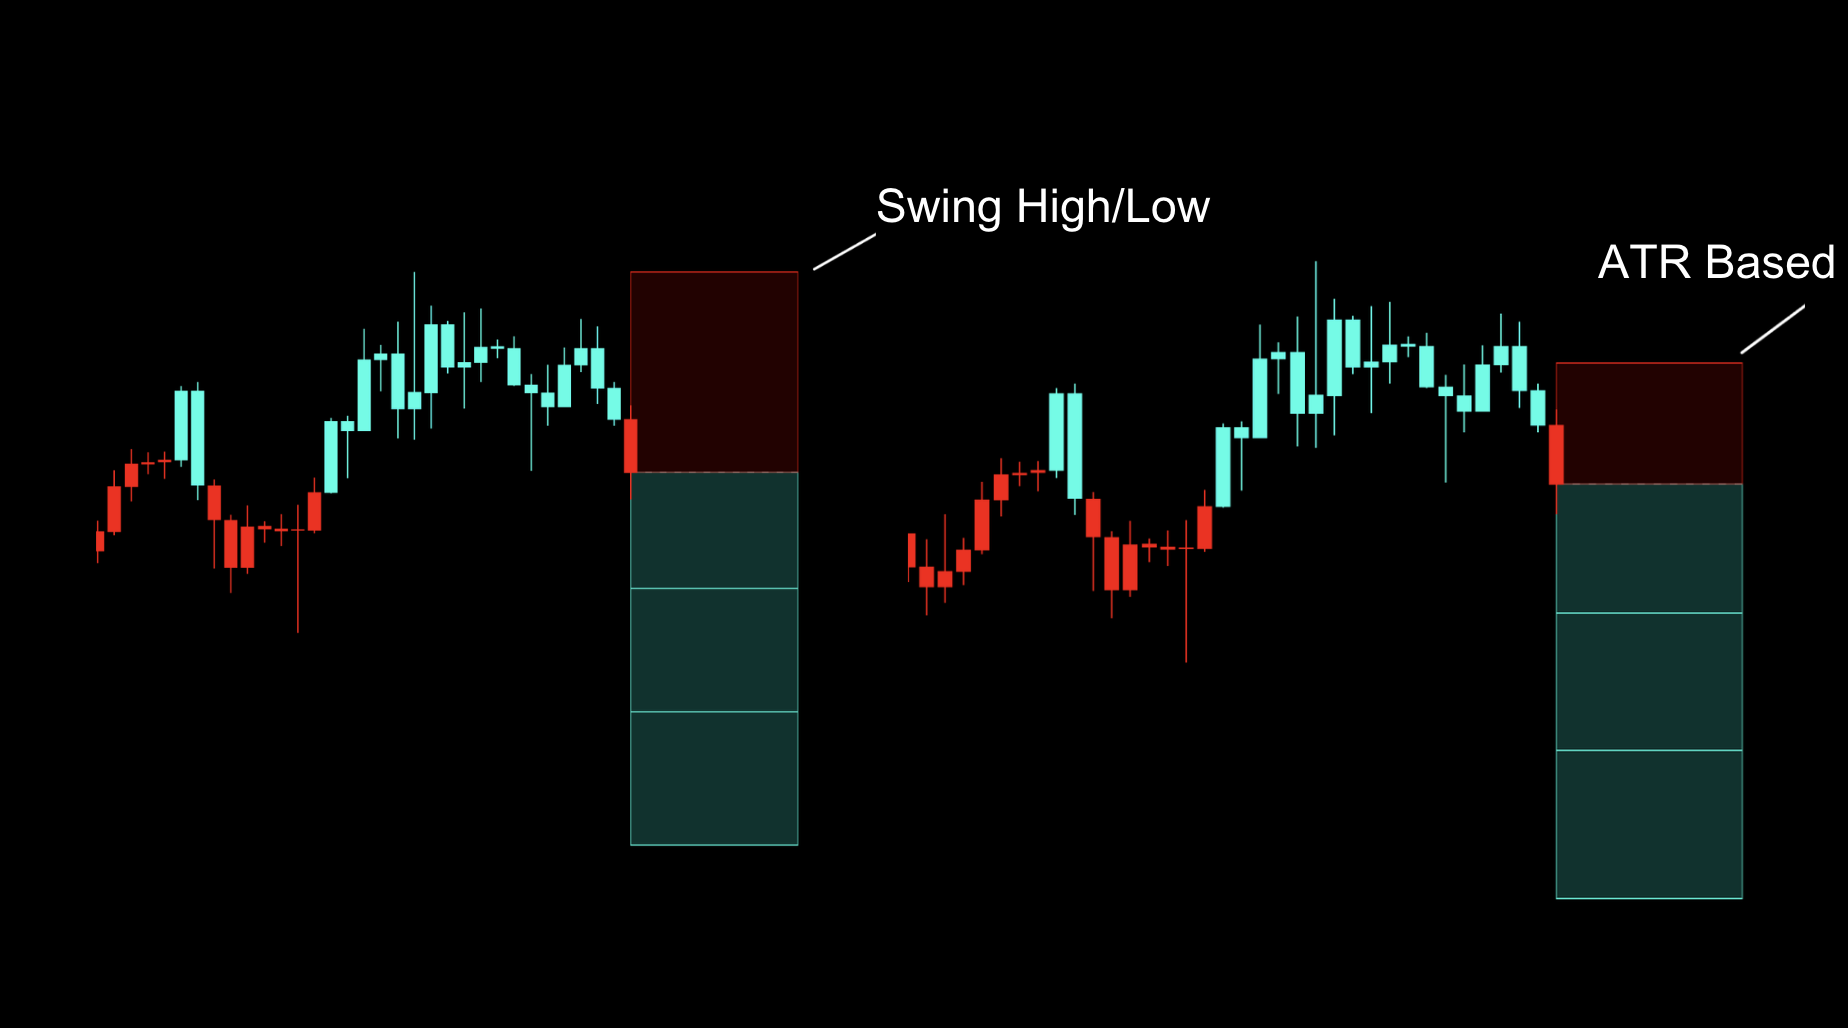
Stop Placement Options
Use Swing High / Low when the stop should follow recent structure. Use ATR Based when the stop should adapt to volatility.
Dynamic TP
Dynamic TP can close the trade before every fixed target is reached when the active move weakens. Treat the marker as an exit instruction, not another entry.
How to Adjust the Inputs
Choose the workflow first, then change only the inputs needed for that workflow. Adjust one setting at a time so you can see what changed on the chart.
Daily Setup
Use Bands Mode. In Style, turn off every optional display except Bar Coloring.
Lower Timeframes
Switch to Algo Mode before changing fine-tuning values. Keep the defaults until you have tested the normal filtered behavior.
Managed Trades
Enable TP/SL and Setup Boxes when you want the script to display the complete entry, stop, and target plan.
Input
How to use it
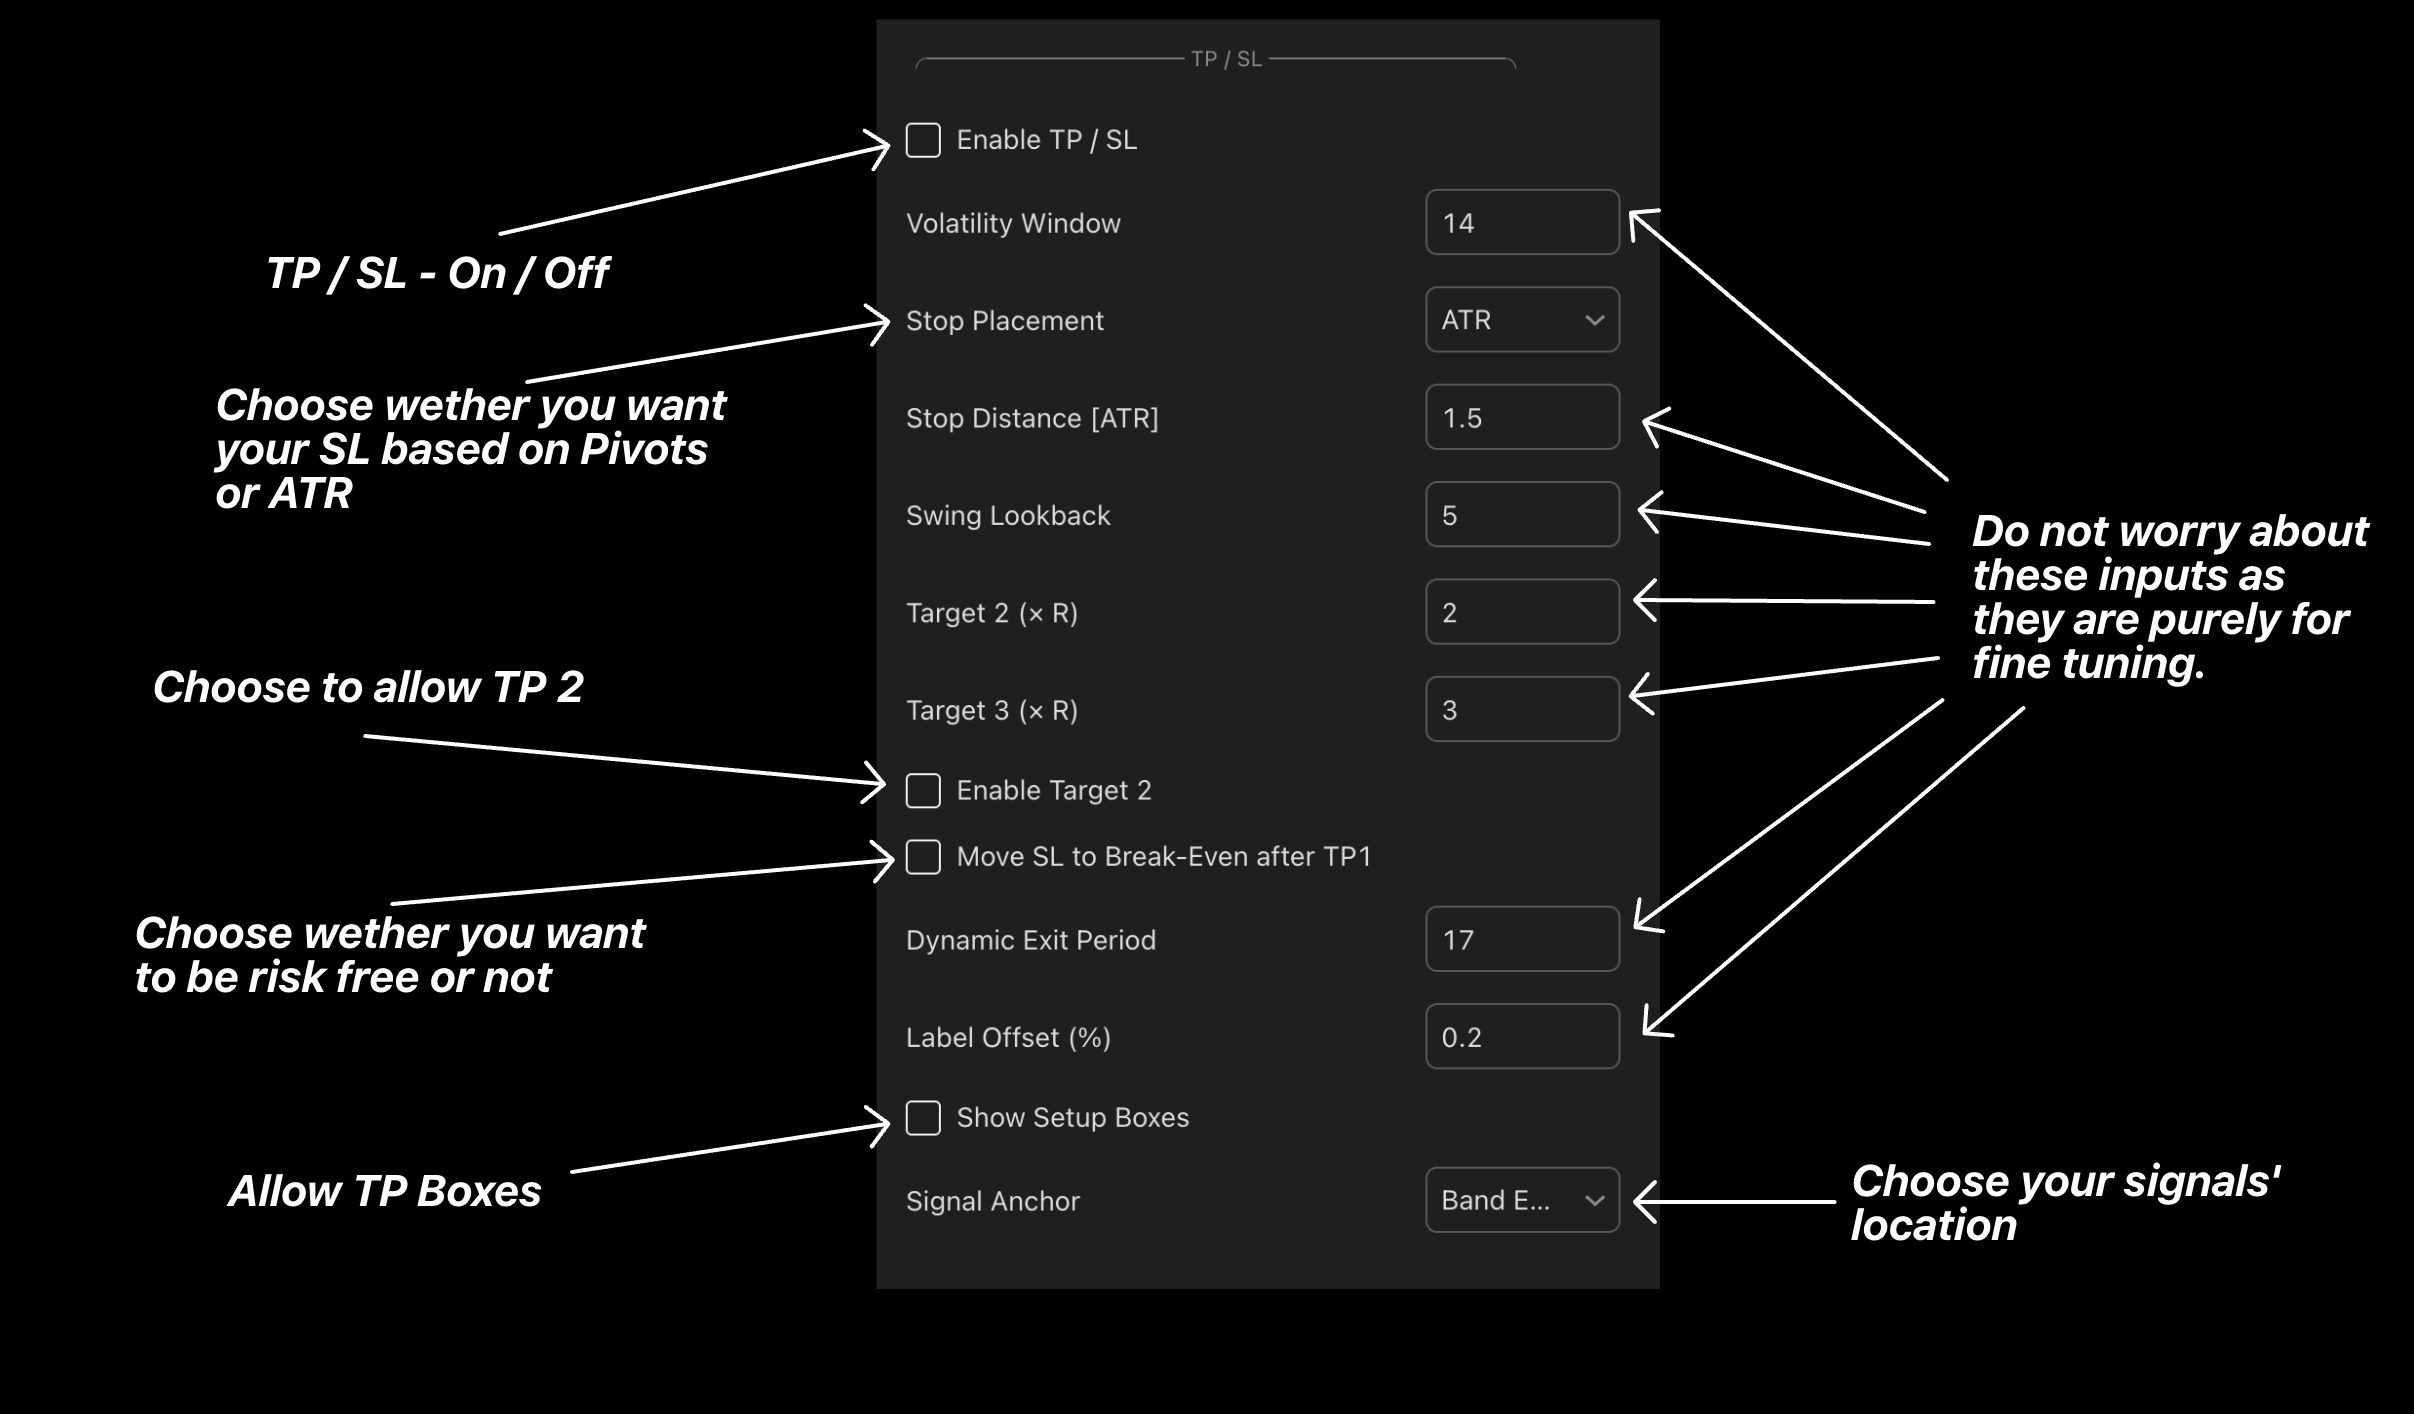
Enable TP / SL
Turn on the complete trade-management display. Leave it off for the recommended signal-to-signal Daily workflow.
Stop Placement
Choose Swing High / Low for a structure-based stop or ATR for a volatility-based stop.
Stop Fine-Tuning
Use Swing Lookback for structure stops. For ATR stops, adjust Volatility Window and Stop Distance gradually while keeping account risk fixed.
Target 2 / 3
Enable additional targets when scaling out. Keep TP1 nearest, followed by TP2 and TP3; use the target multiples only to change their distance.
Break-Even
Enable Move SL to Break-Even after TP1 when you want the remaining position protected after the first target.
Dynamic Exit Period
Adjust gradually only if Dynamic TP reacts too quickly or too slowly for the chosen timeframe.
Boxes and Labels
Show Setup Boxes controls the trade boxes. Signal Anchor and Label Offset change visual placement only.
◆Do not retune several values after one losing trade. Test one adjustment across enough historical examples before keeping it.
Feature and Overlay Guide
Oscillator Channel
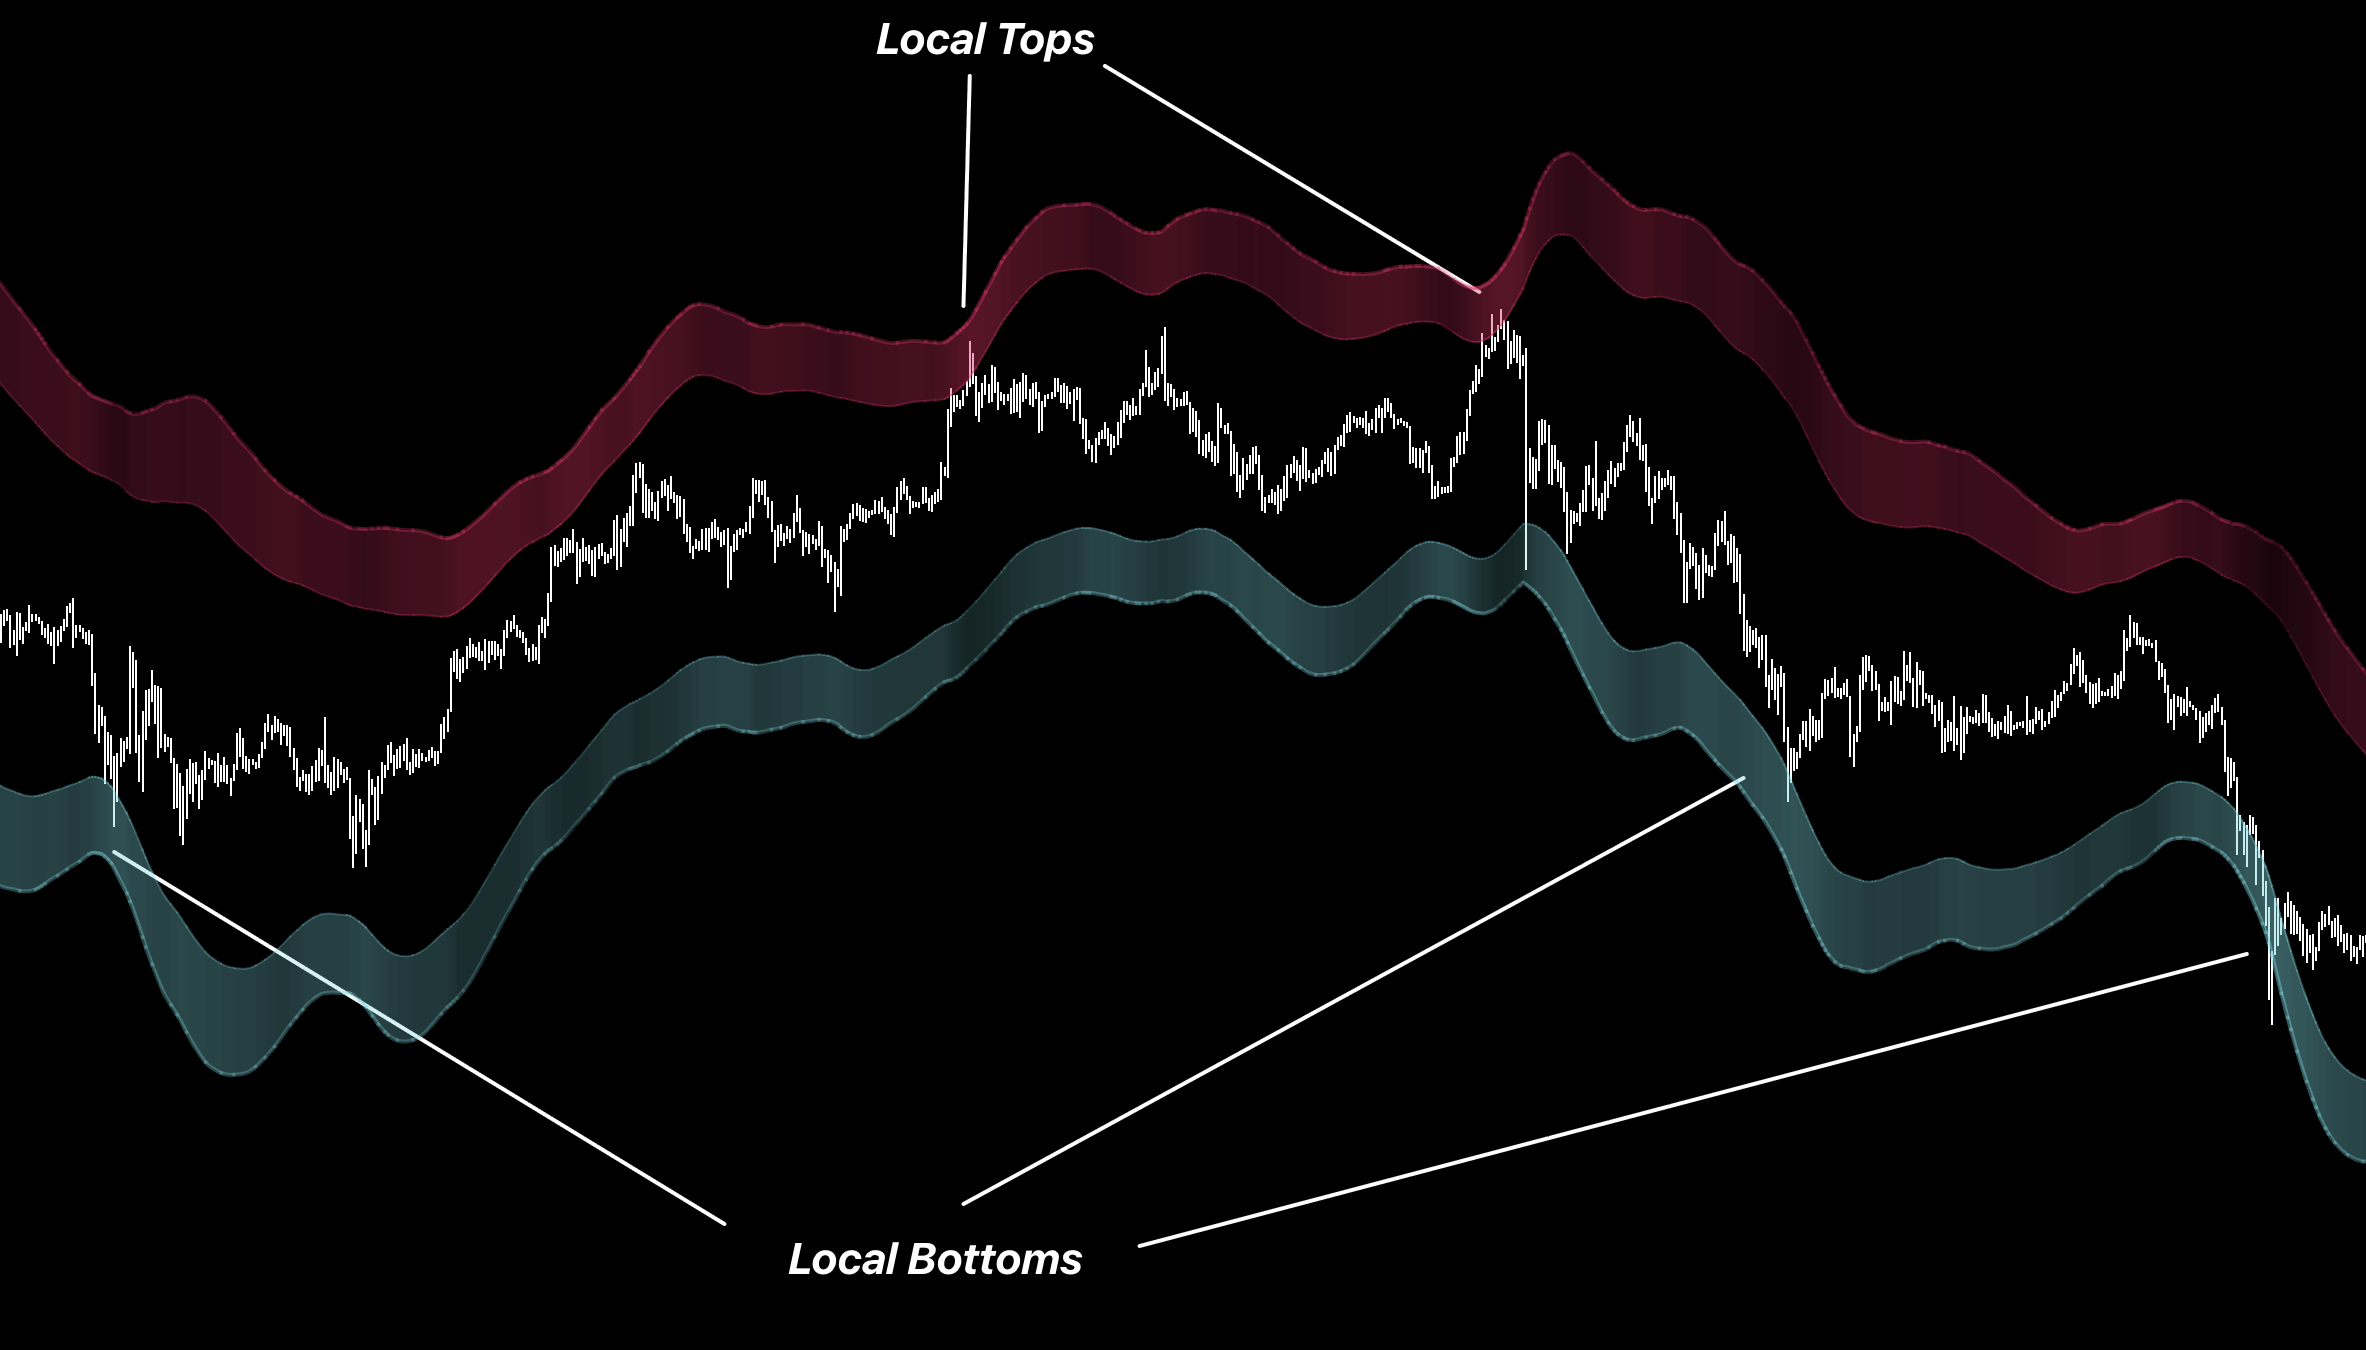
Take Long profits at the upper extreme and Short profits at the lower extreme. Pair reversal attempts with Reversal Matrix +.
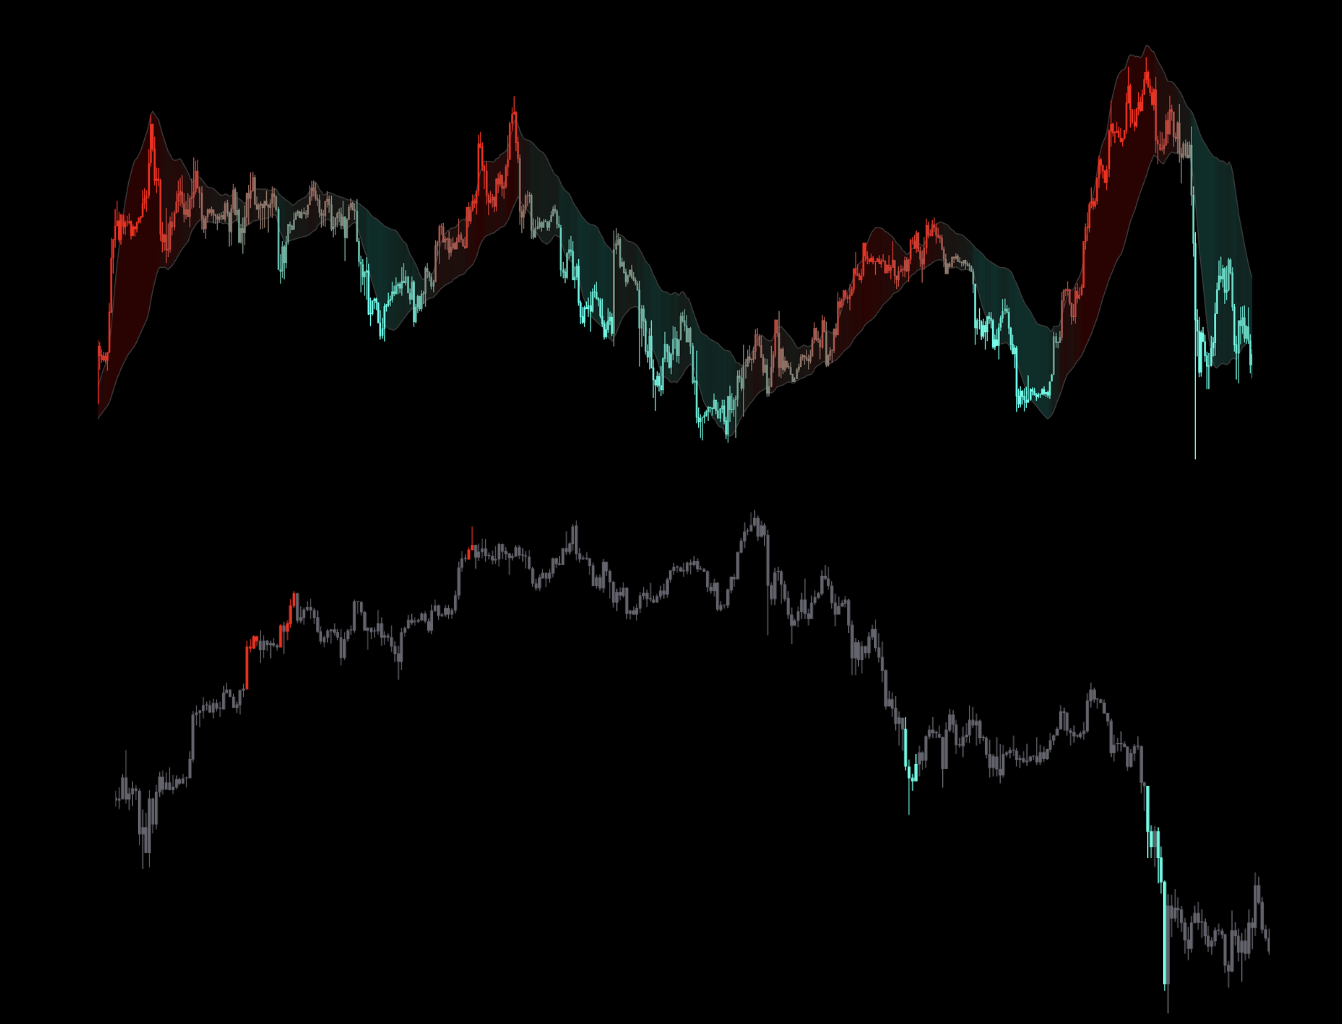
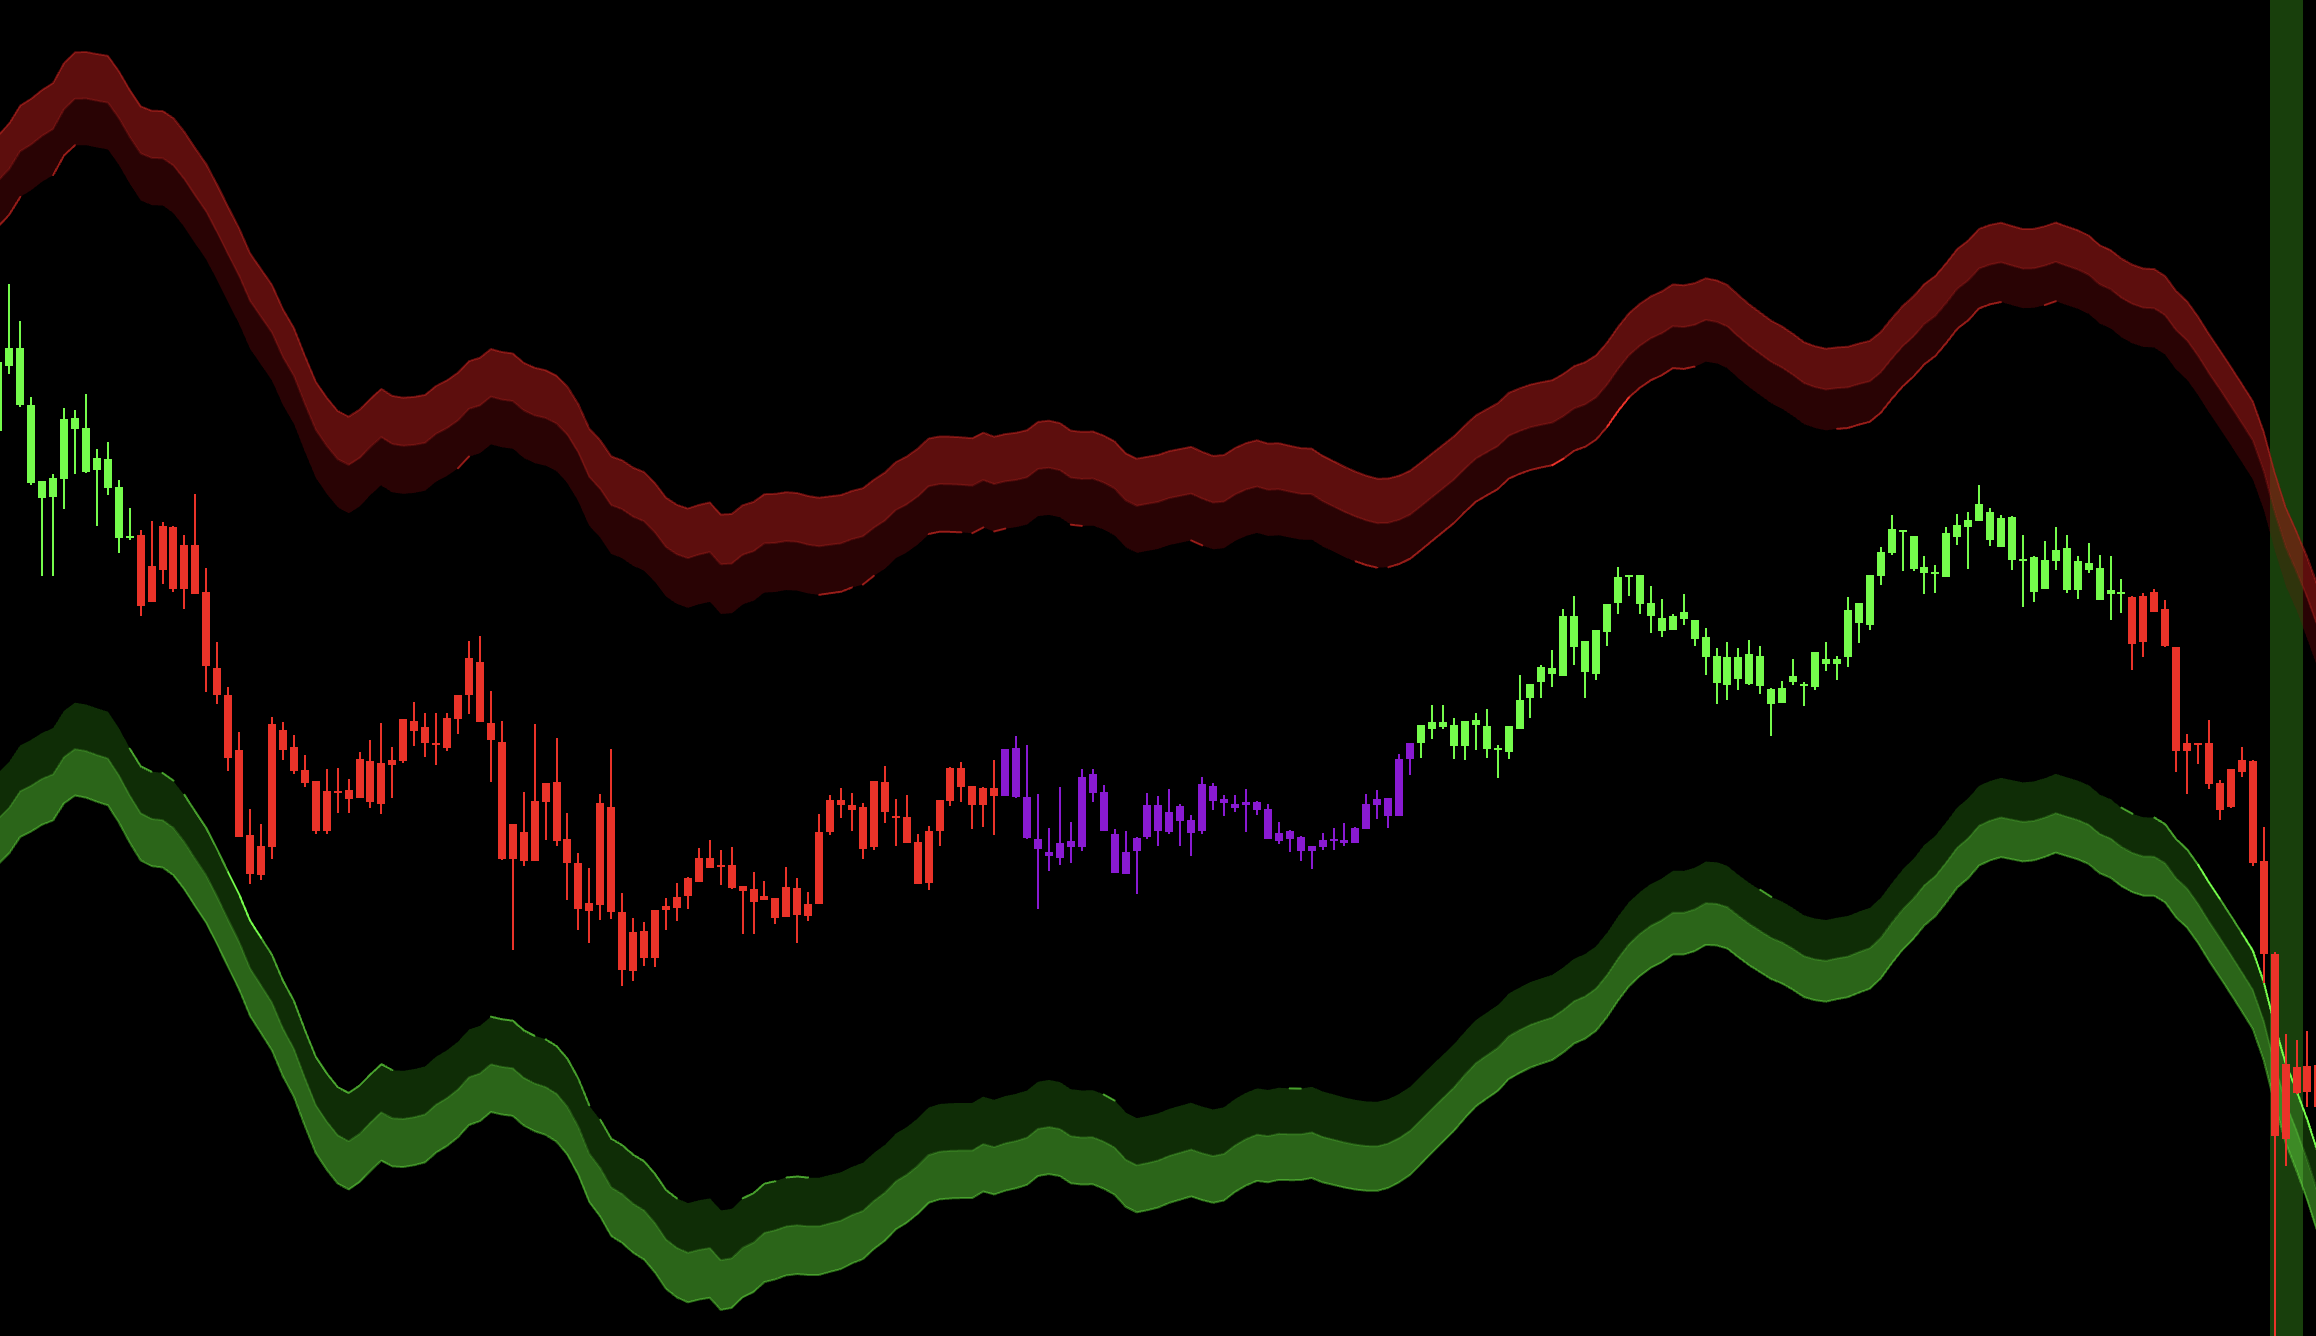
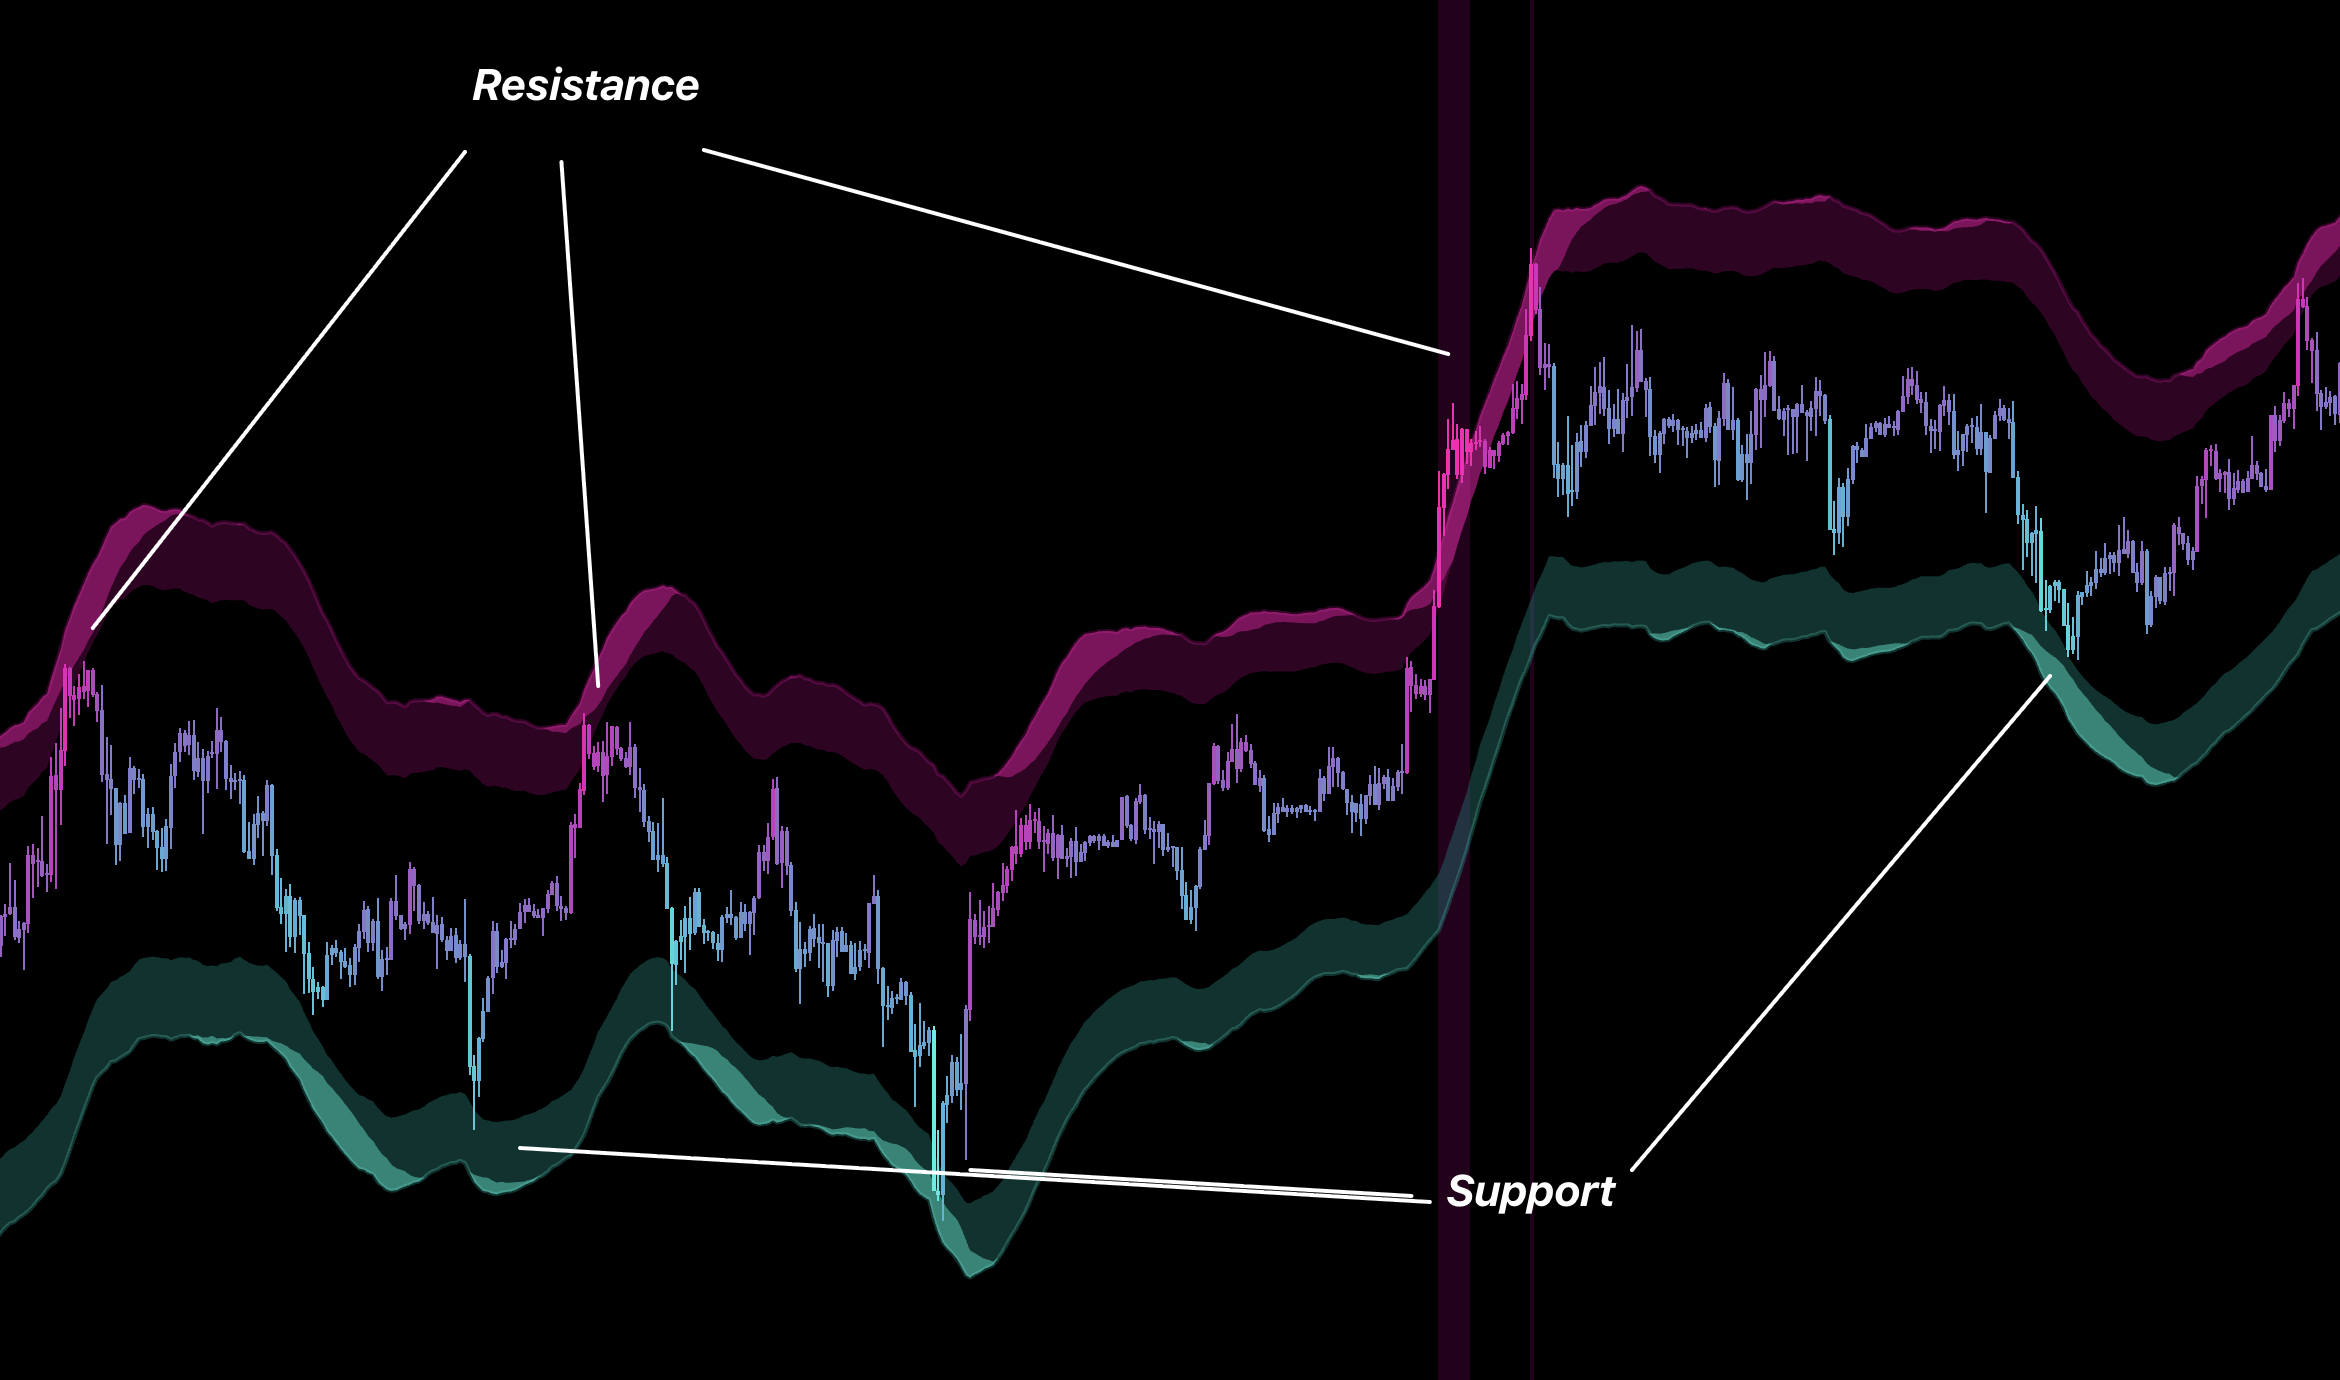
Volatility Channel
Use it as moving structure: Long stops below support, Short stops above resistance, and opposing sides as targets.
Momentum Pulse
Use as advanced confirmation. Agreement supports the trade; disagreement means reduce conviction rather than reverse automatically.
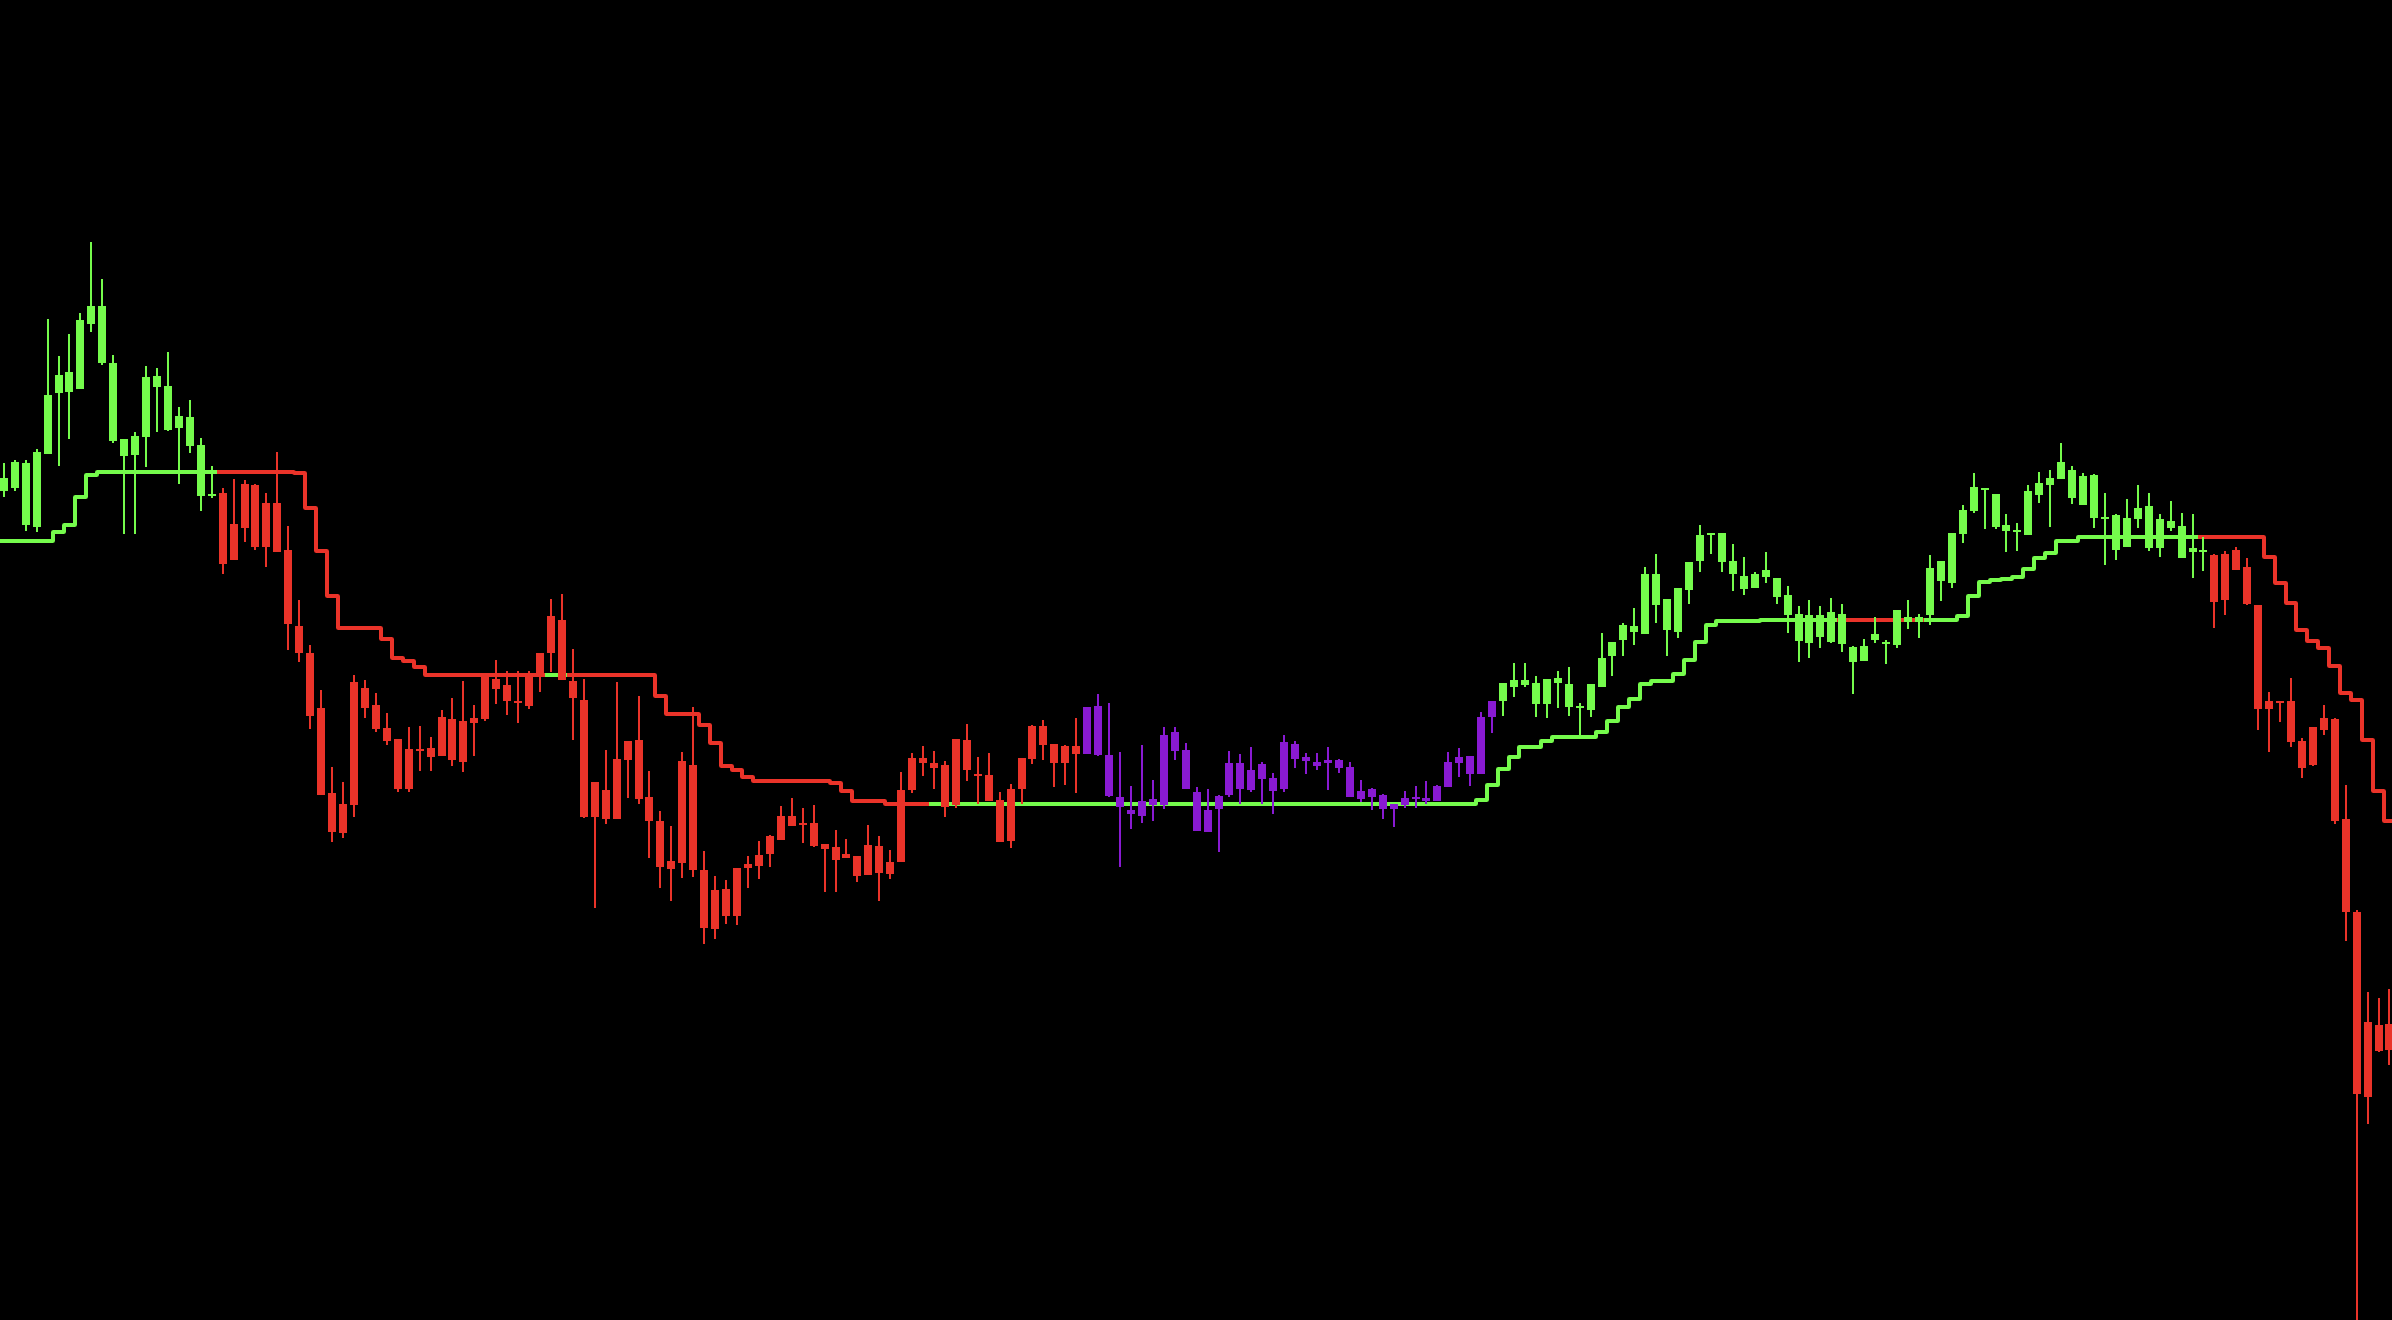
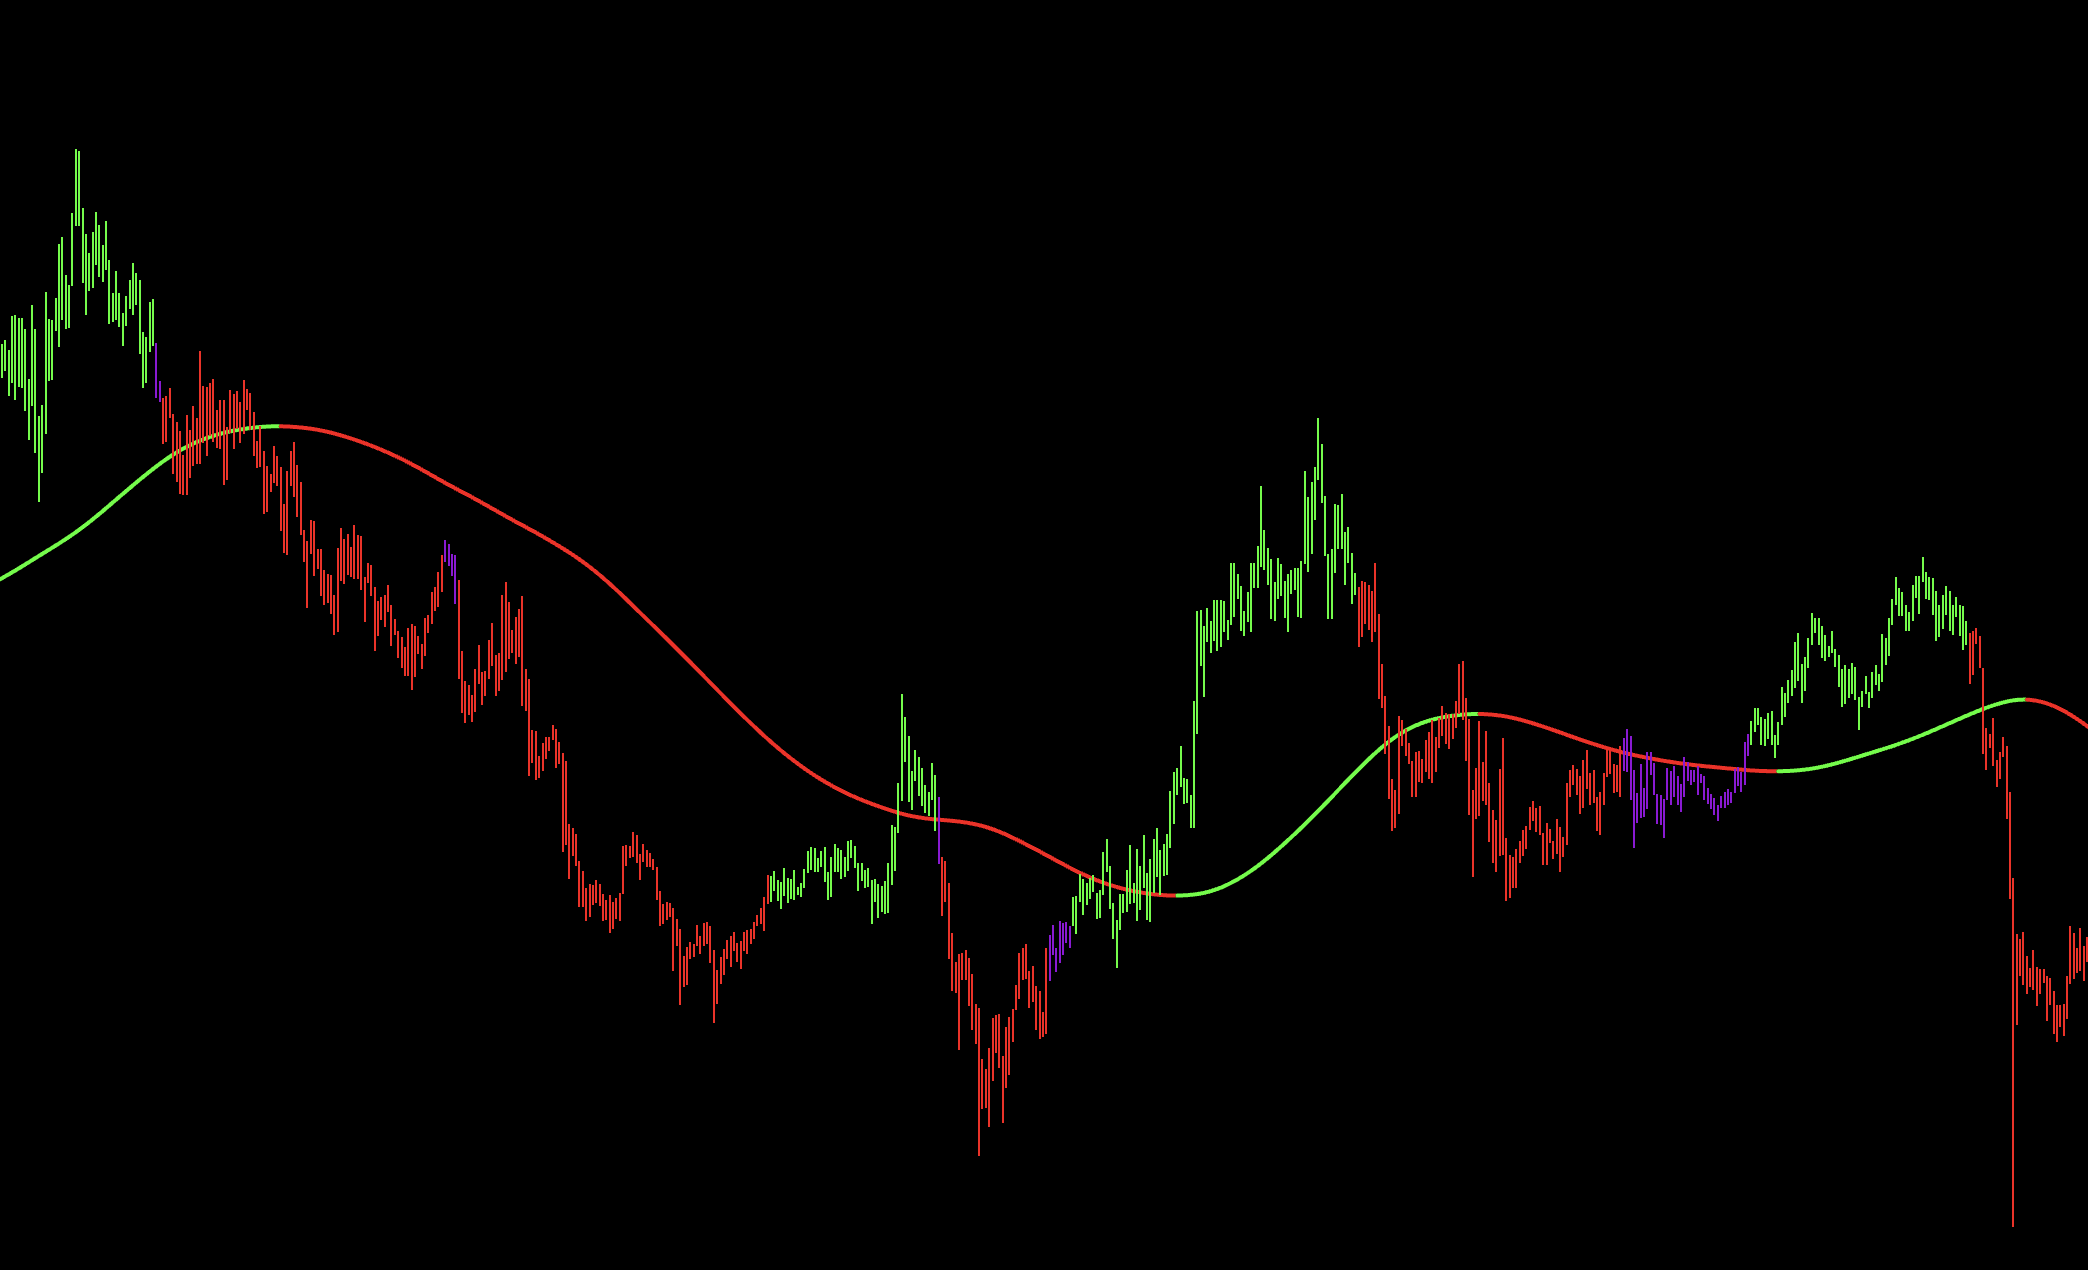
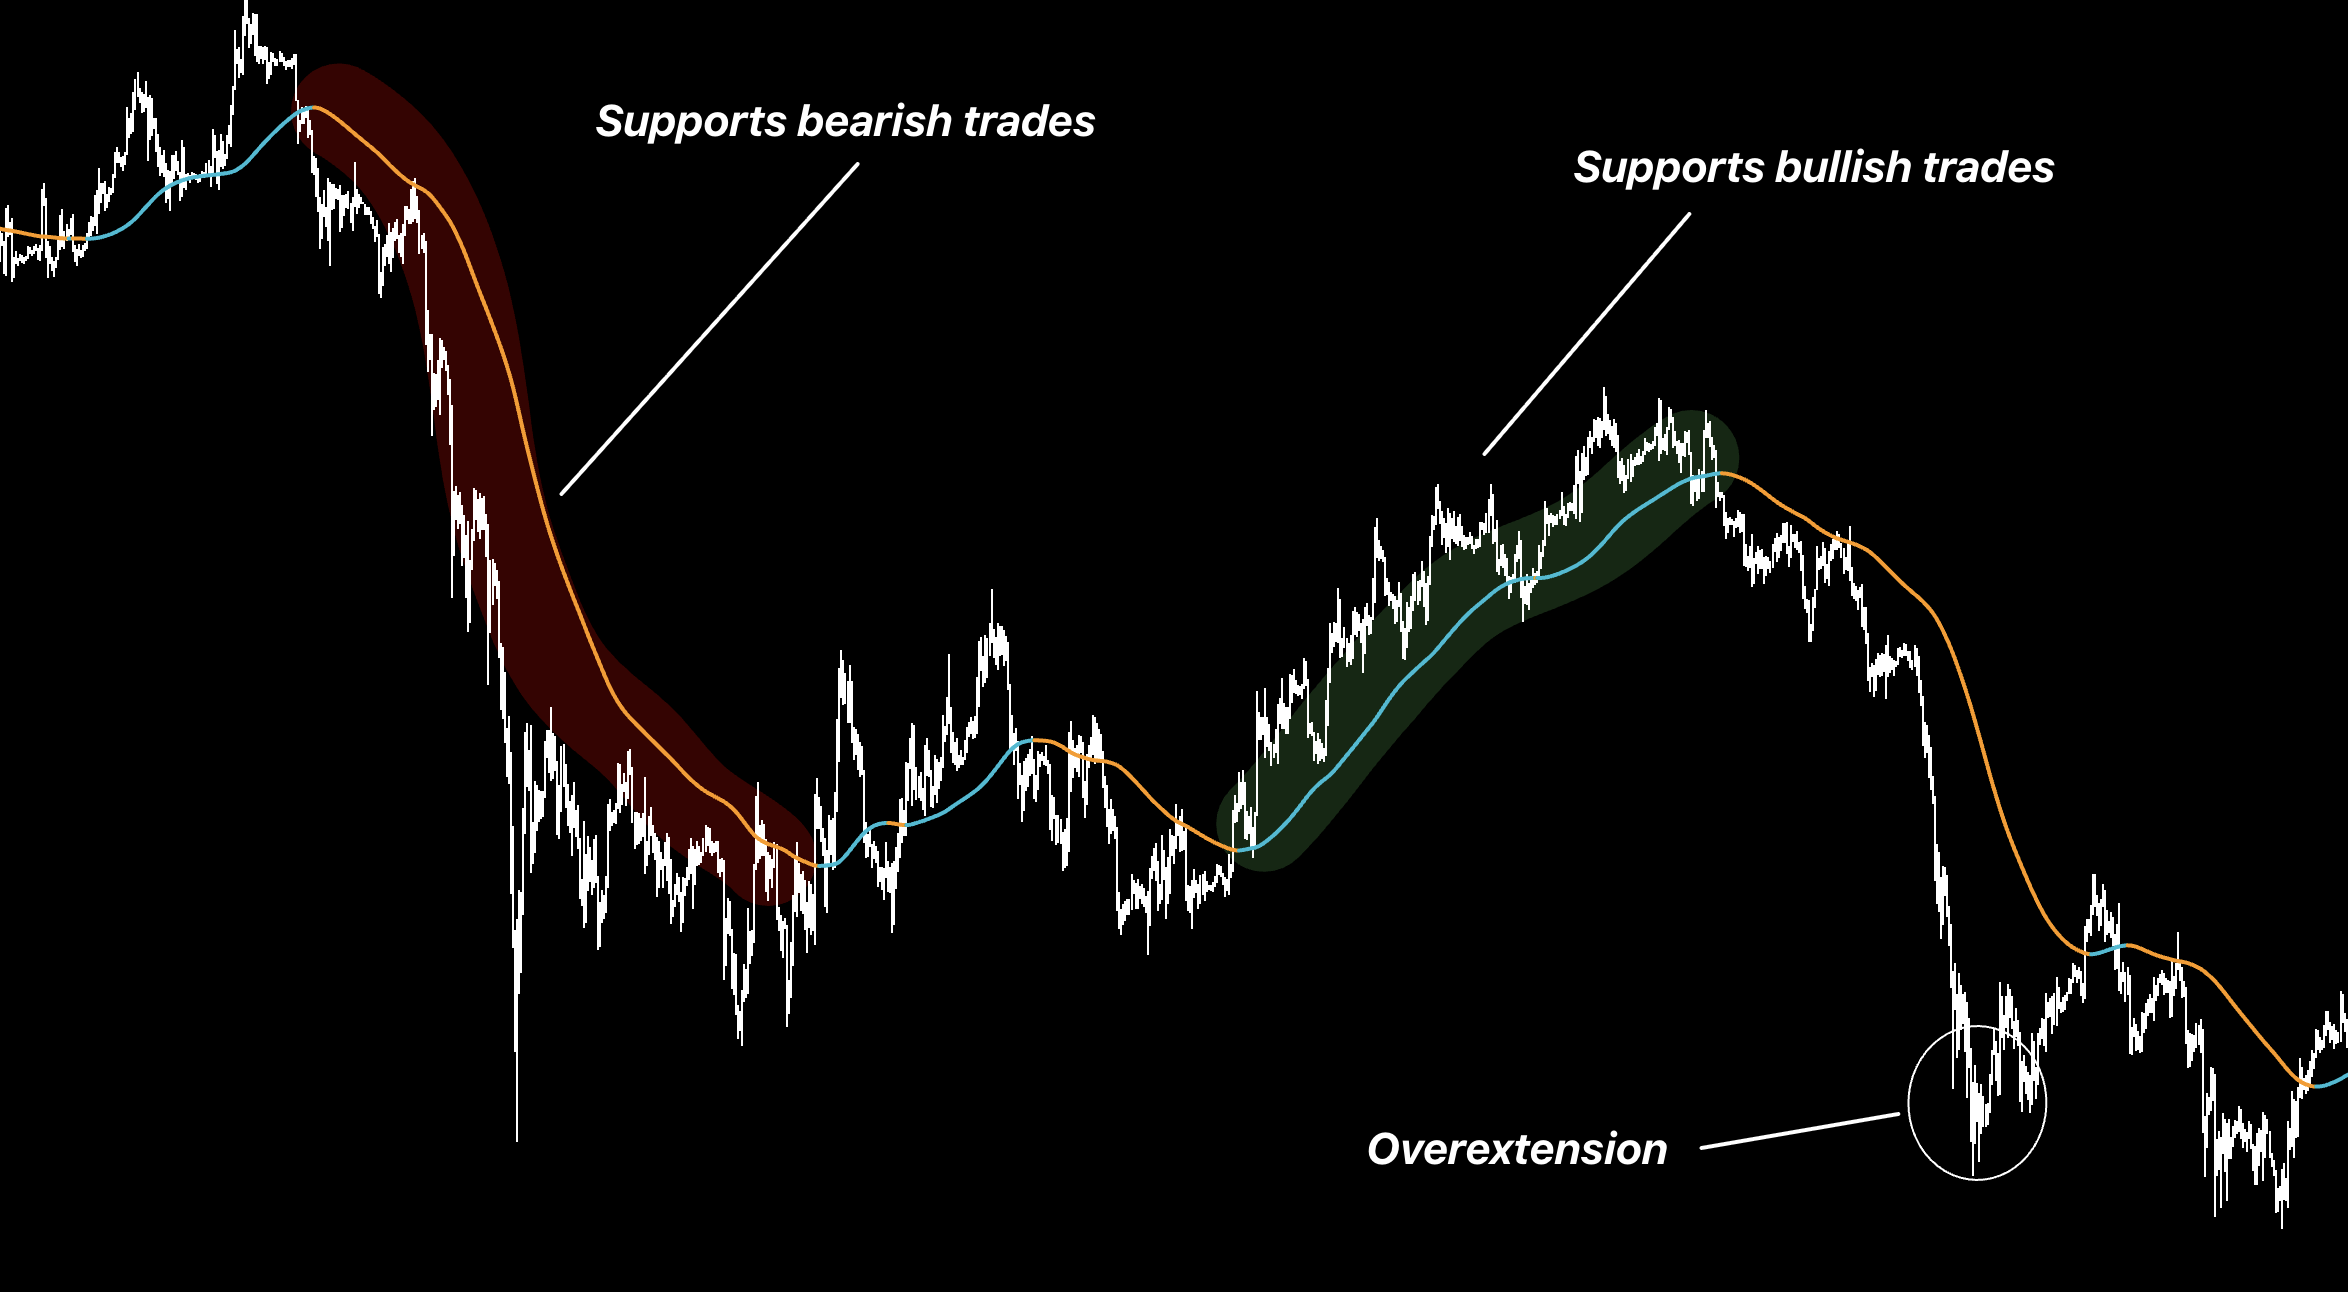
Silk EMA
Use price position and slope as one extra direction check.
Bar Coloring
Choose one color mode for signal direction, broader bias, or extremes. It is context—not another entry.
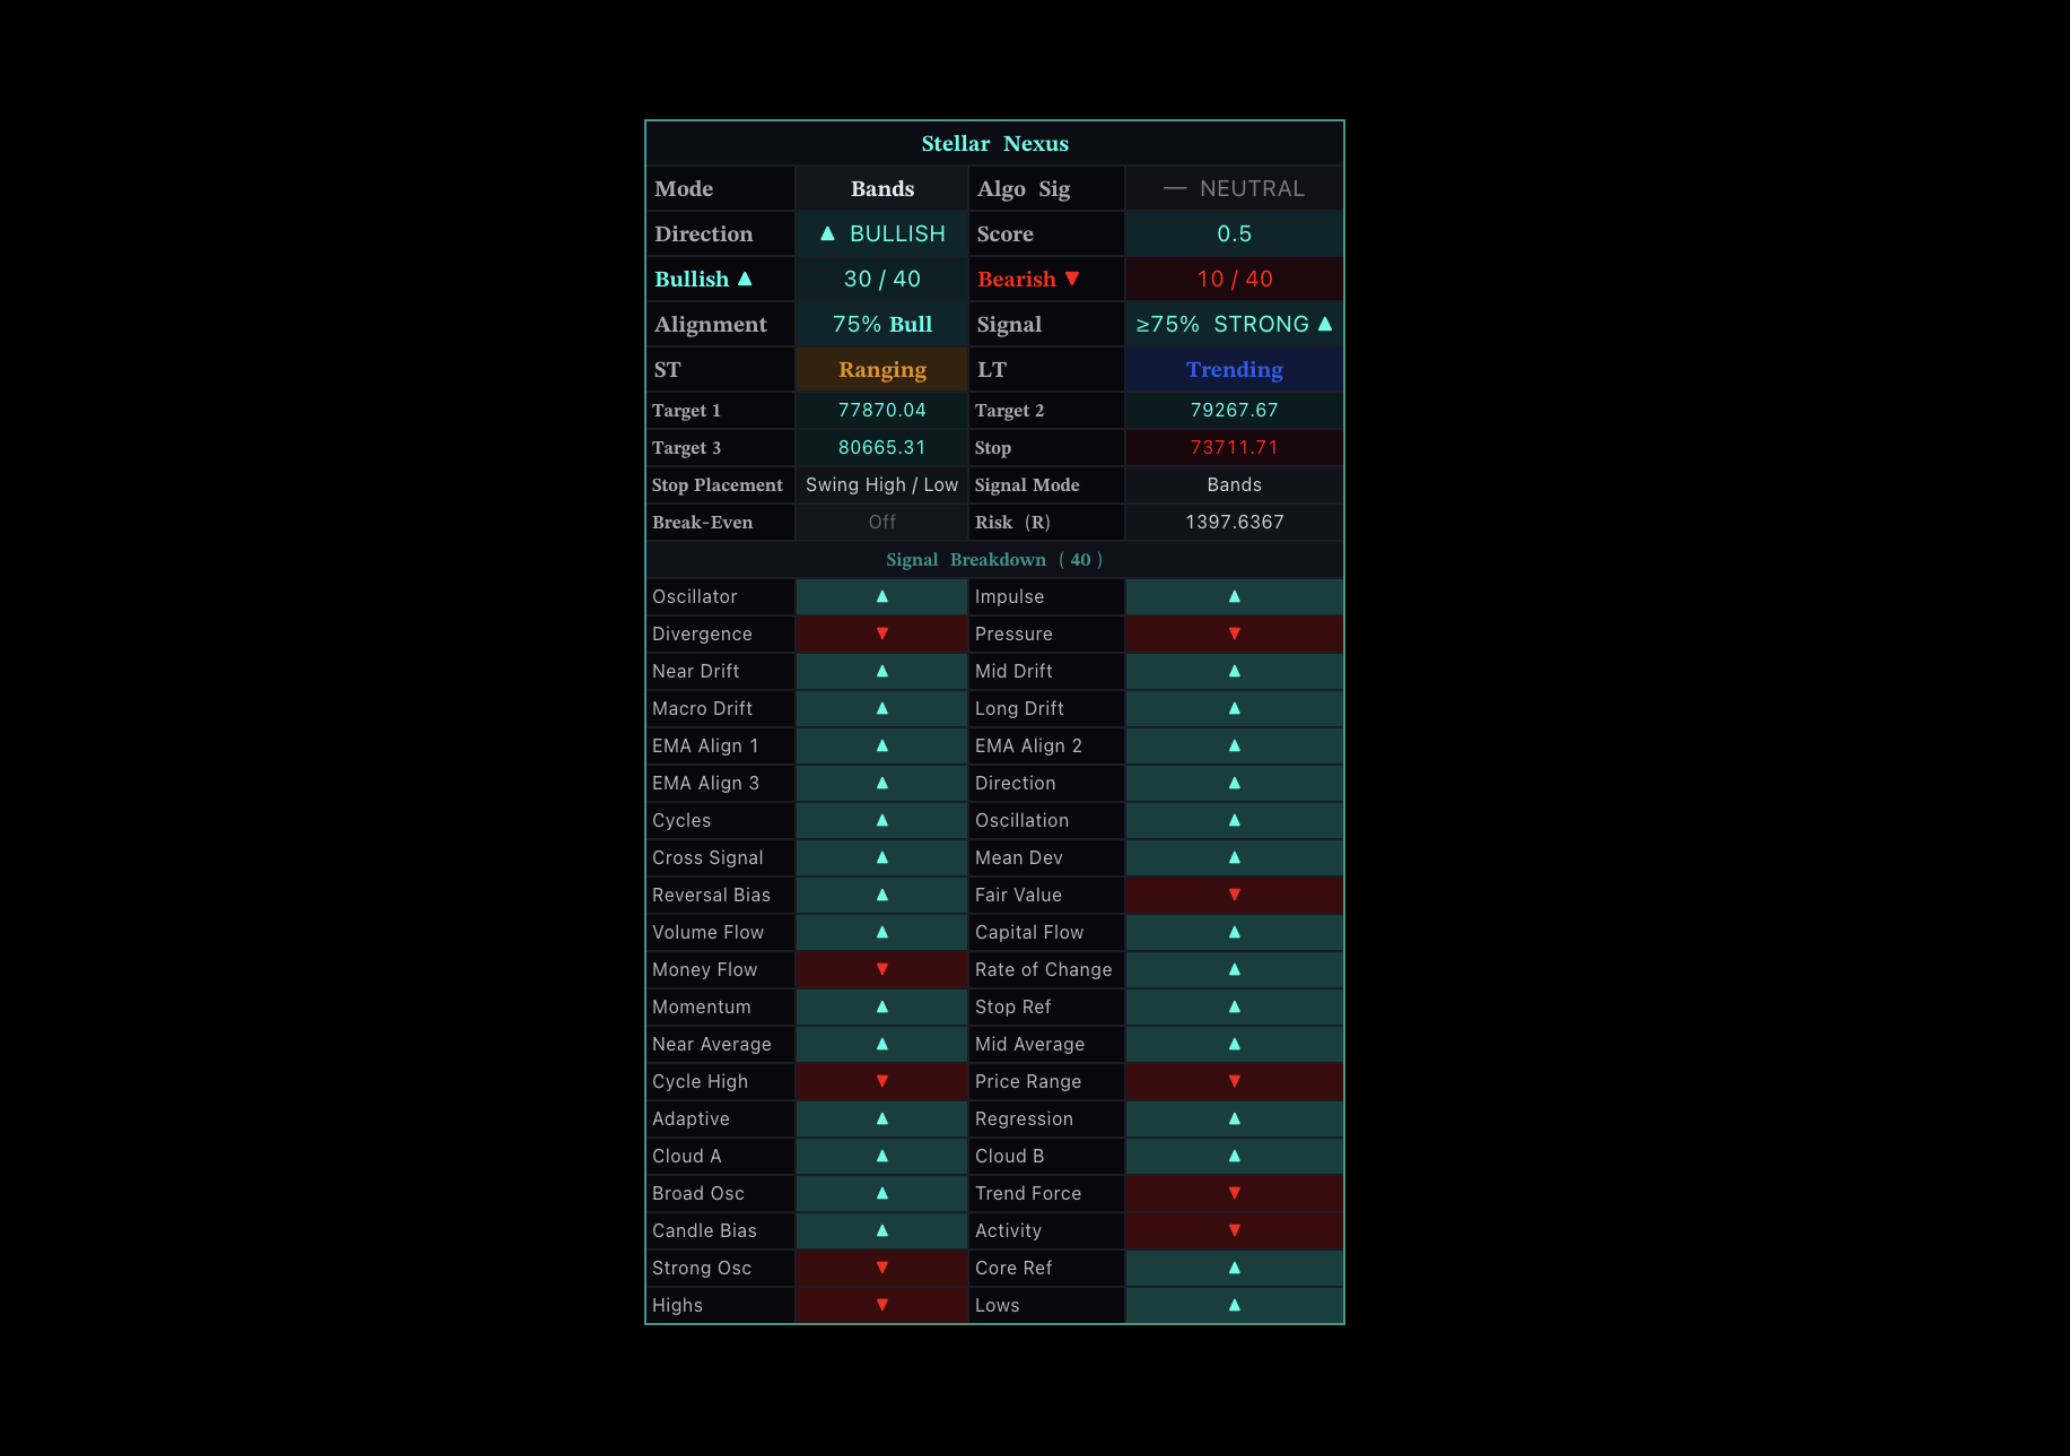
Dashboard
Use it to confirm direction, score, alignment, and state. The chart signal remains the trigger.
PineConnector
PineConnector can forward confirmed Stellar Nexus signals to an external execution setup.
Enable PineConnector and enter the correct License ID.
Set trade count, risk, SL/TP, symbol mapping, and optional break-even.
Create a TradingView alert using Any alert() function call.
Recreate the alert after changing indicator settings.
Demo-test direction, size, SL, TP, and symbol before live use.
⚠Automation can repeat a wrong setting immediately. Test the full route on demo and never share the License ID.
Recommended
Best For
Pure Daily trend following.
Recommended Setup
Use a 1D chart in Bands Mode. In the display settings, turn off everything except Bar Coloring.
Why
The bar color gives the active direction without adding extra confirmation or clutter.
Trend
Trend Alpha ++
An advanced trend framework for traders who want to choose or build a signal system.
Introduction
Trend Alpha is not a beginner “follow every feature” tool. Choose one signal mode, use only the confirmation displays you need, and manage the trade with its targets.
How to Use
1
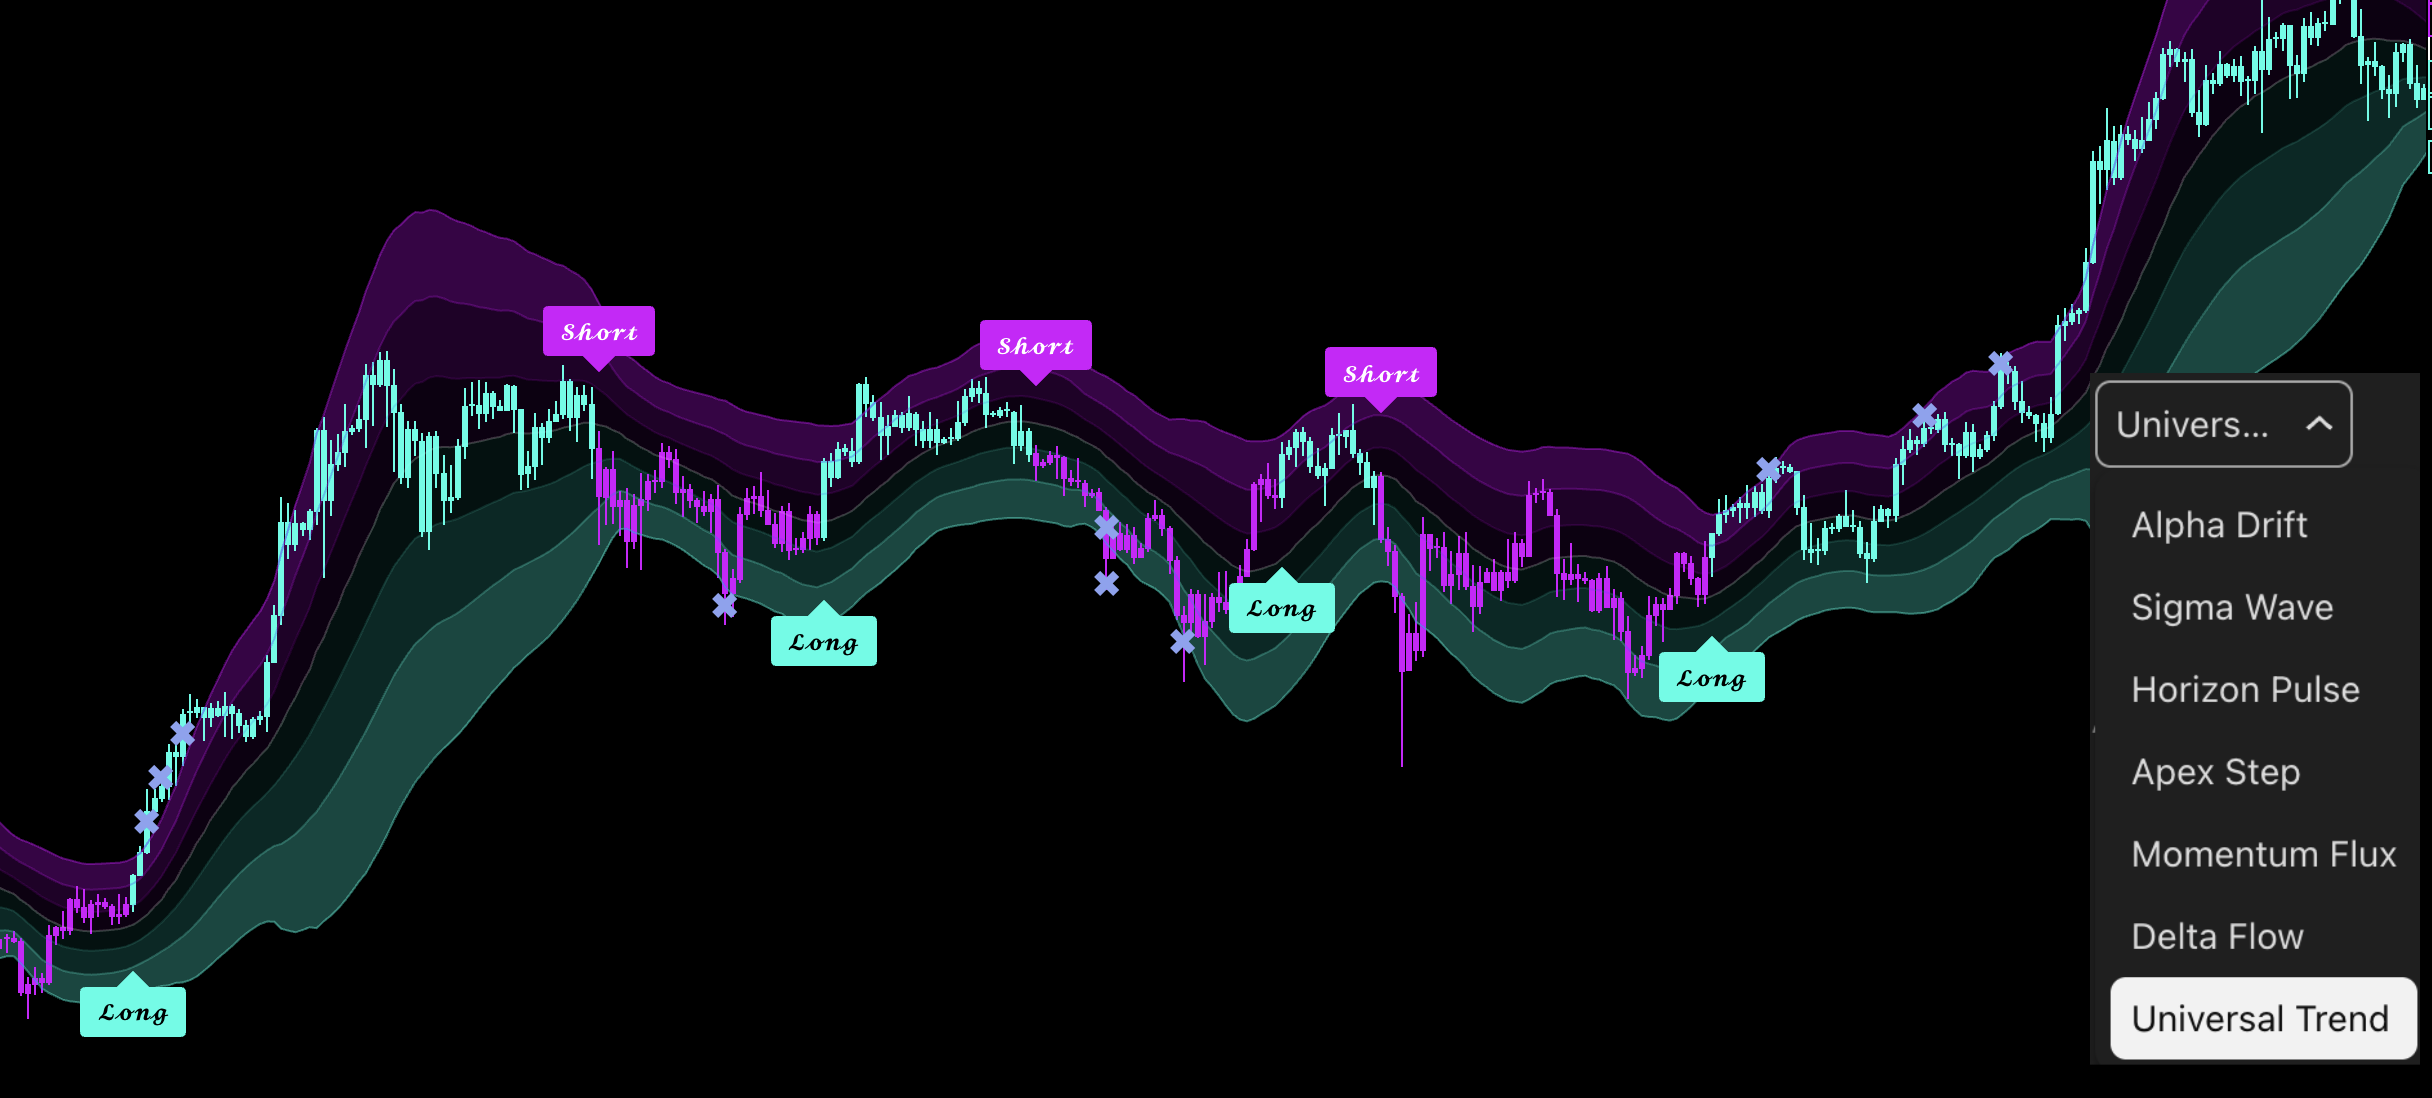
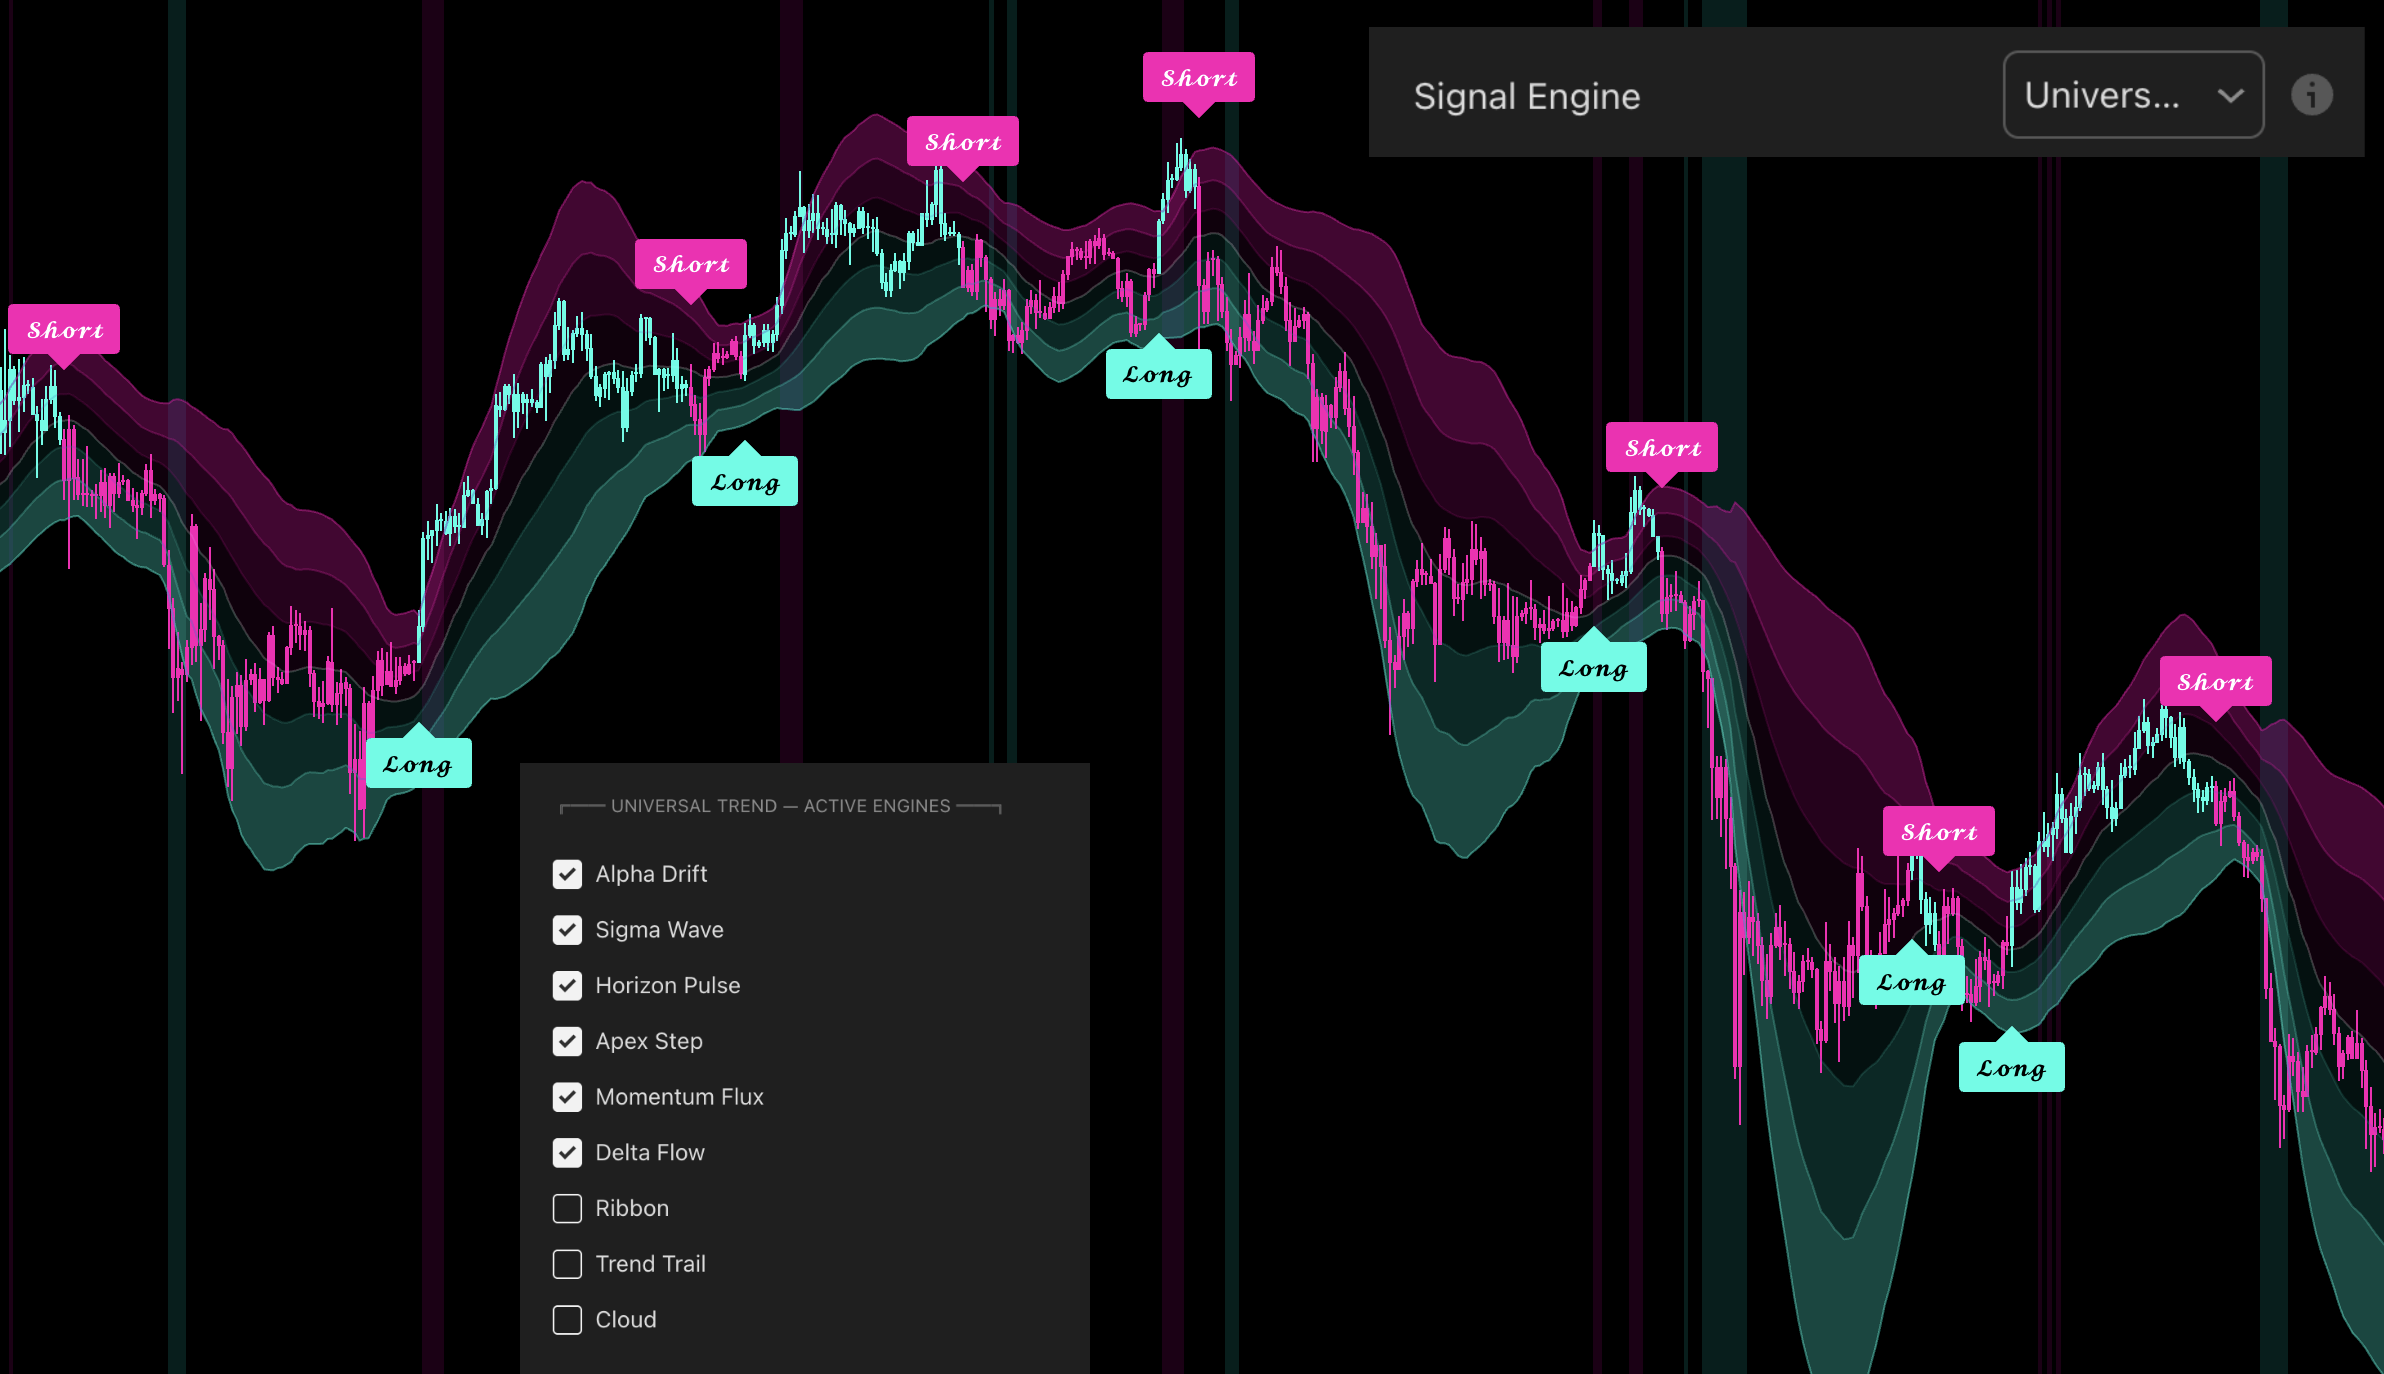
Choose the timeframe first. Use Alpha Drift, Sigma Wave, Momentum Flux, Delta Flow, or Uni Trend mainly on Daily. Use Apex Step, Horizon Pulse, or a tested Universal Trend build on lower timeframes.
2
Follow the selected mode's direction. Bullish means favor Longs; bearish means favor Shorts. The table can be used as the same directional filter for another setup.
3
Take the displayed targets. Slower trend modes can catch large moves but reverse late, so do not wait for the opposite signal to secure every profit.
4
Use one or two visual tools. Give each one a job—stop placement, target location, or momentum confirmation.
Signal Modes
Alpha Drift
Use mainly on Daily for steady trend direction.
Sigma Wave
Use mainly on Daily when a smoother directional read is preferred.
Momentum Flux
Use mainly on Daily when momentum agreement should drive the trend state.
Delta Flow
Use mainly on Daily for a flow-based directional system.
Uni Trend
Use mainly on Daily as a balanced standalone trend mode.
Apex Step
Use on lower timeframes for a responsive directional workflow.
Horizon Pulse
Use on lower timeframes as the signal or as bias for another entry tool.
Universal Trend
Select Universal Trend as the Signal Mode, then enable the components your system requires. For a slower Daily build, combine several Daily engines. For lower timeframes, use fewer responsive components so the signal does not become unnecessarily late.
◆More enabled components do not automatically create a better system. Add a component only when it has a tested purpose.
Visual Features
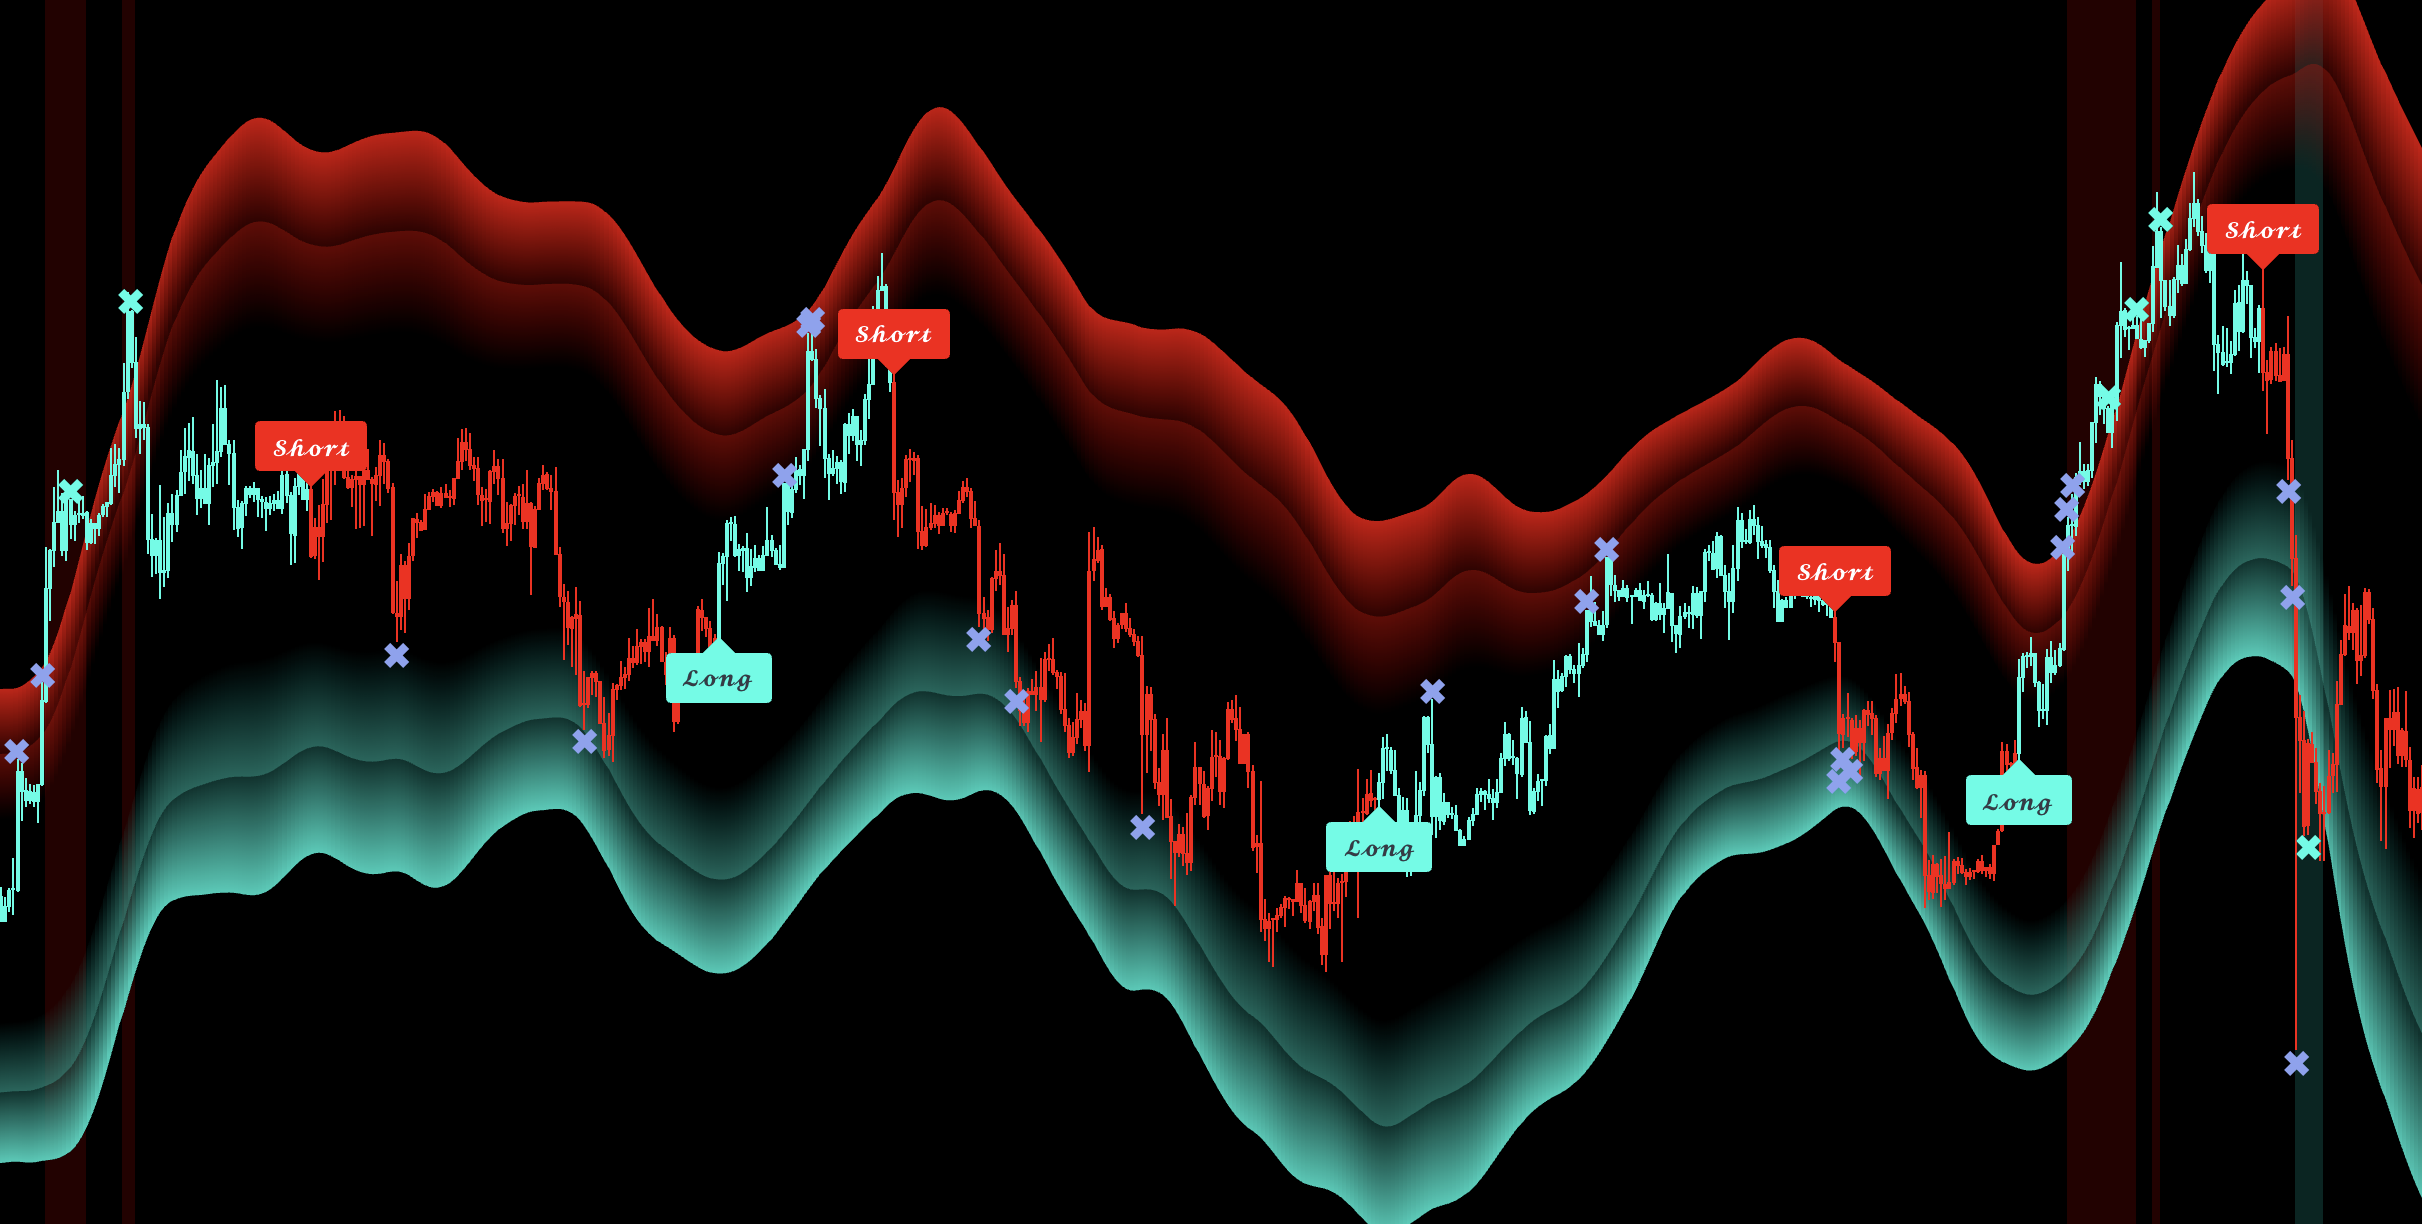
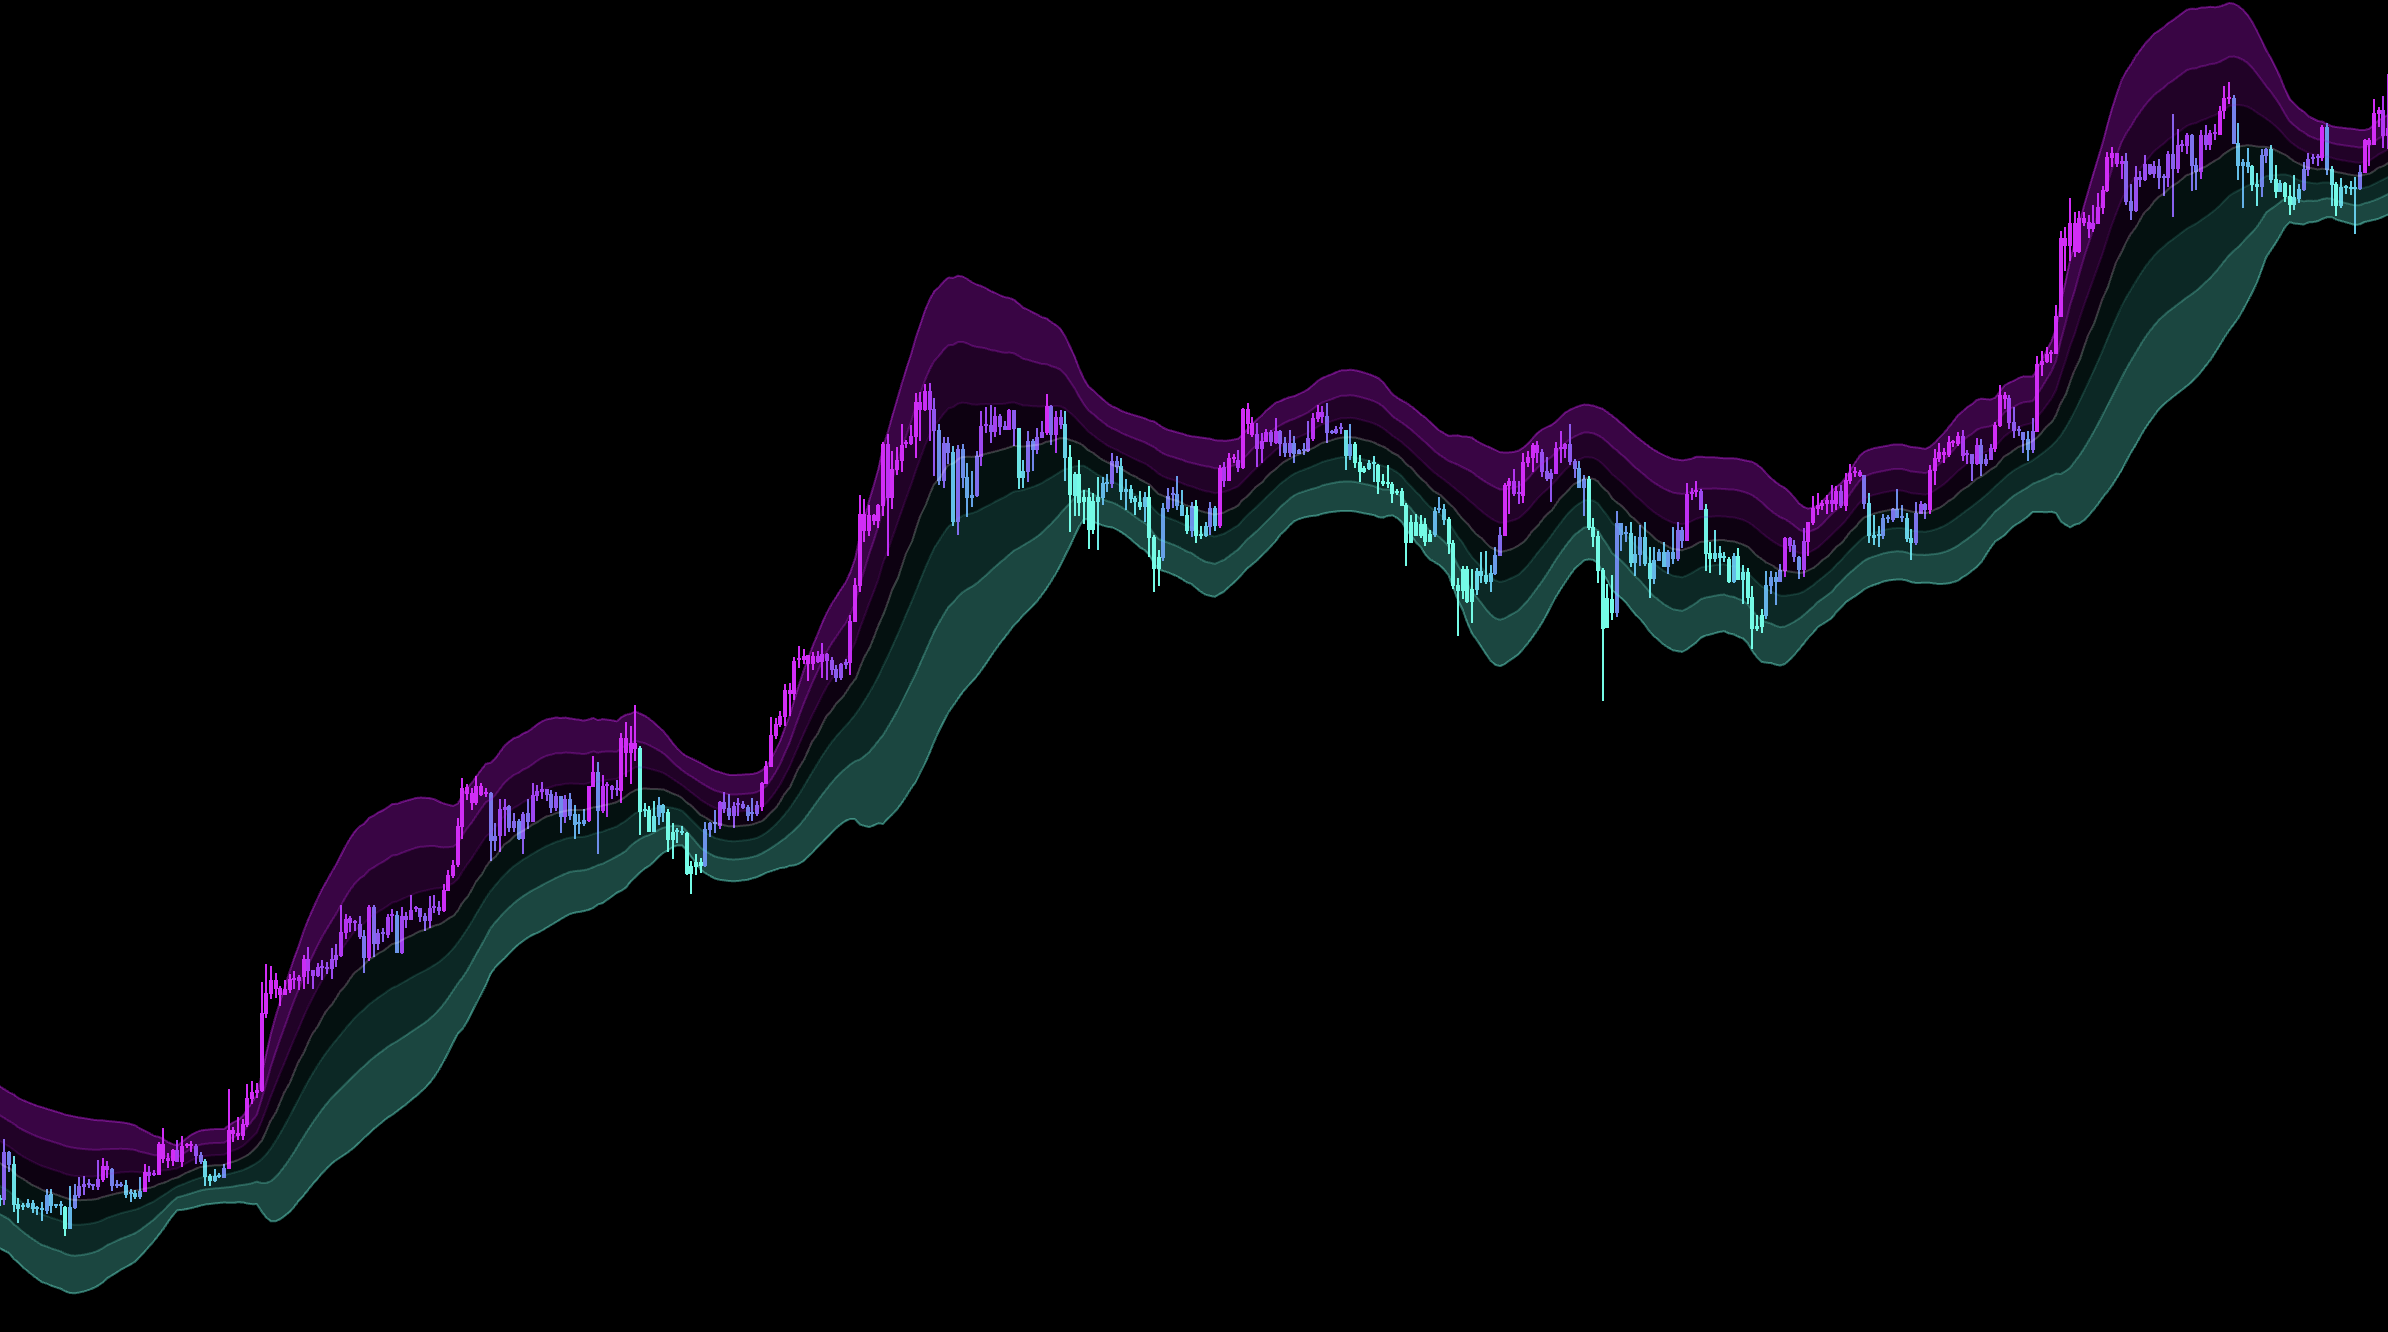
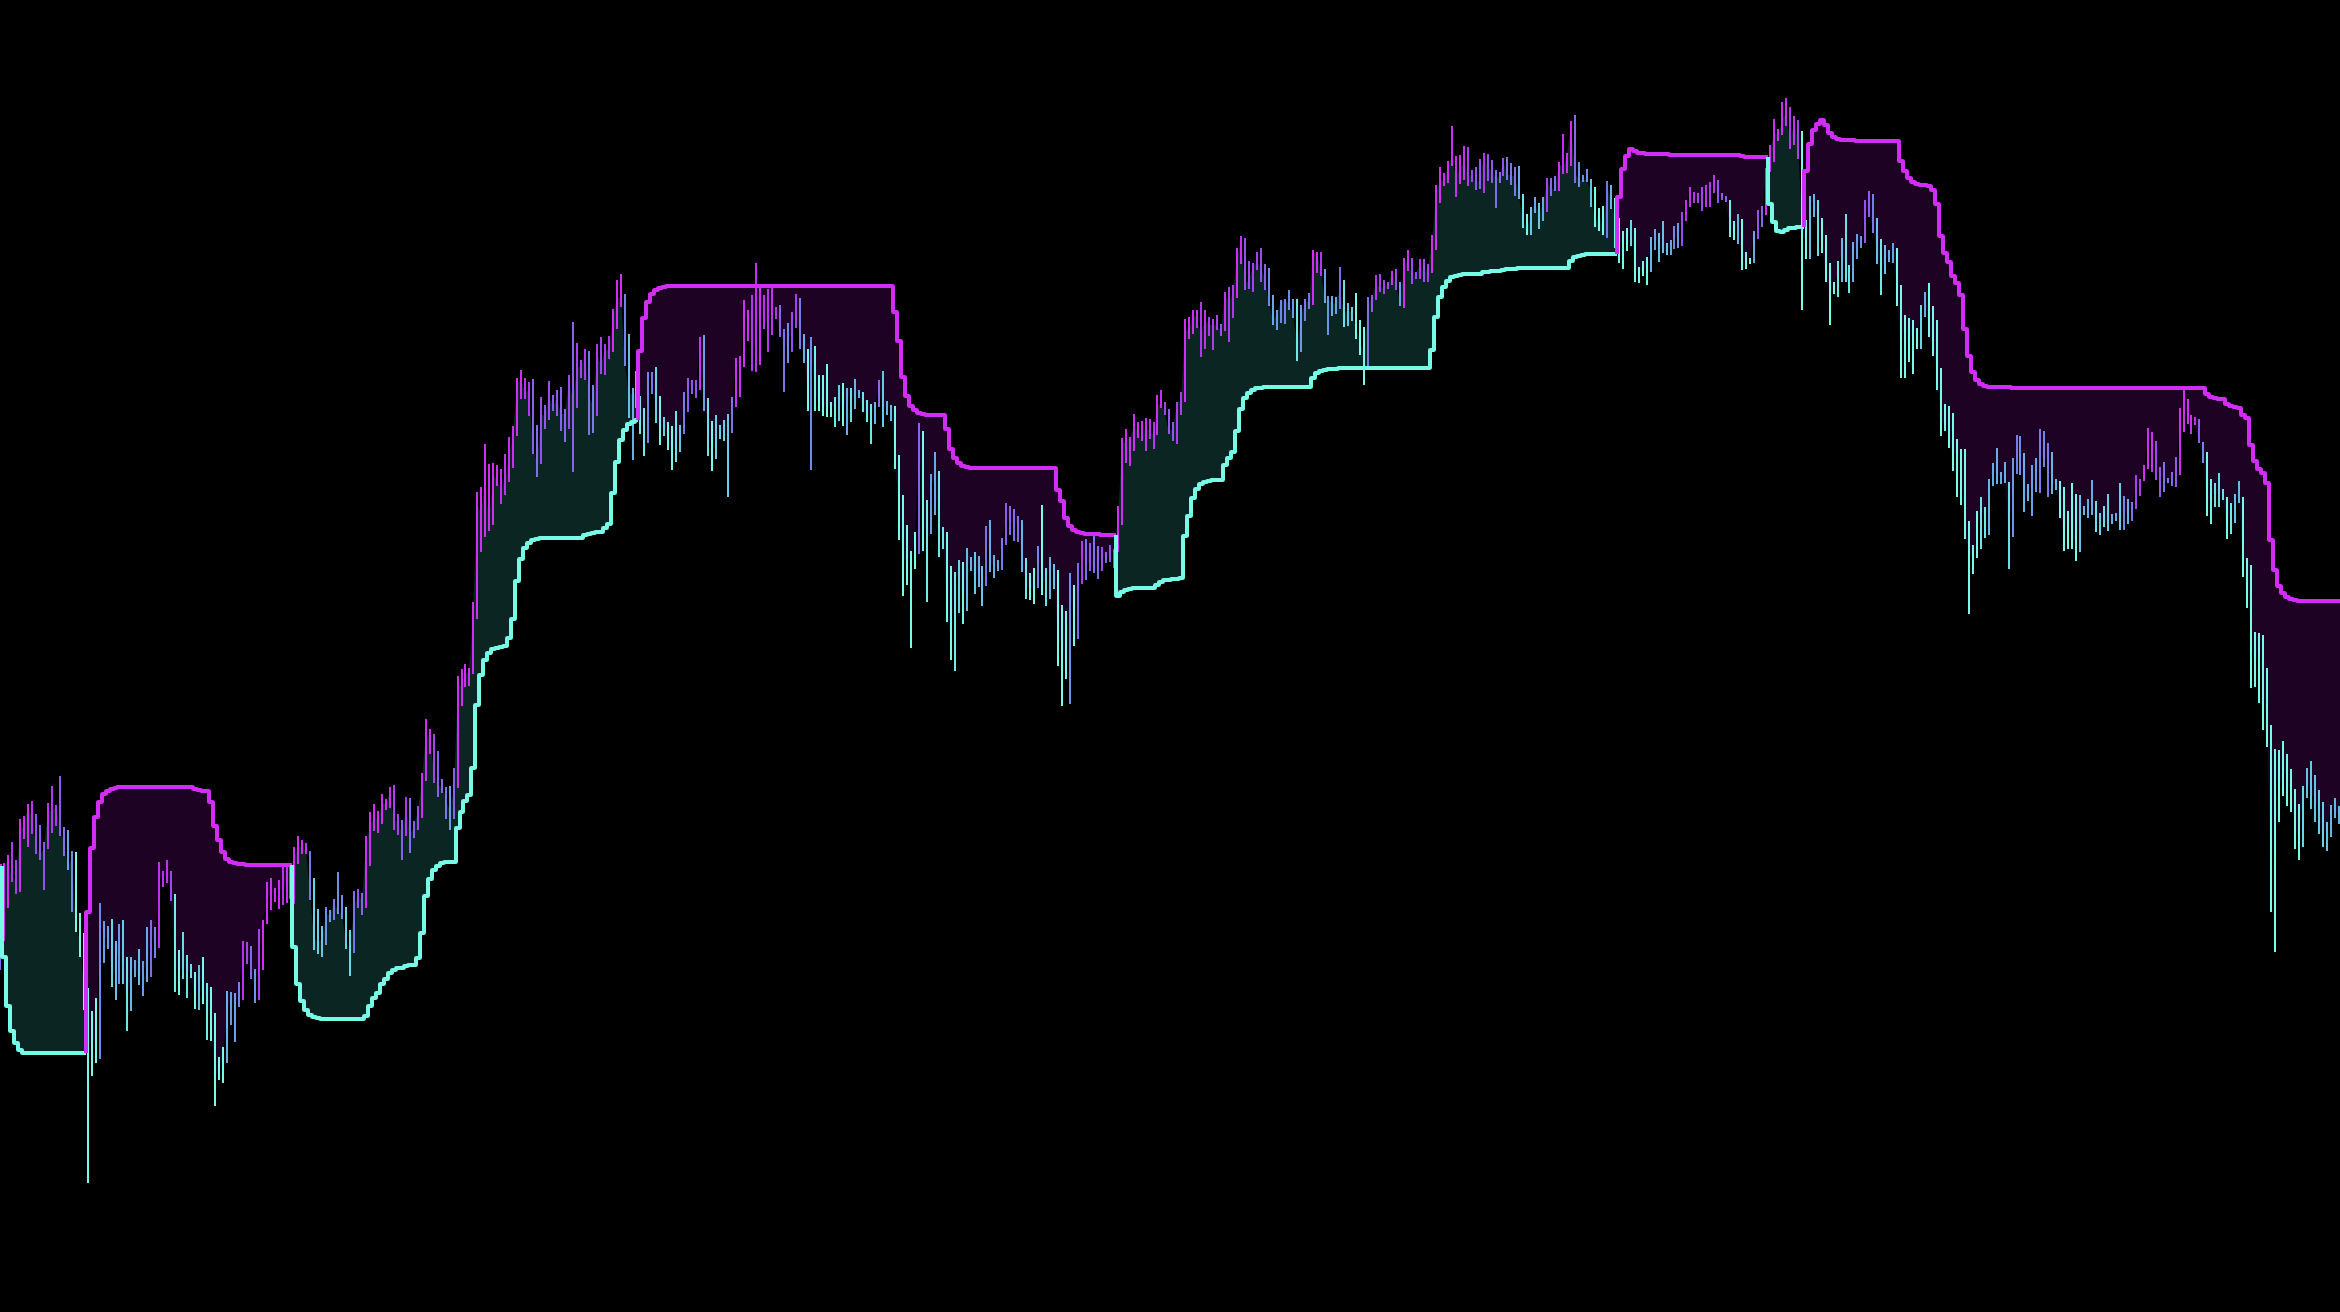
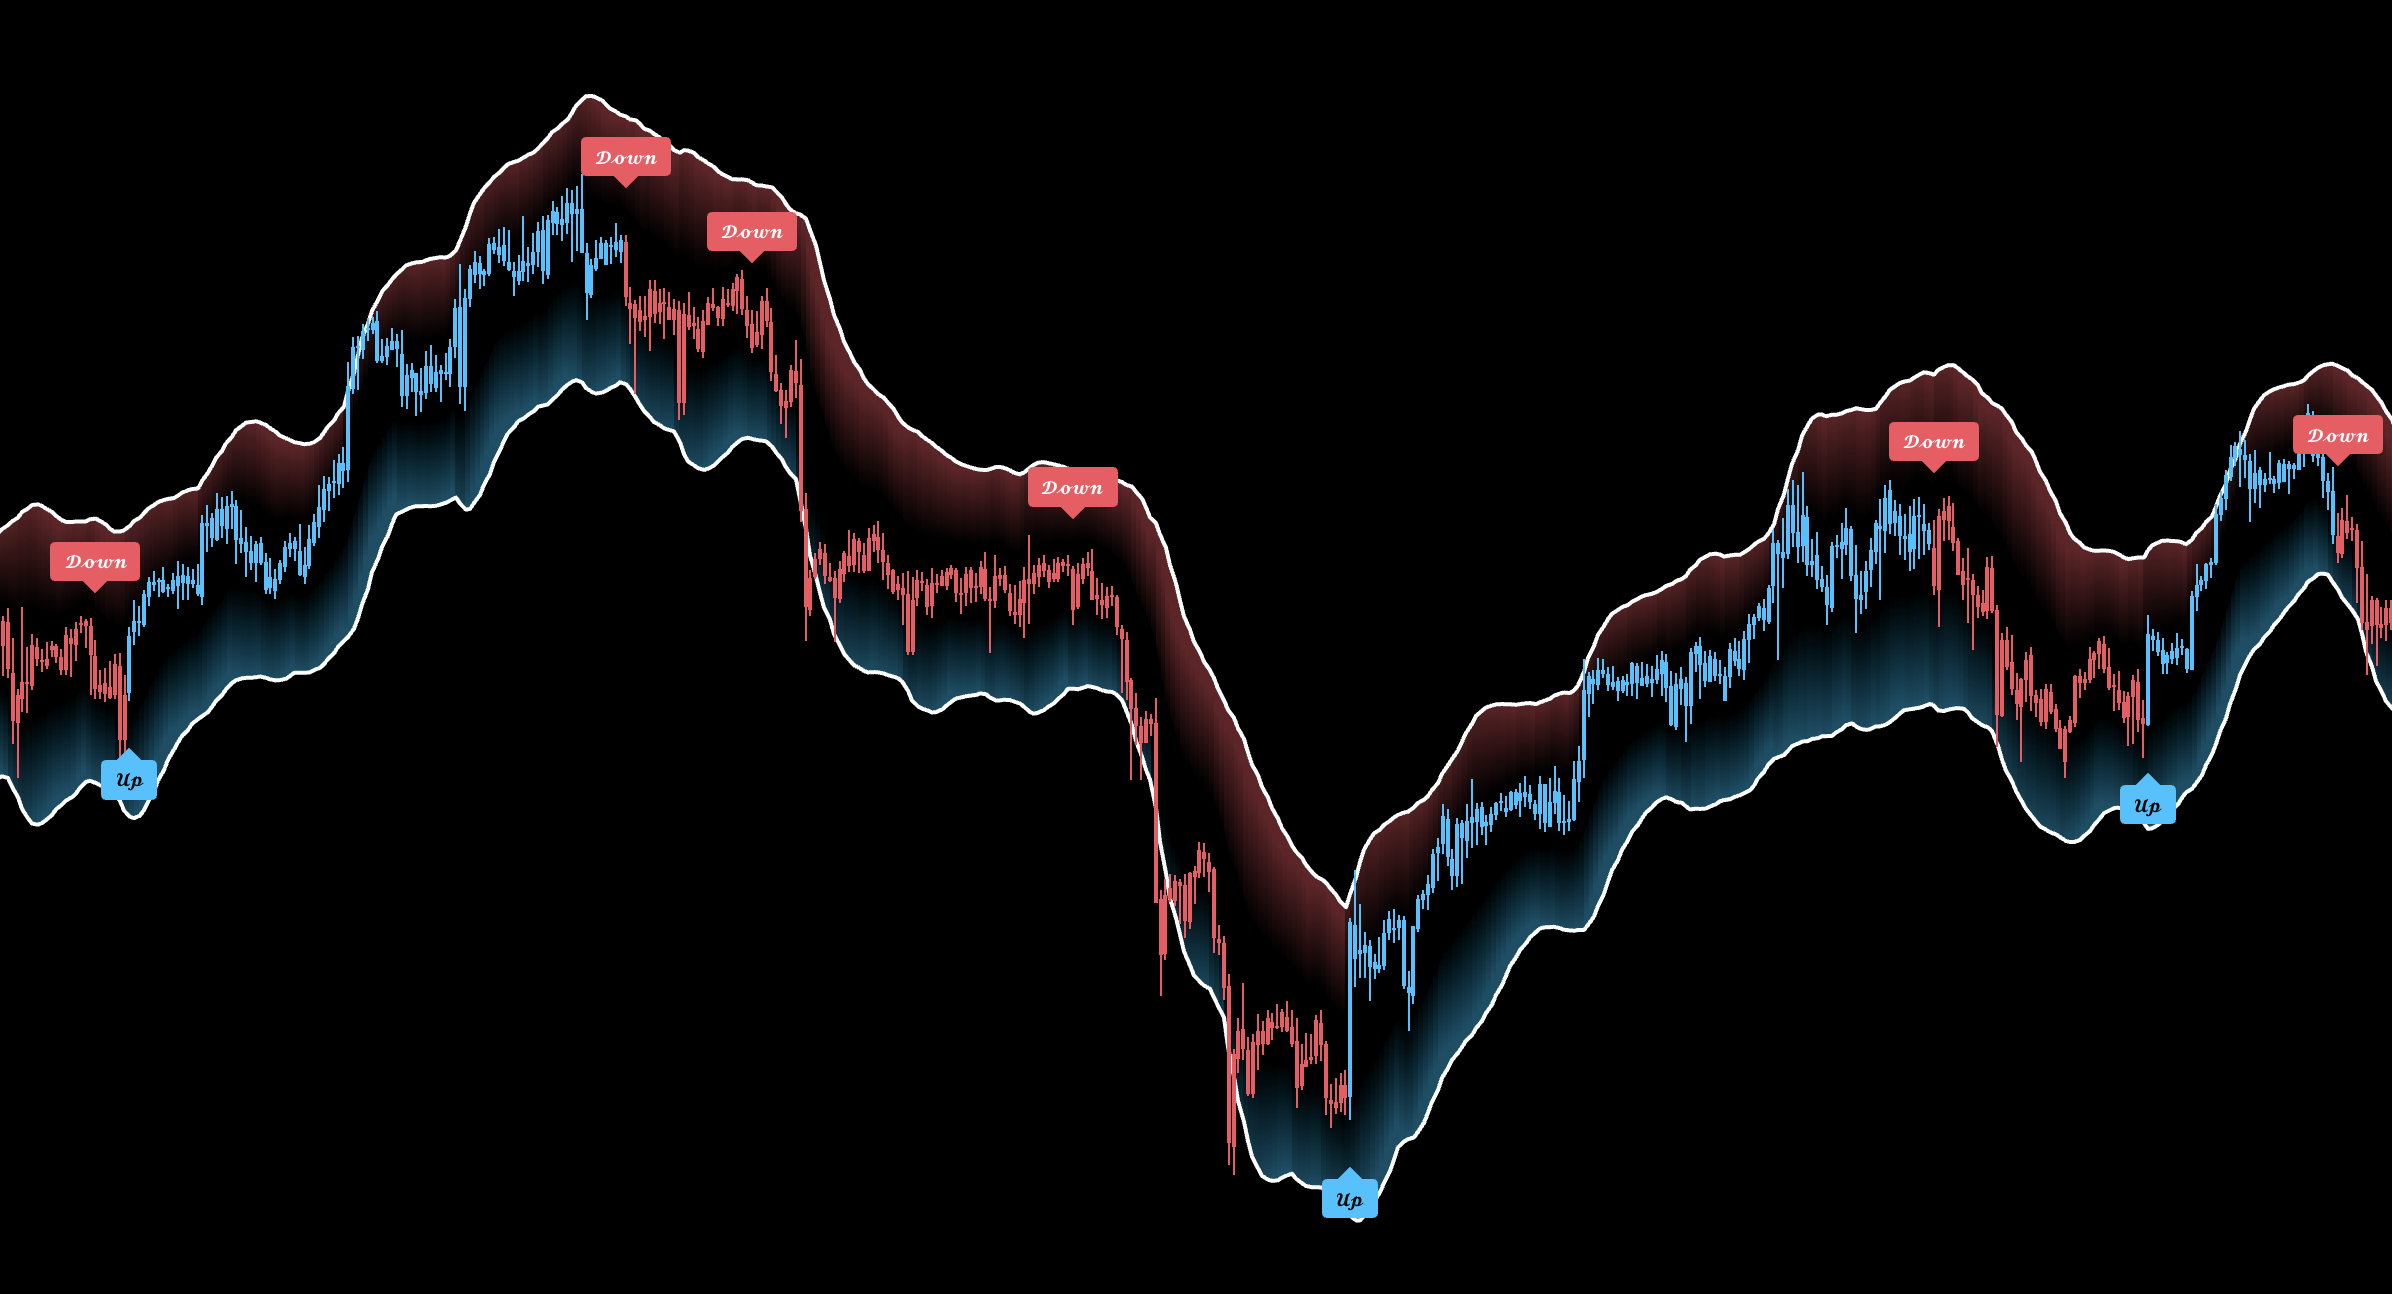
Signal Bands
Use as an early reversal warning and reduce size when price approaches the danger side of the active trend.
Spectrum Bands
Use for profit-taking and Dynamic TP when price returns through an outer band.
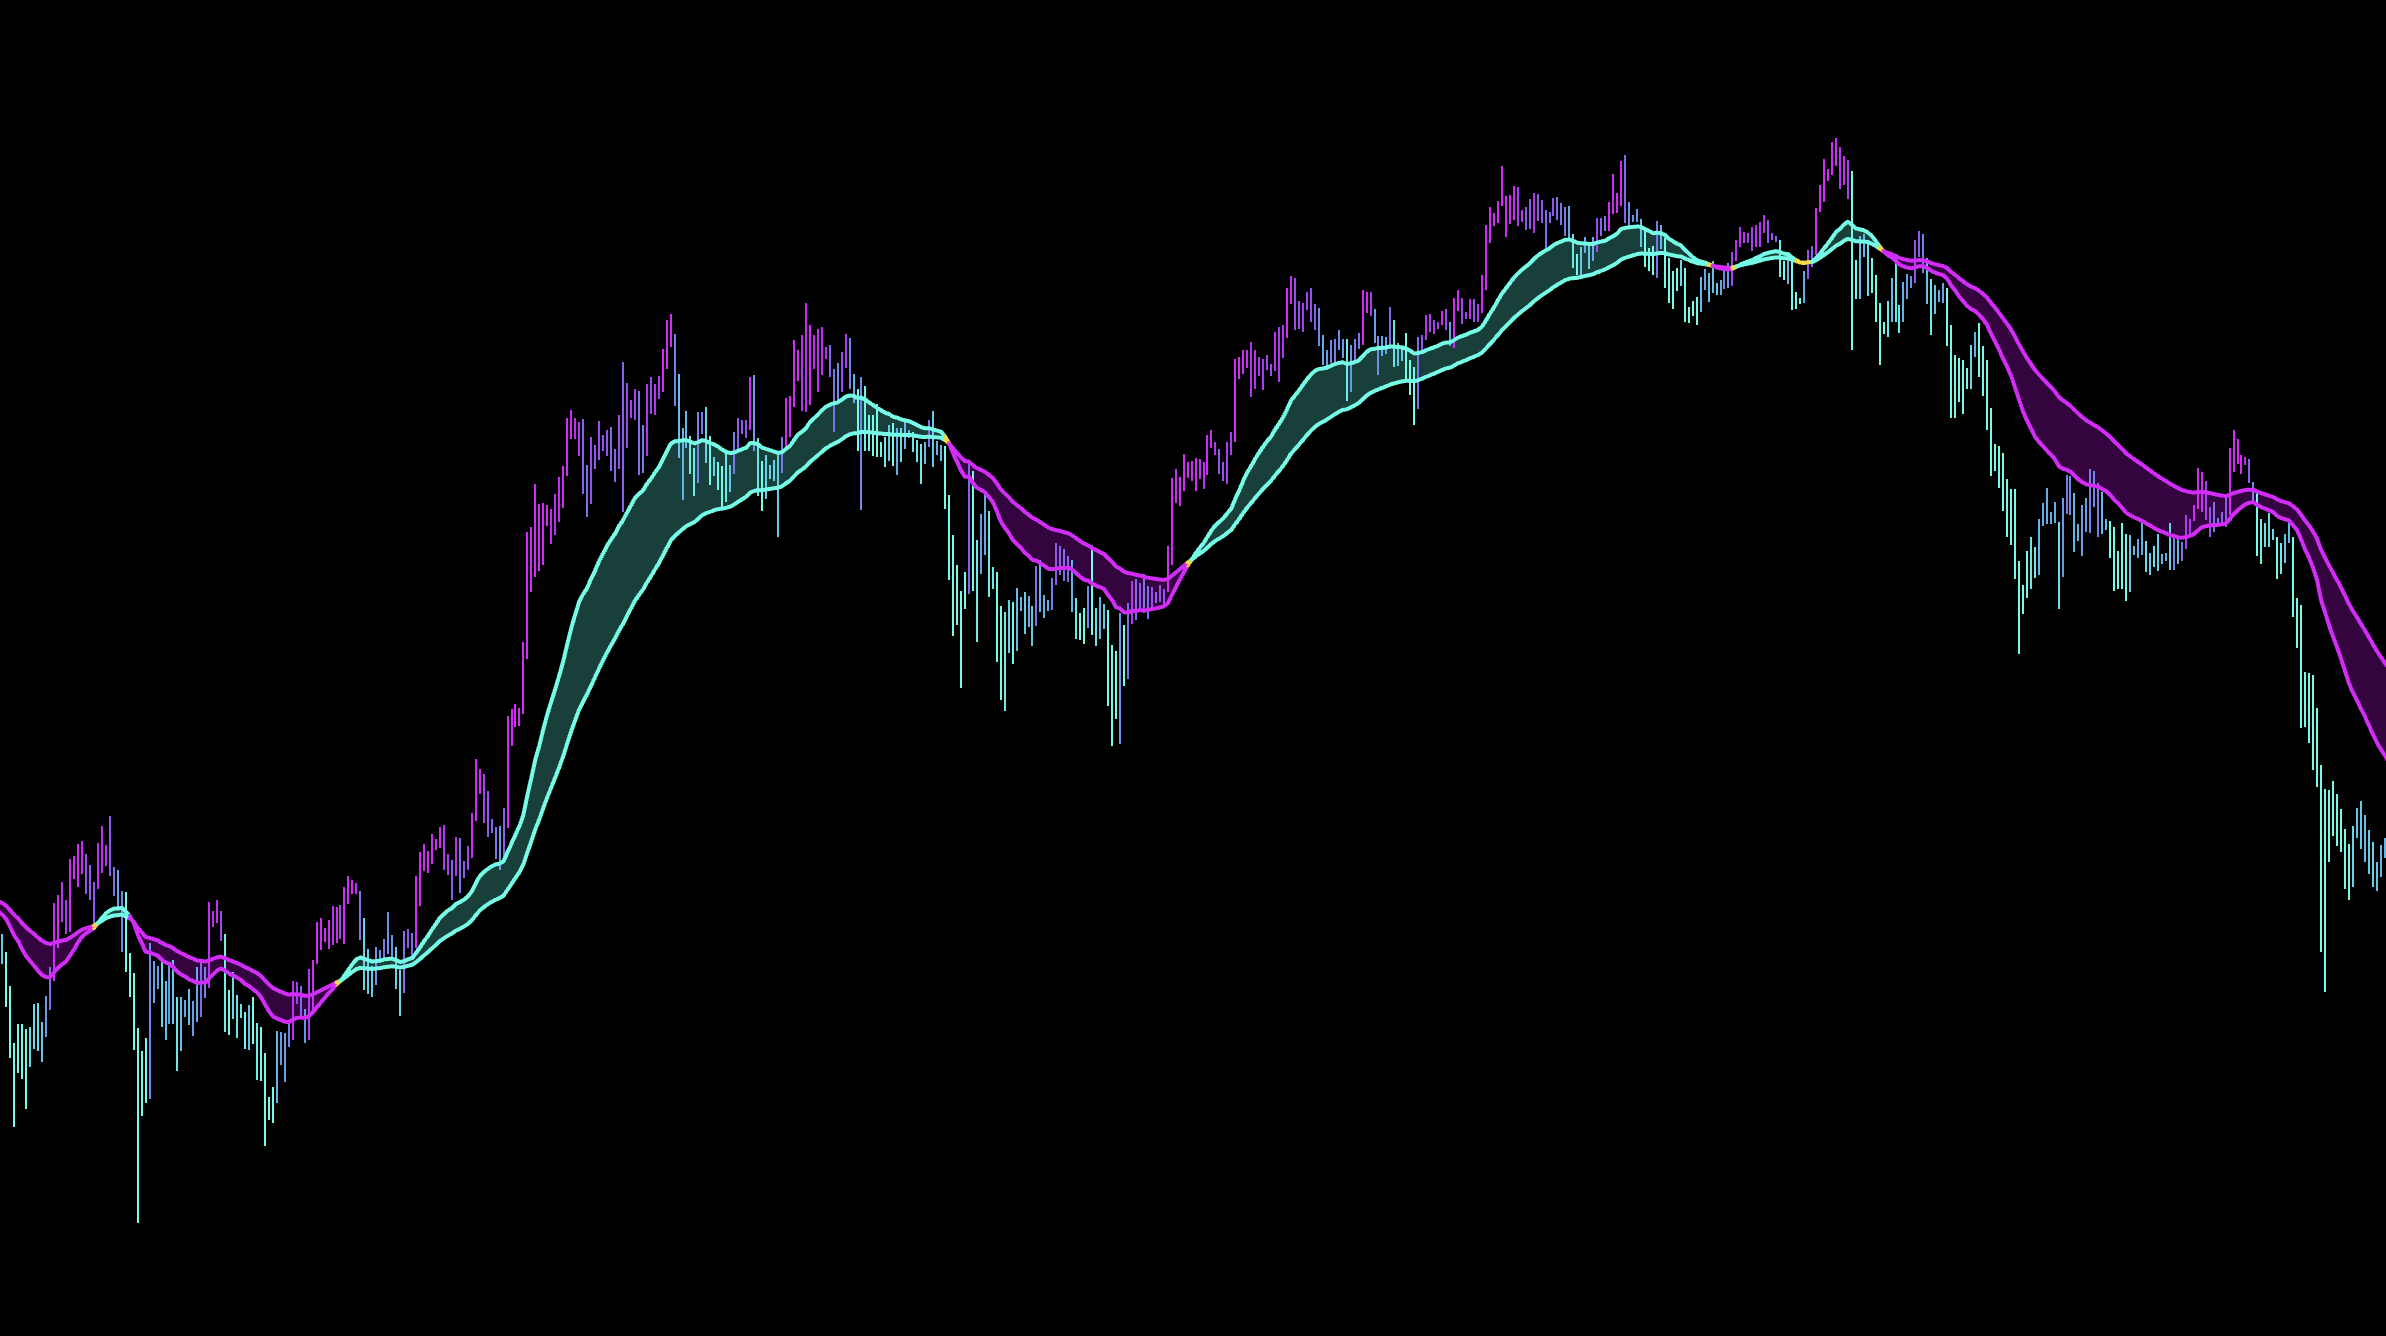
Ribbon
Place the stop behind the supportive side of the Ribbon.
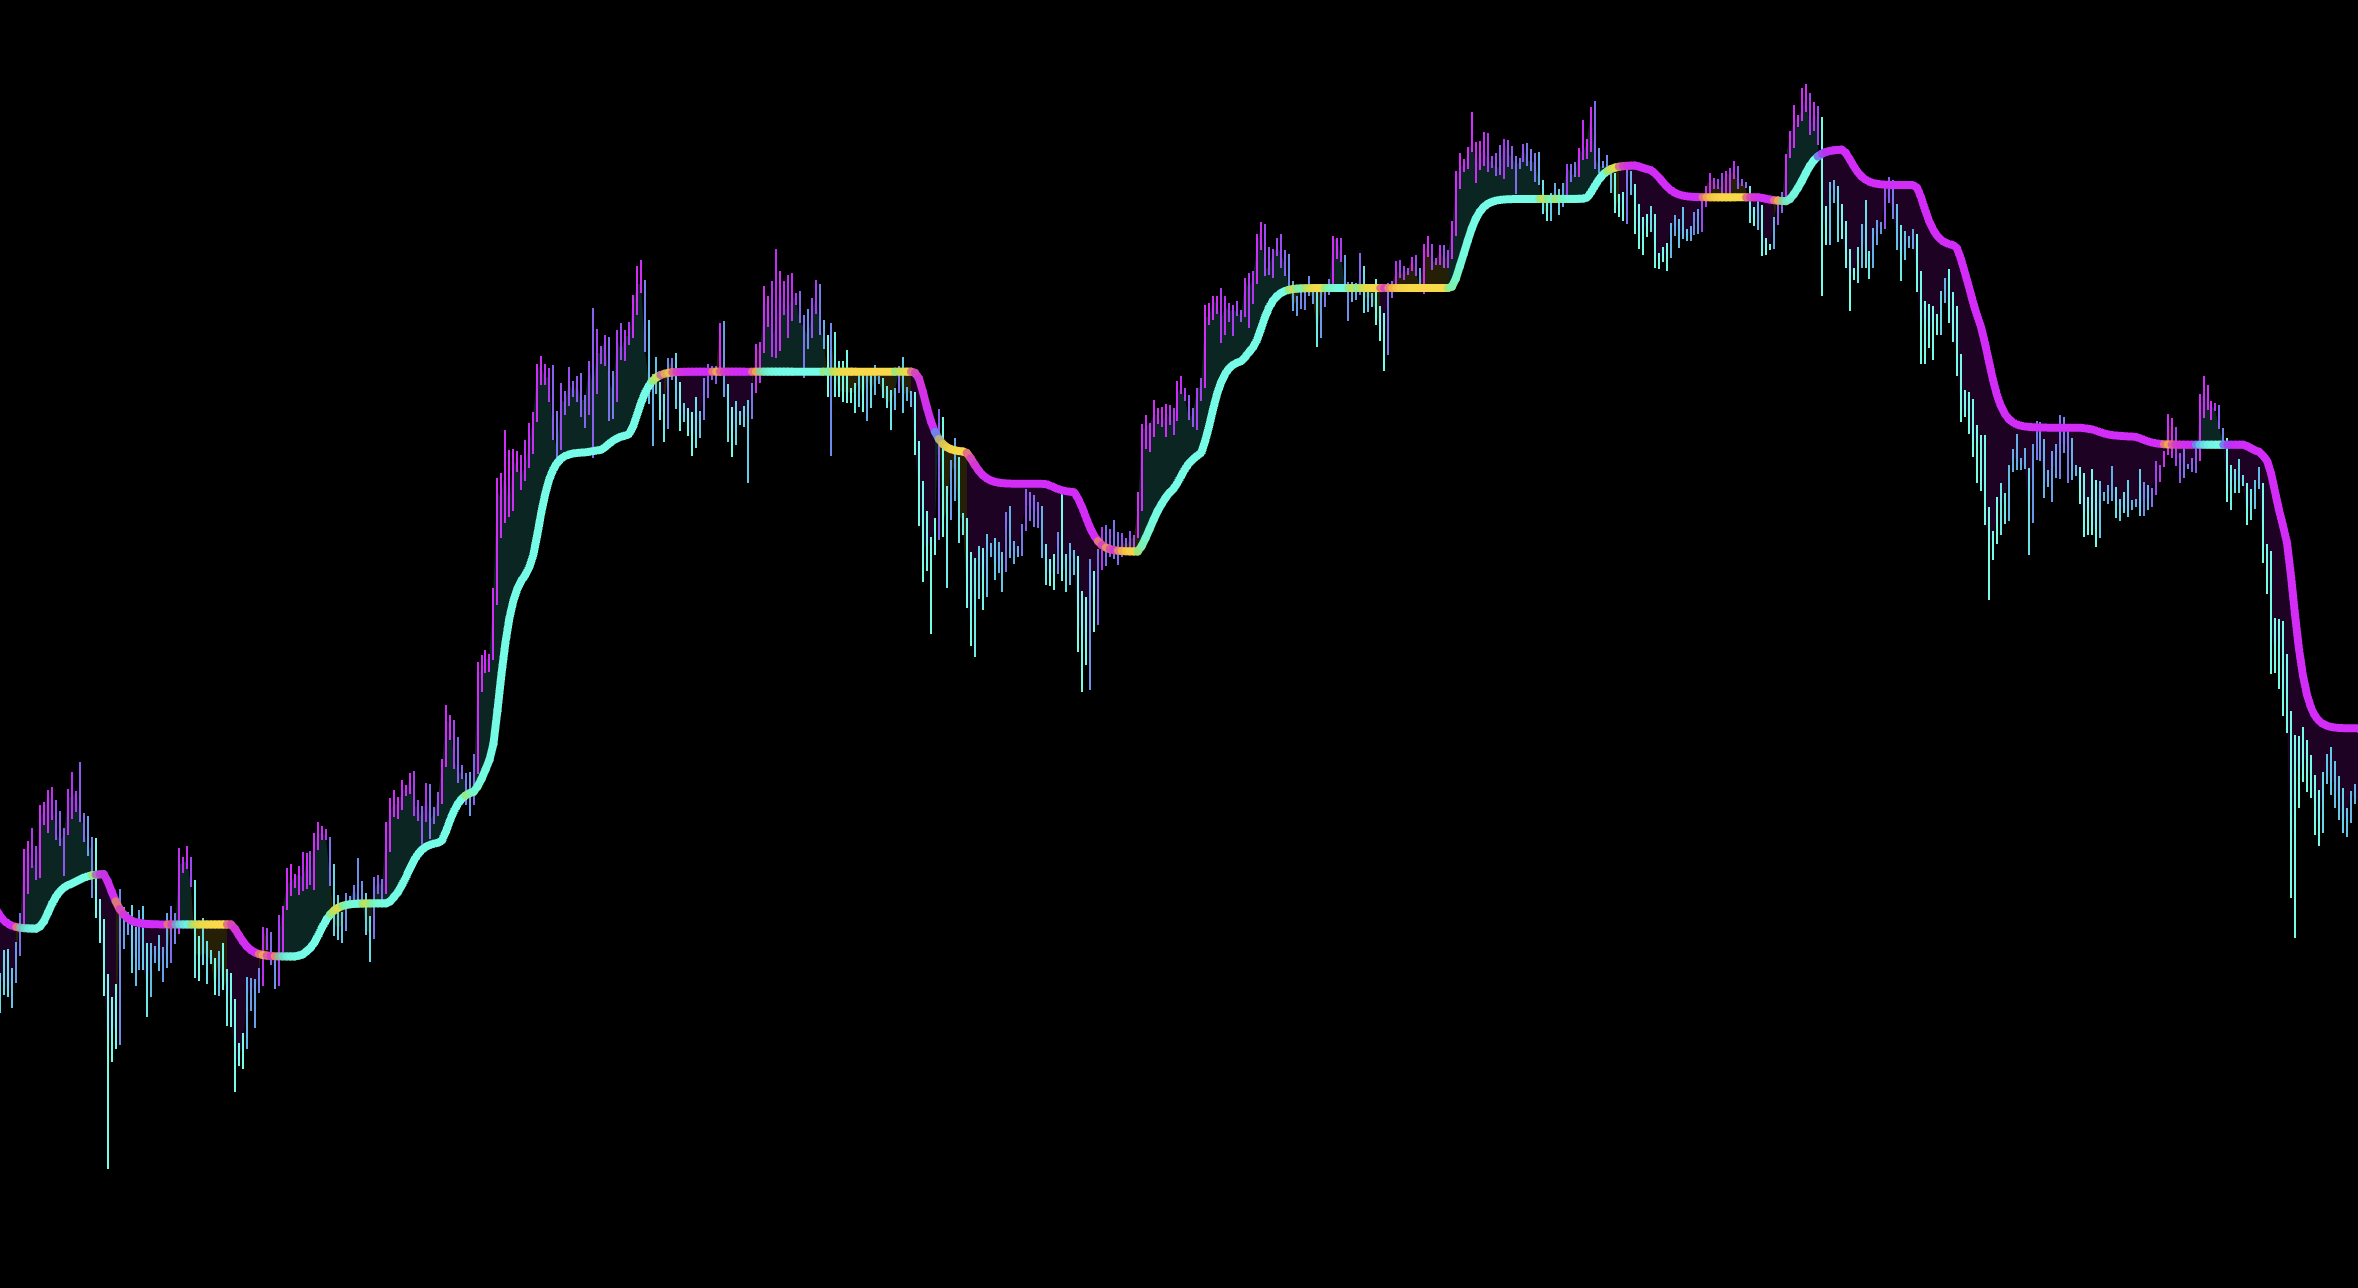
Trend Trail
Use agreement as confluence and a flip as a warning that the trade is weakening.
Cloud
Use for longer-term momentum confirmation.
Bar Coloring
Select one color mode for signal, trend, momentum, or reversal context.
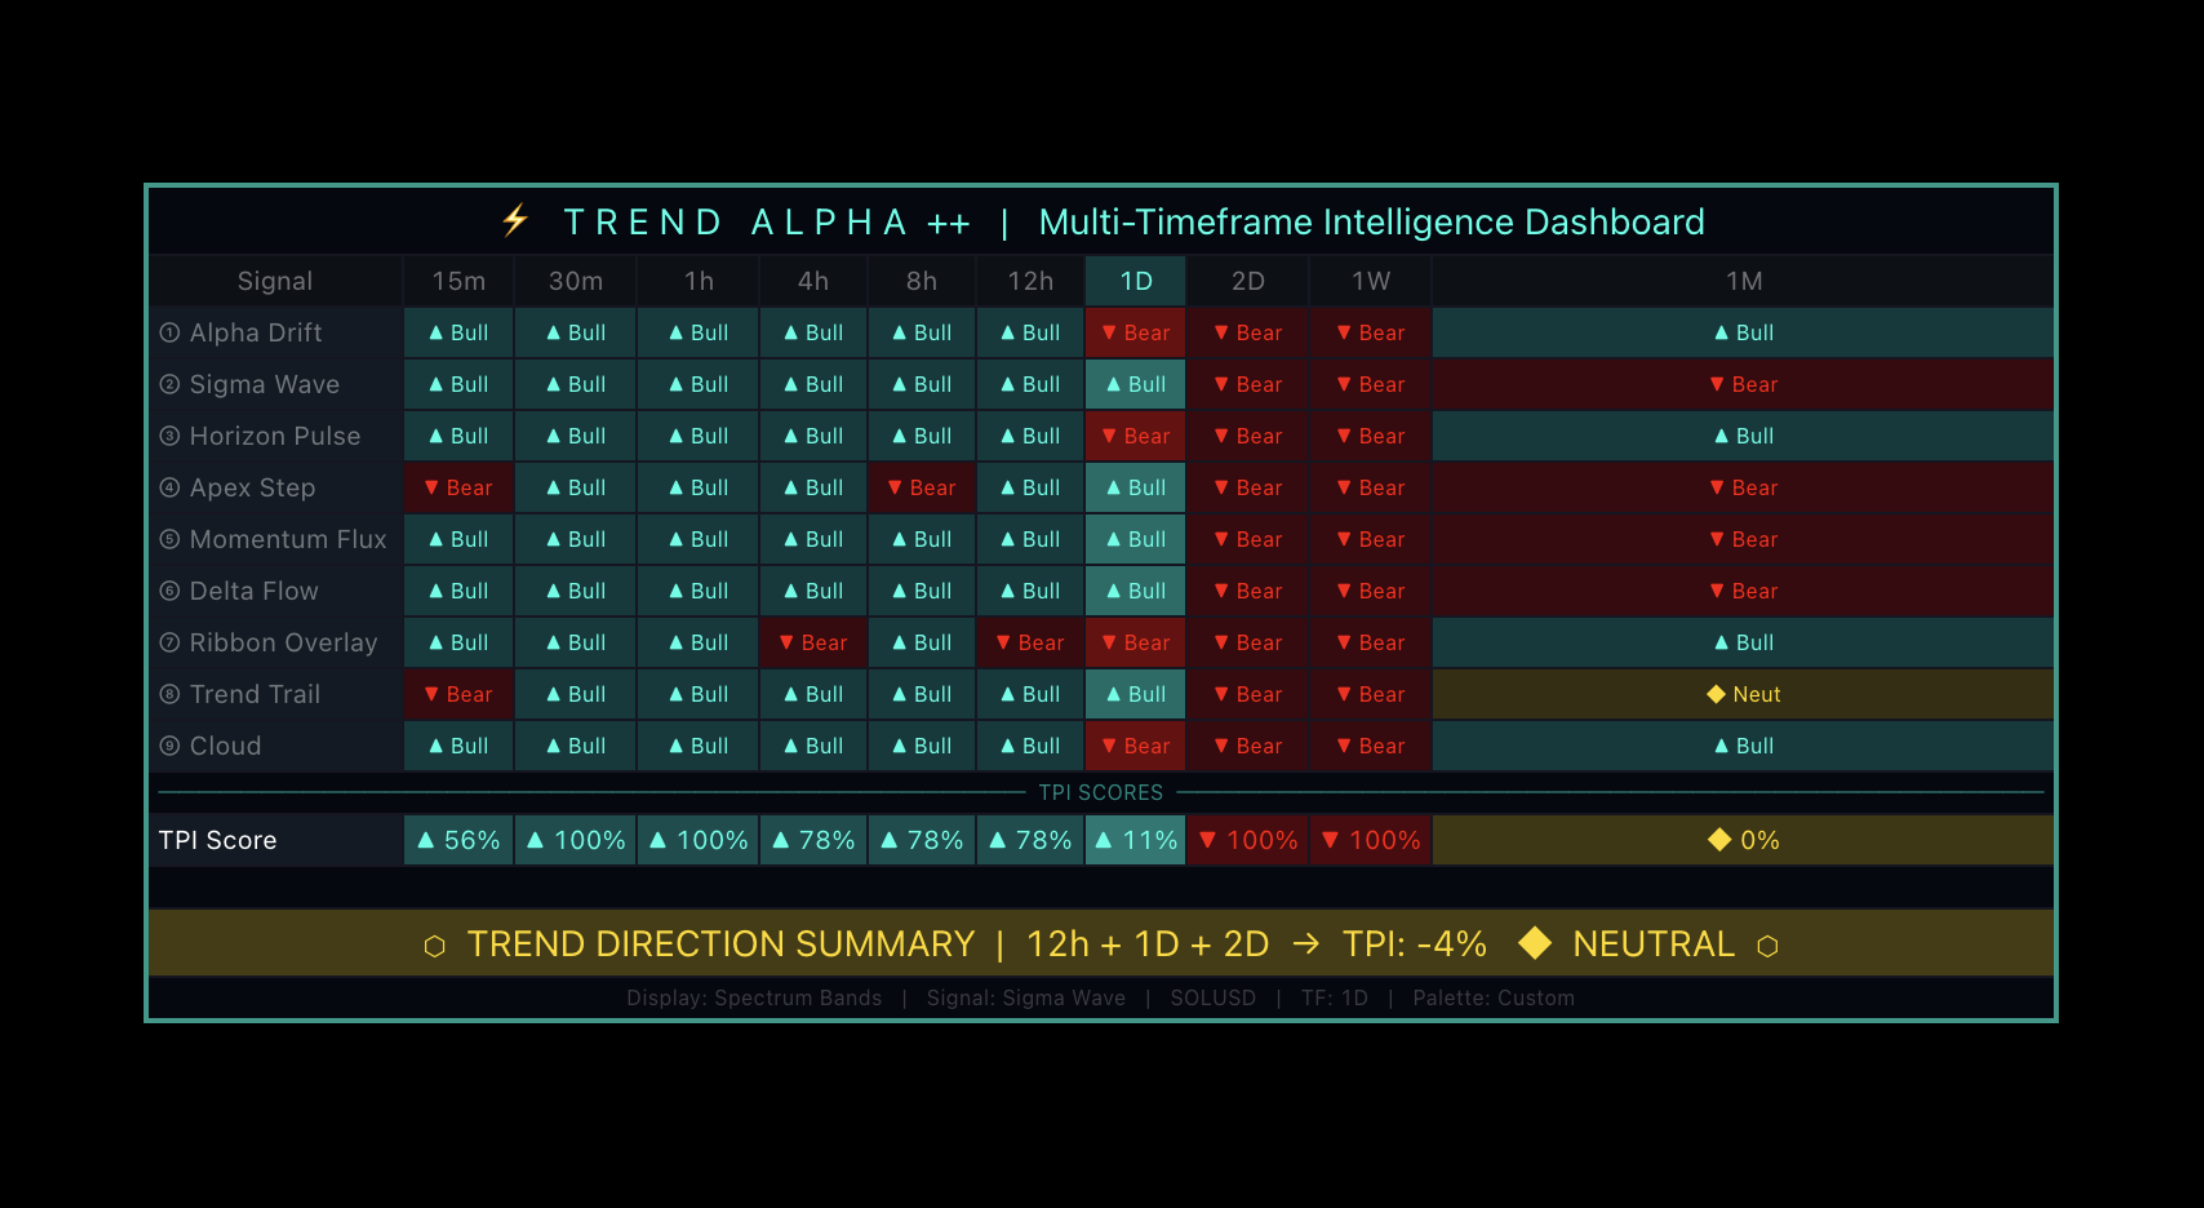
TPI Dashboard
Bullish readings favor Longs, bearish readings favor Shorts, and mixed readings mean reduce conviction.
TP / SL Workflow
Choose Swing Pivot for structure-based stops or ATR Level for volatility-based stops.
Scale out at TP1, TP2, and TP3; keep the targets ordered from nearest to furthest.
Move SL to break-even after TP1.
Use Dynamic TP with Spectrum Bands when band-based profit-taking is part of the plan.
How to Adjust the Inputs
Goal
Adjustment
Standard Daily system
Choose one Daily mode and keep its core defaults.
Lower-timeframe system
Start with Apex Step or Horizon Pulse before building Universal Trend.
Fewer Universal signals
Add one meaningful confirmation at a time.
Wider risk
Increase ATR distance or use a longer Swing Pivot lookback; reduce size so account risk stays fixed.
Earlier profit-taking
Bring TP multiples closer or enable Dynamic TP.
Cleaner chart
Hide Ribbon, Trail, Cloud, bands, or coloring unless they affect a decision.
Recommended
Best For
Advanced traders, developers, and system builders.
Recommended Setup
Choose or combine trend engines in Universal Trend, then test one configuration at a time.
Why
Trend Alpha can be shaped into many different trend systems instead of forcing one fixed workflow.
Trend
Oracle Metrics +
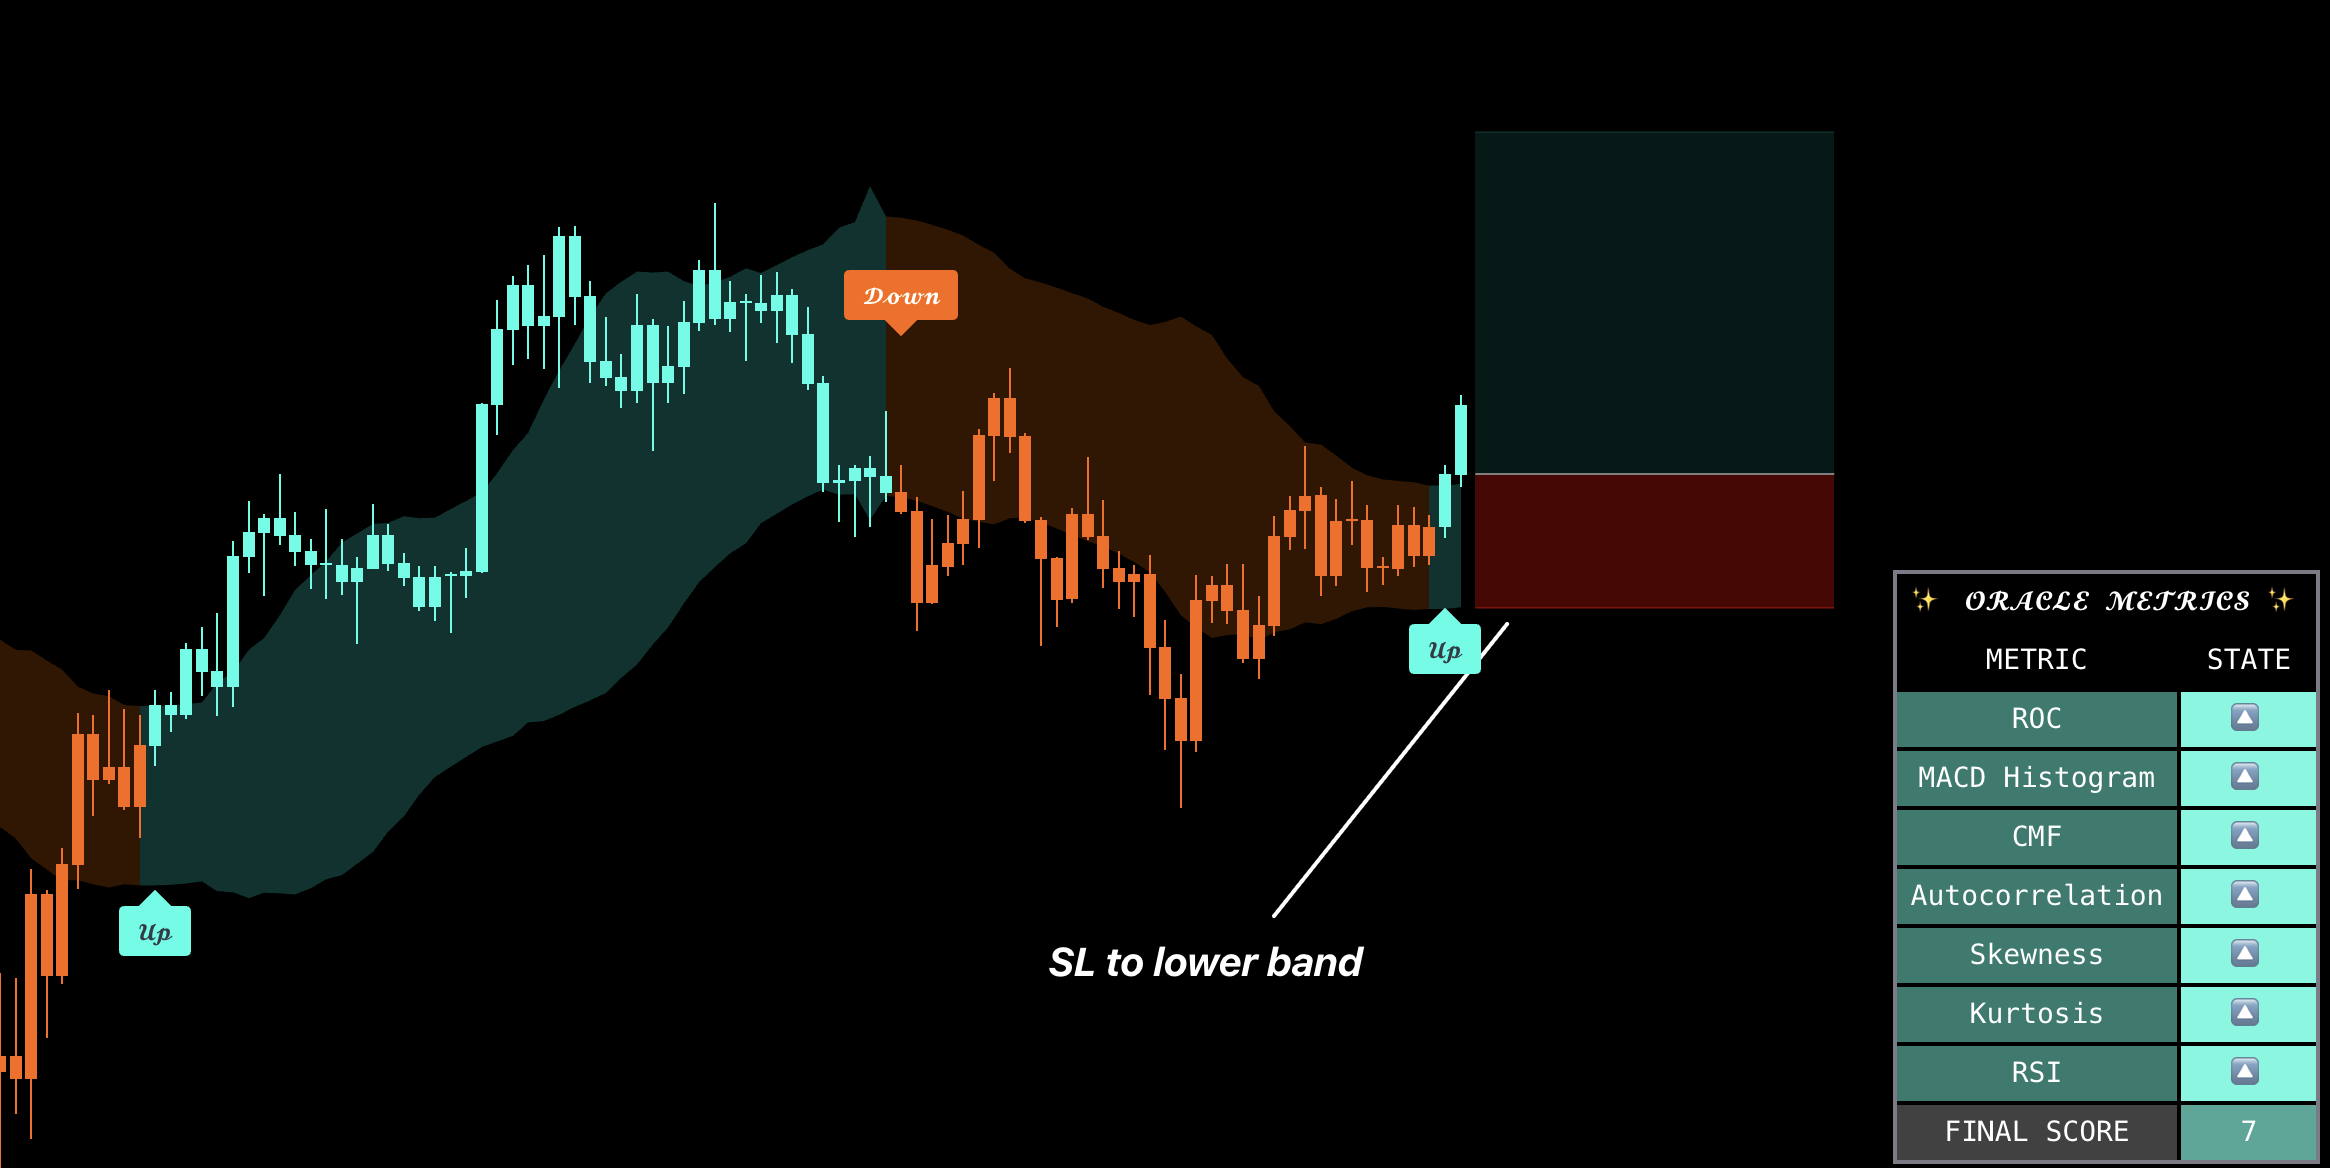
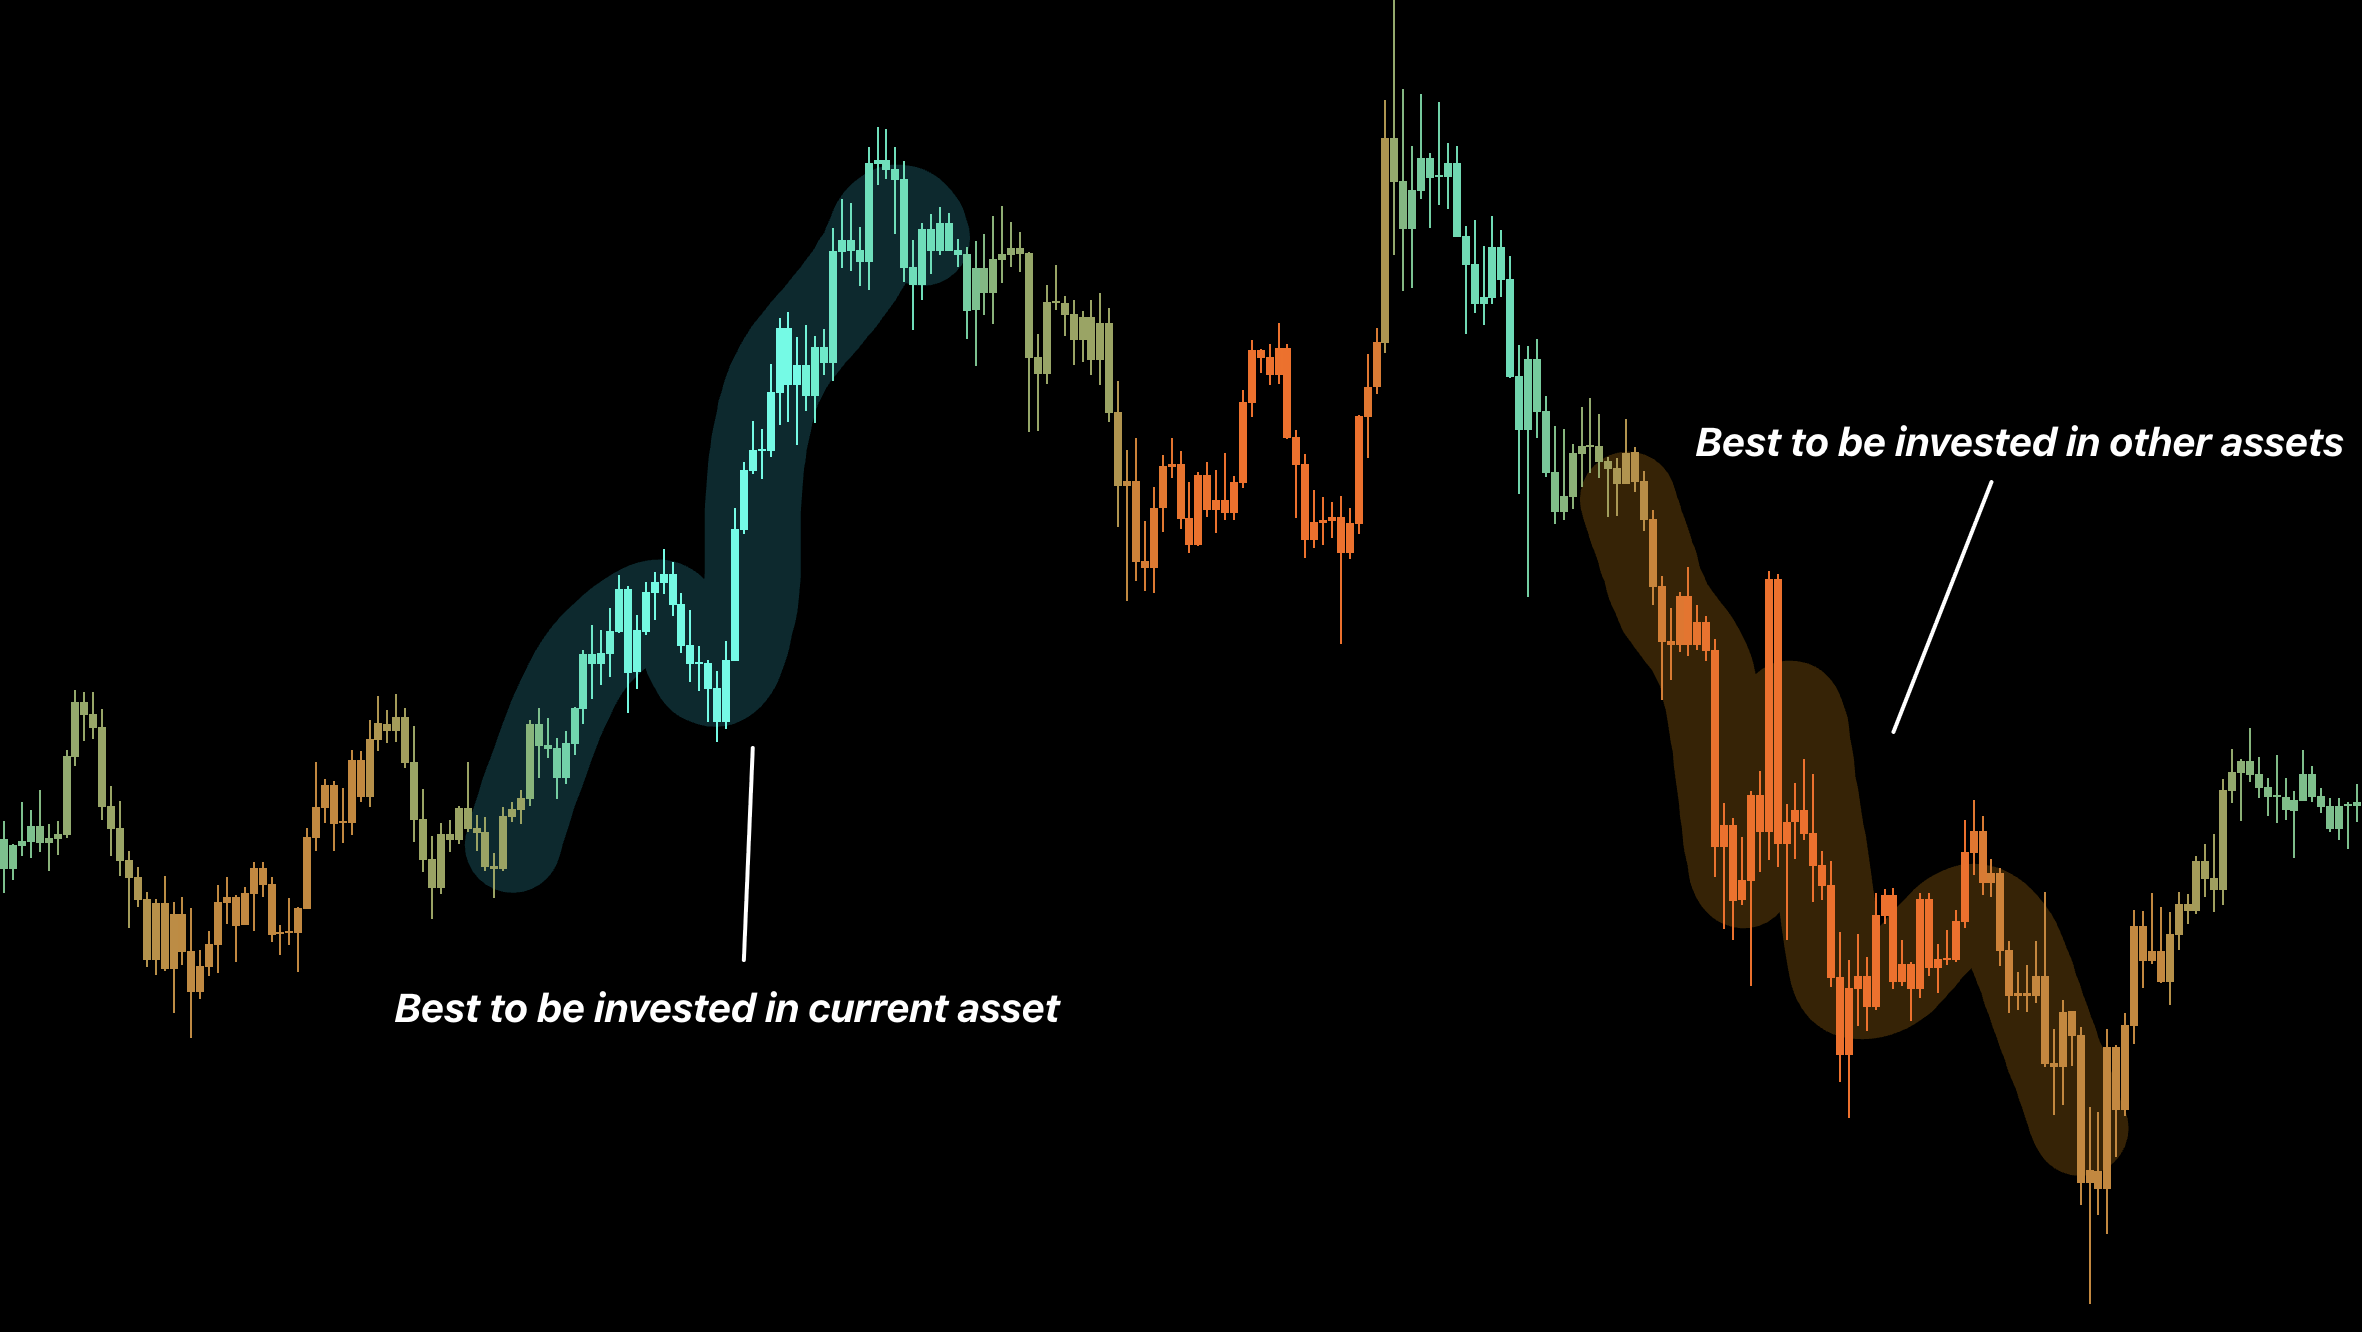
Use trend direction and the metrics table together to decide whether a move deserves conviction.
Introduction
Oracle is a confirmation workflow: the trend system supplies direction, while the table shows whether the move has broad support.
How to Use
1
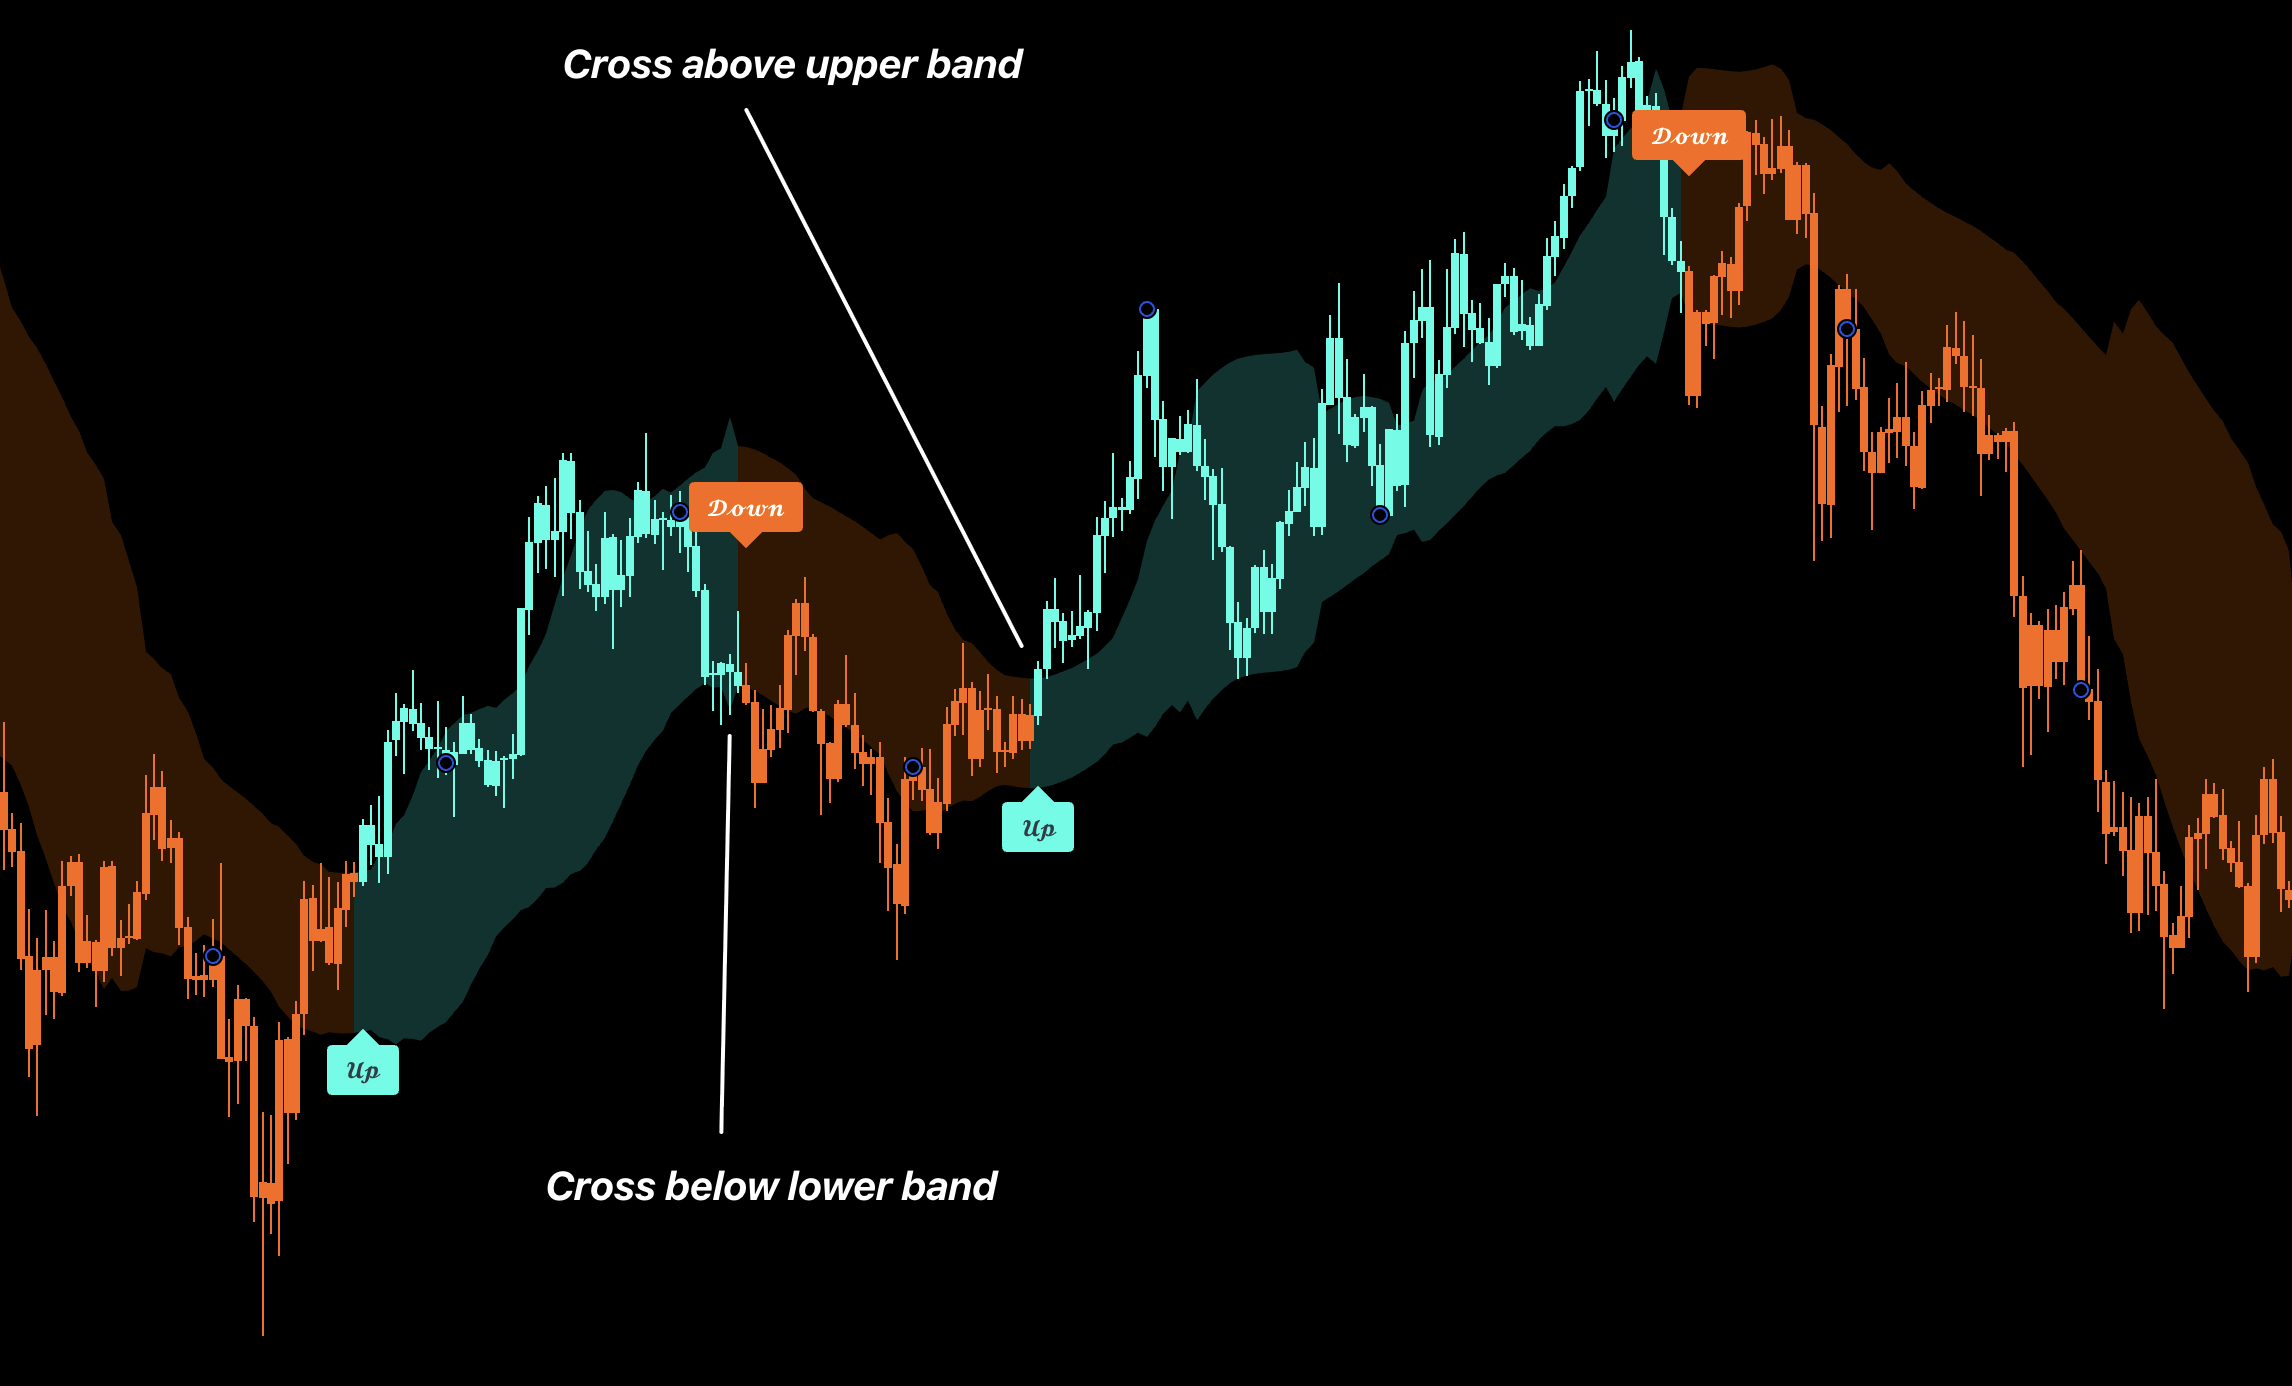
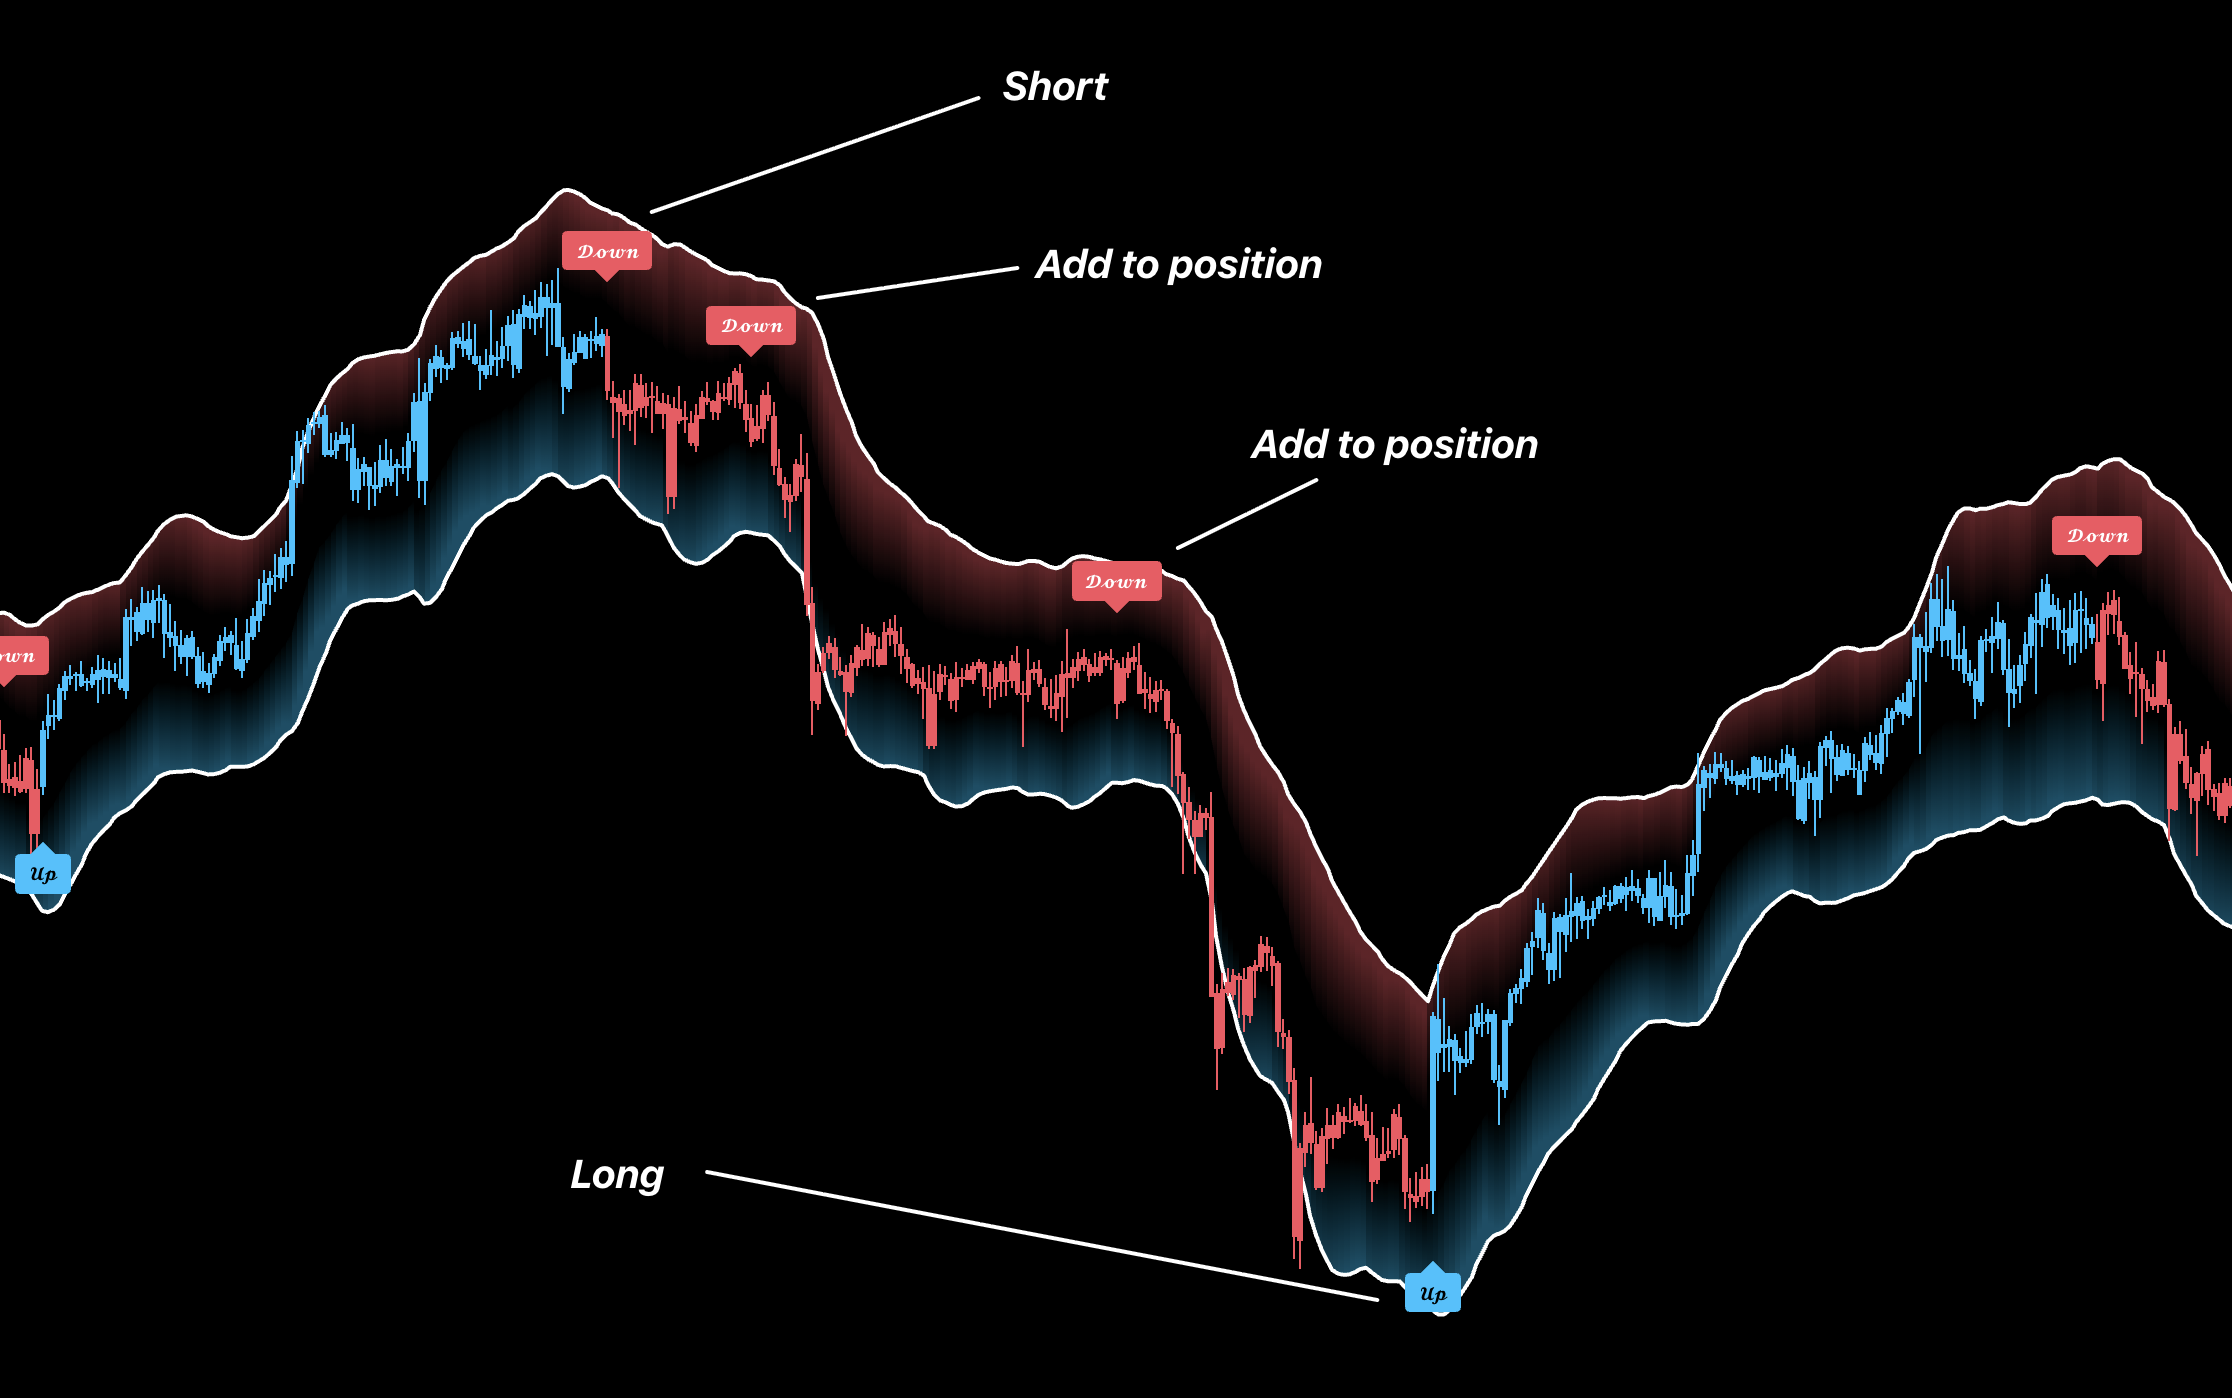
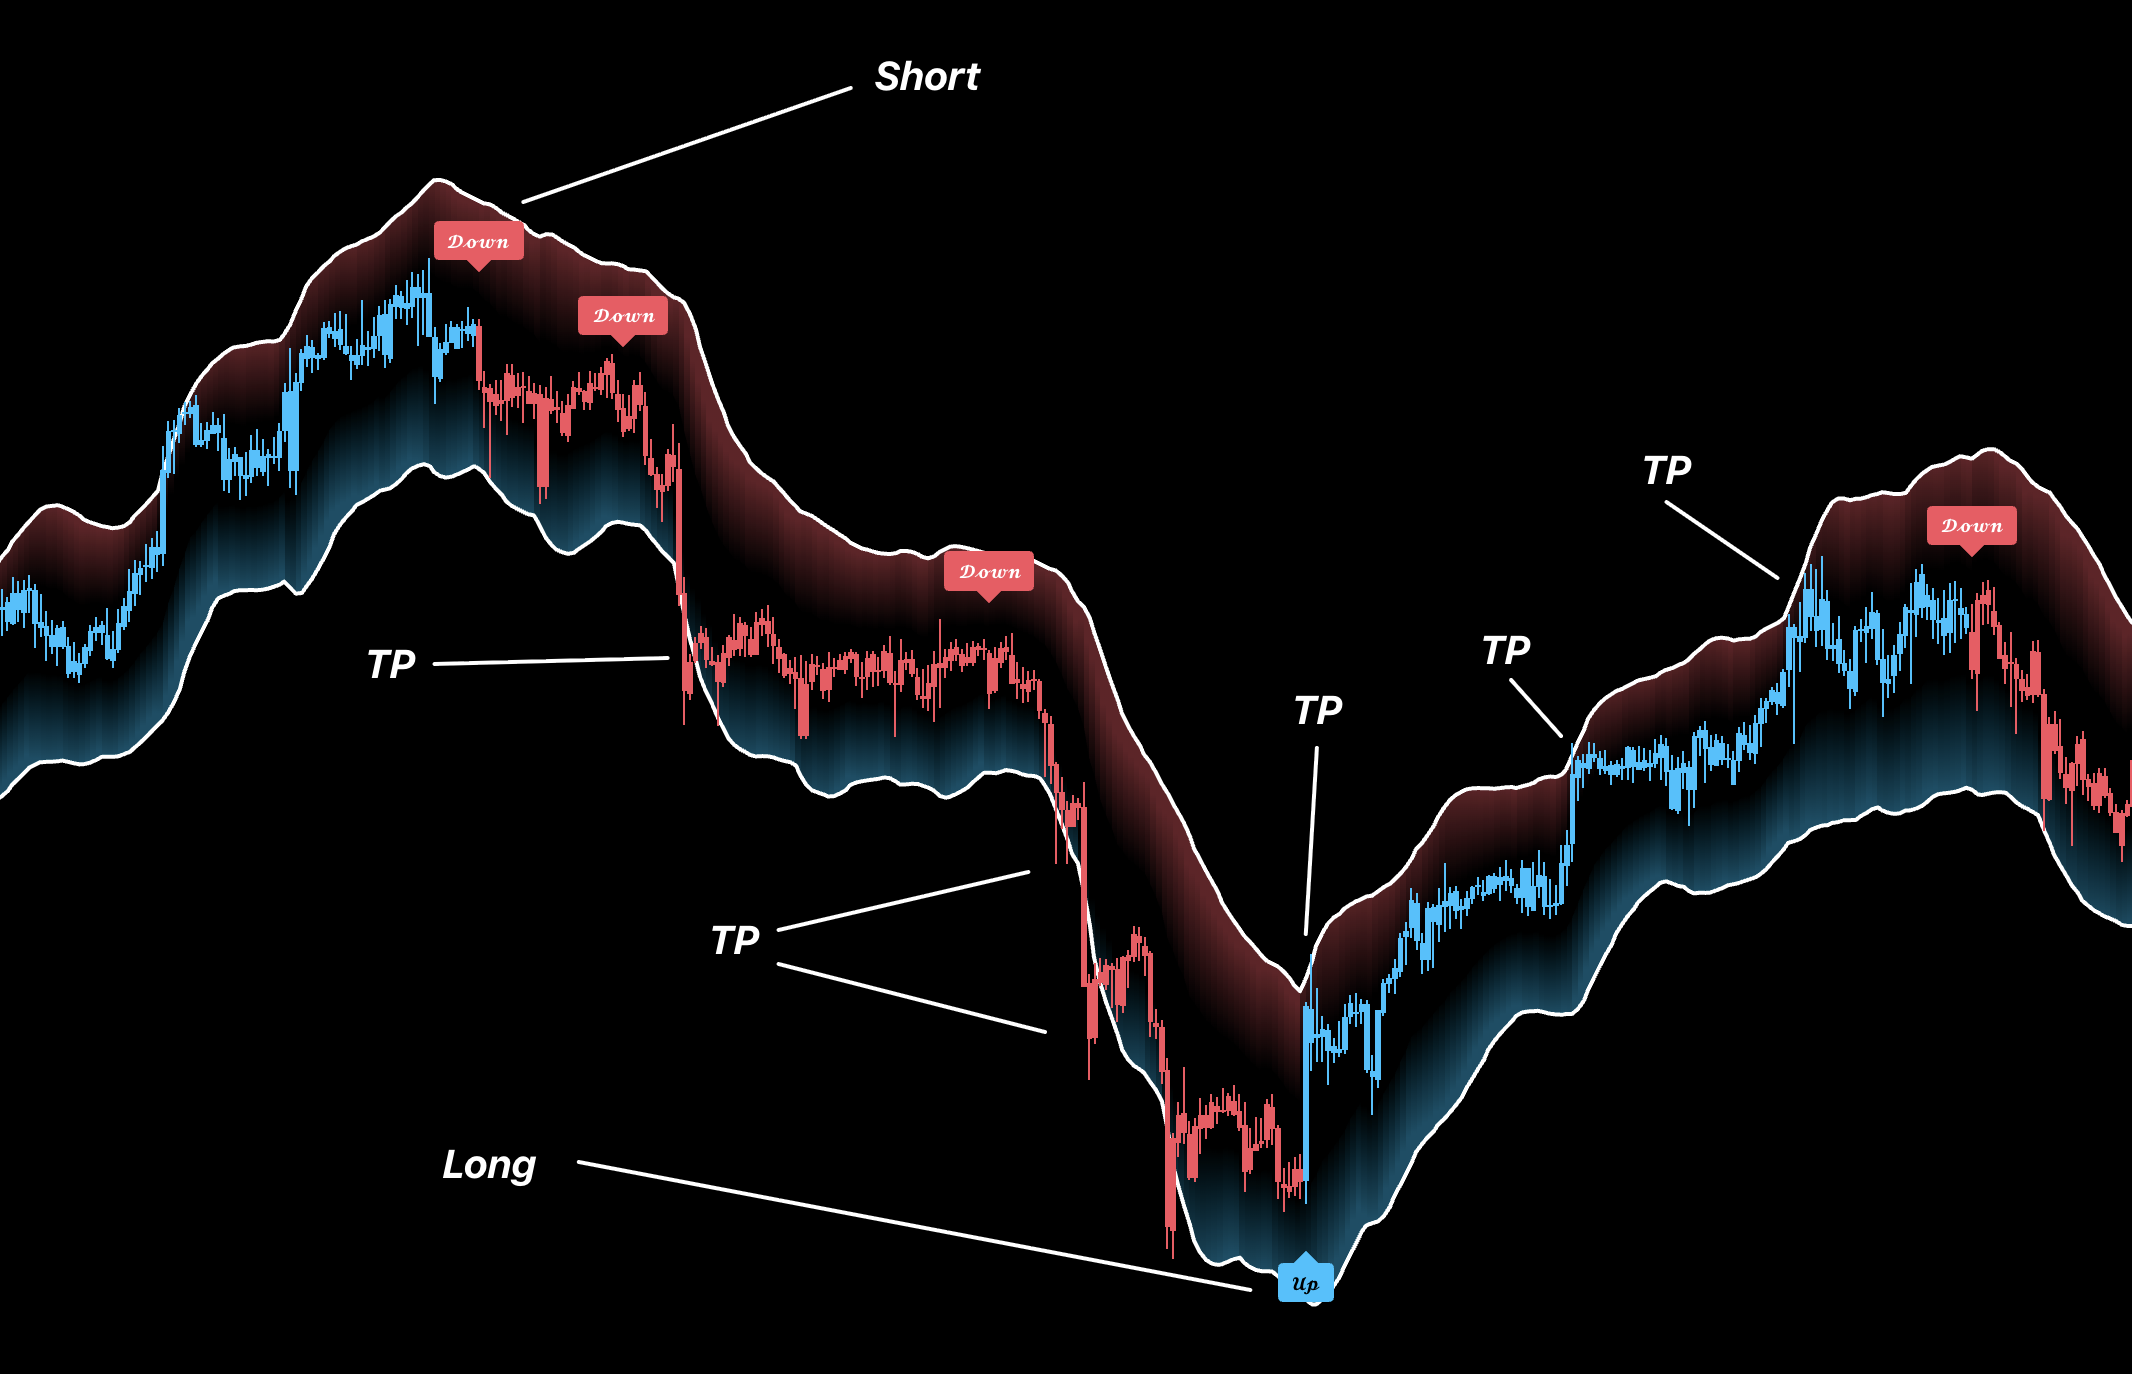
Read the trend. An Up shift favors Longs; a Down shift favors Shorts.
2
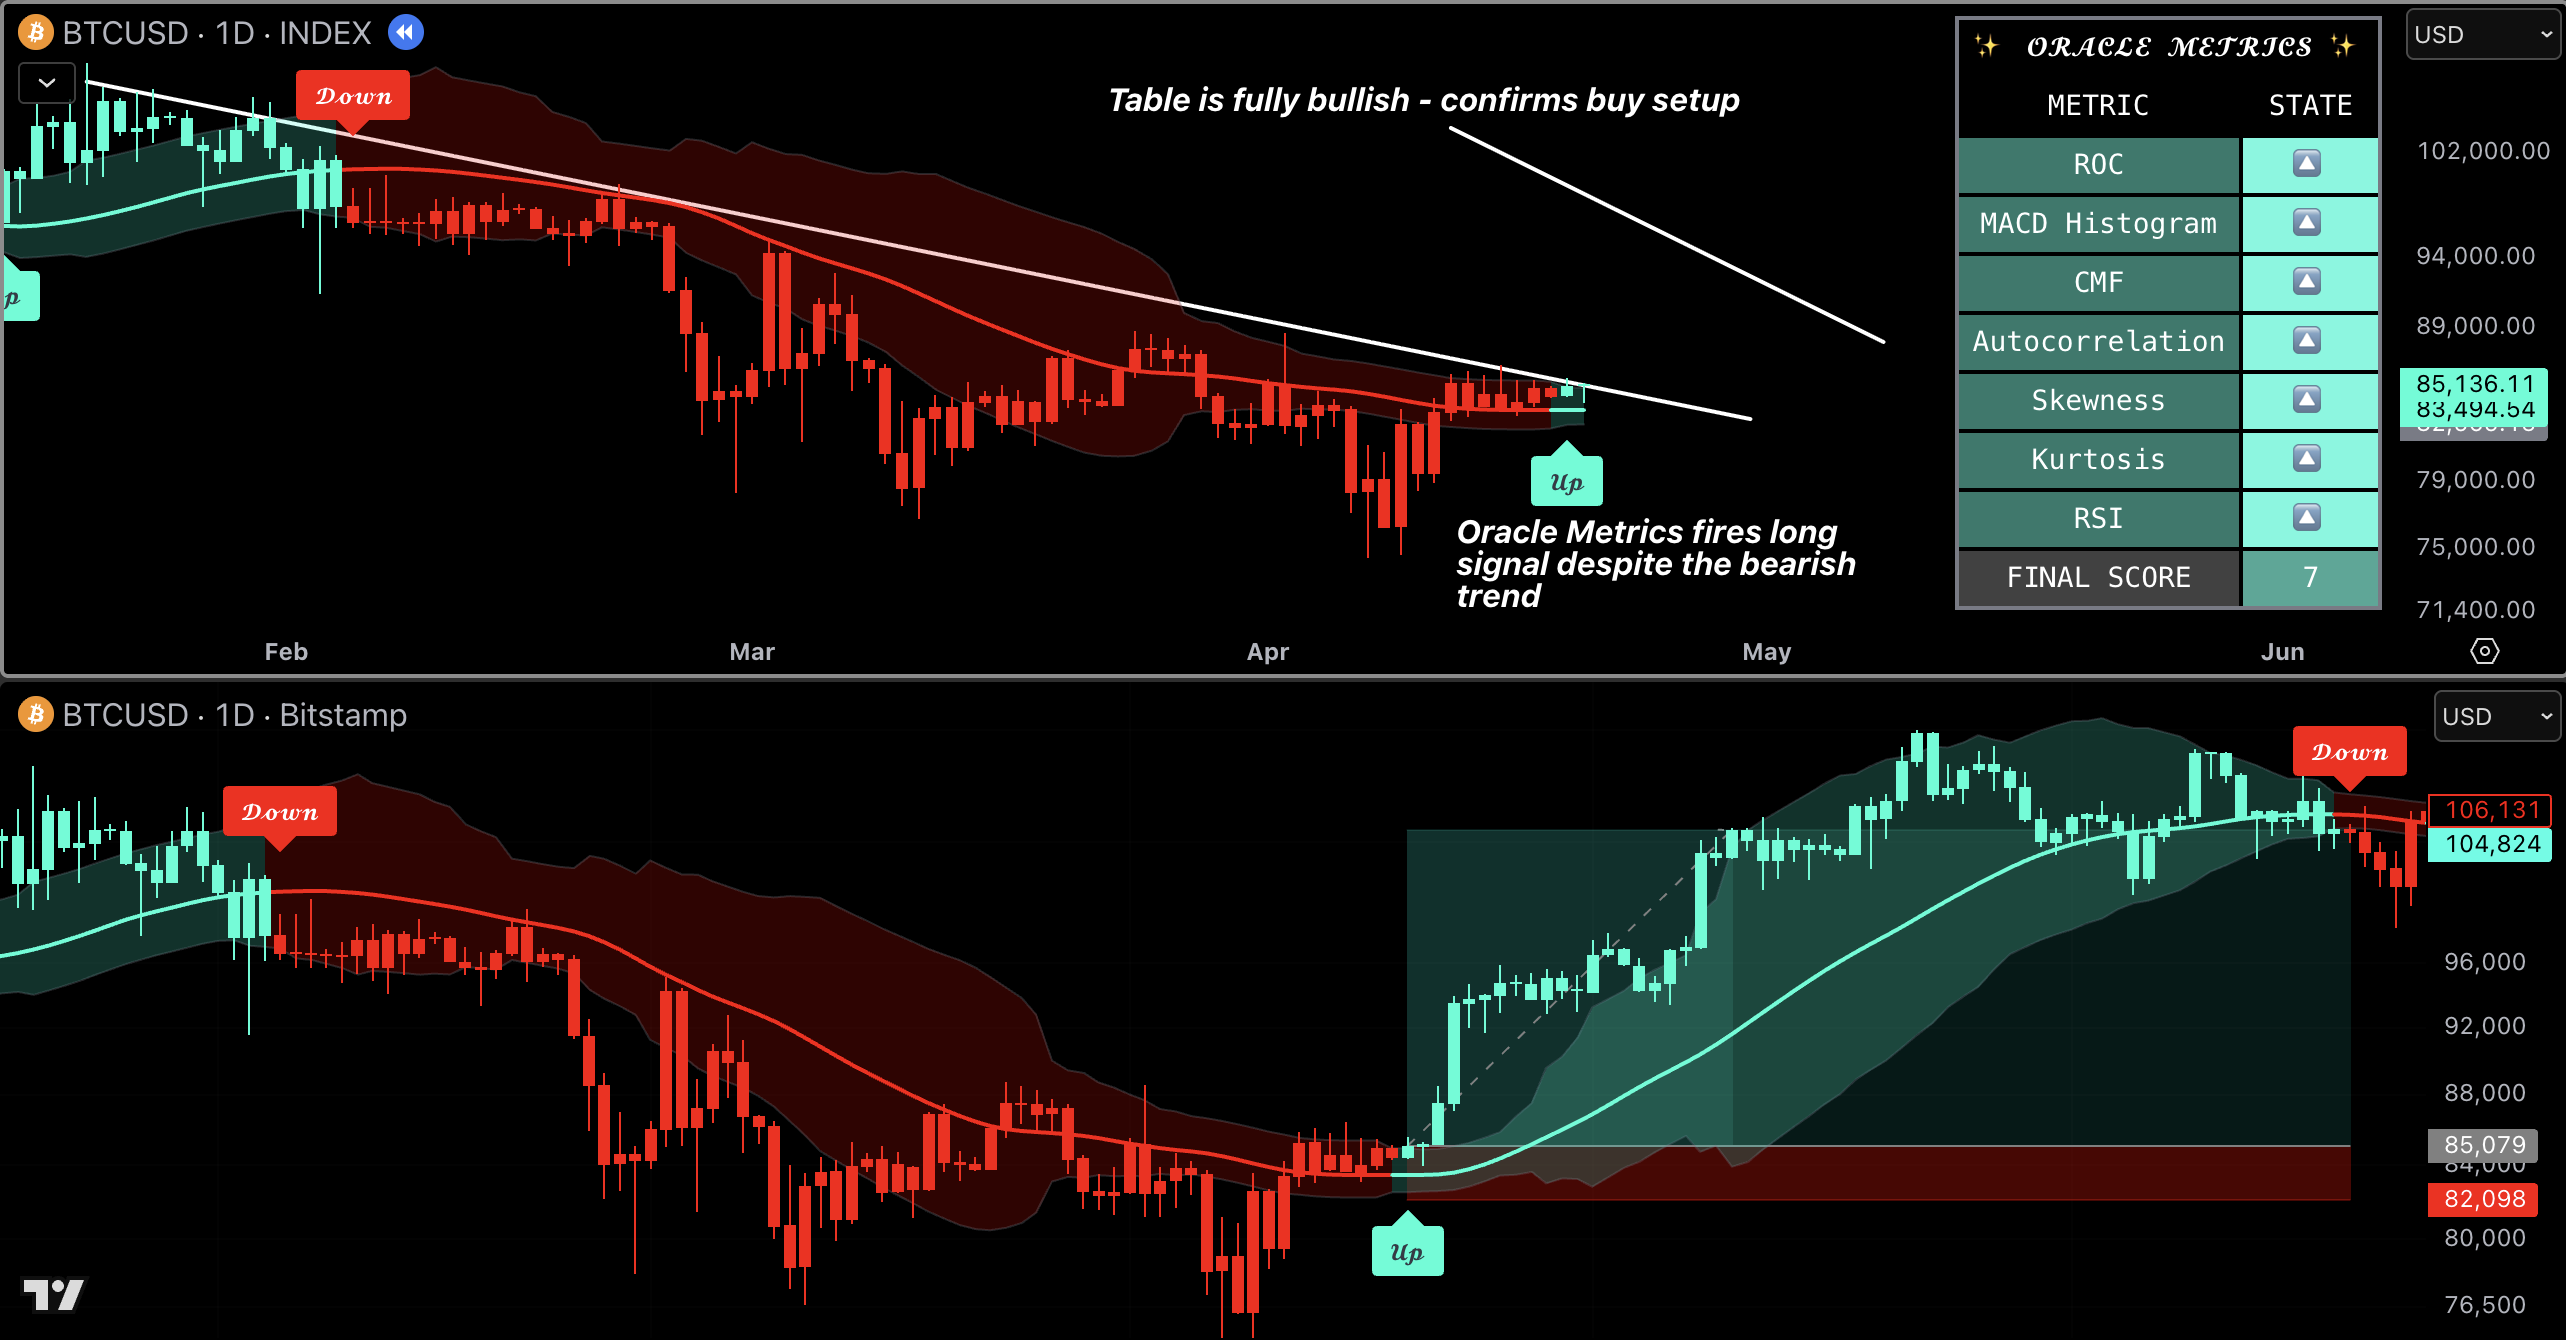
Check the final table score. Positive supports Longs, negative supports Shorts, and neutral means wait or reduce size.
3
Require agreement. Trend and table aligned is the usable setup. Disagreement is a filter, not a reason to force the opposite trade.
4
Monitor open trades. If the table weakens before the trend flips, protect profit or reduce conviction.
Features
Trend System
Use Up and Down shifts as direction; wait for table agreement before adding conviction.
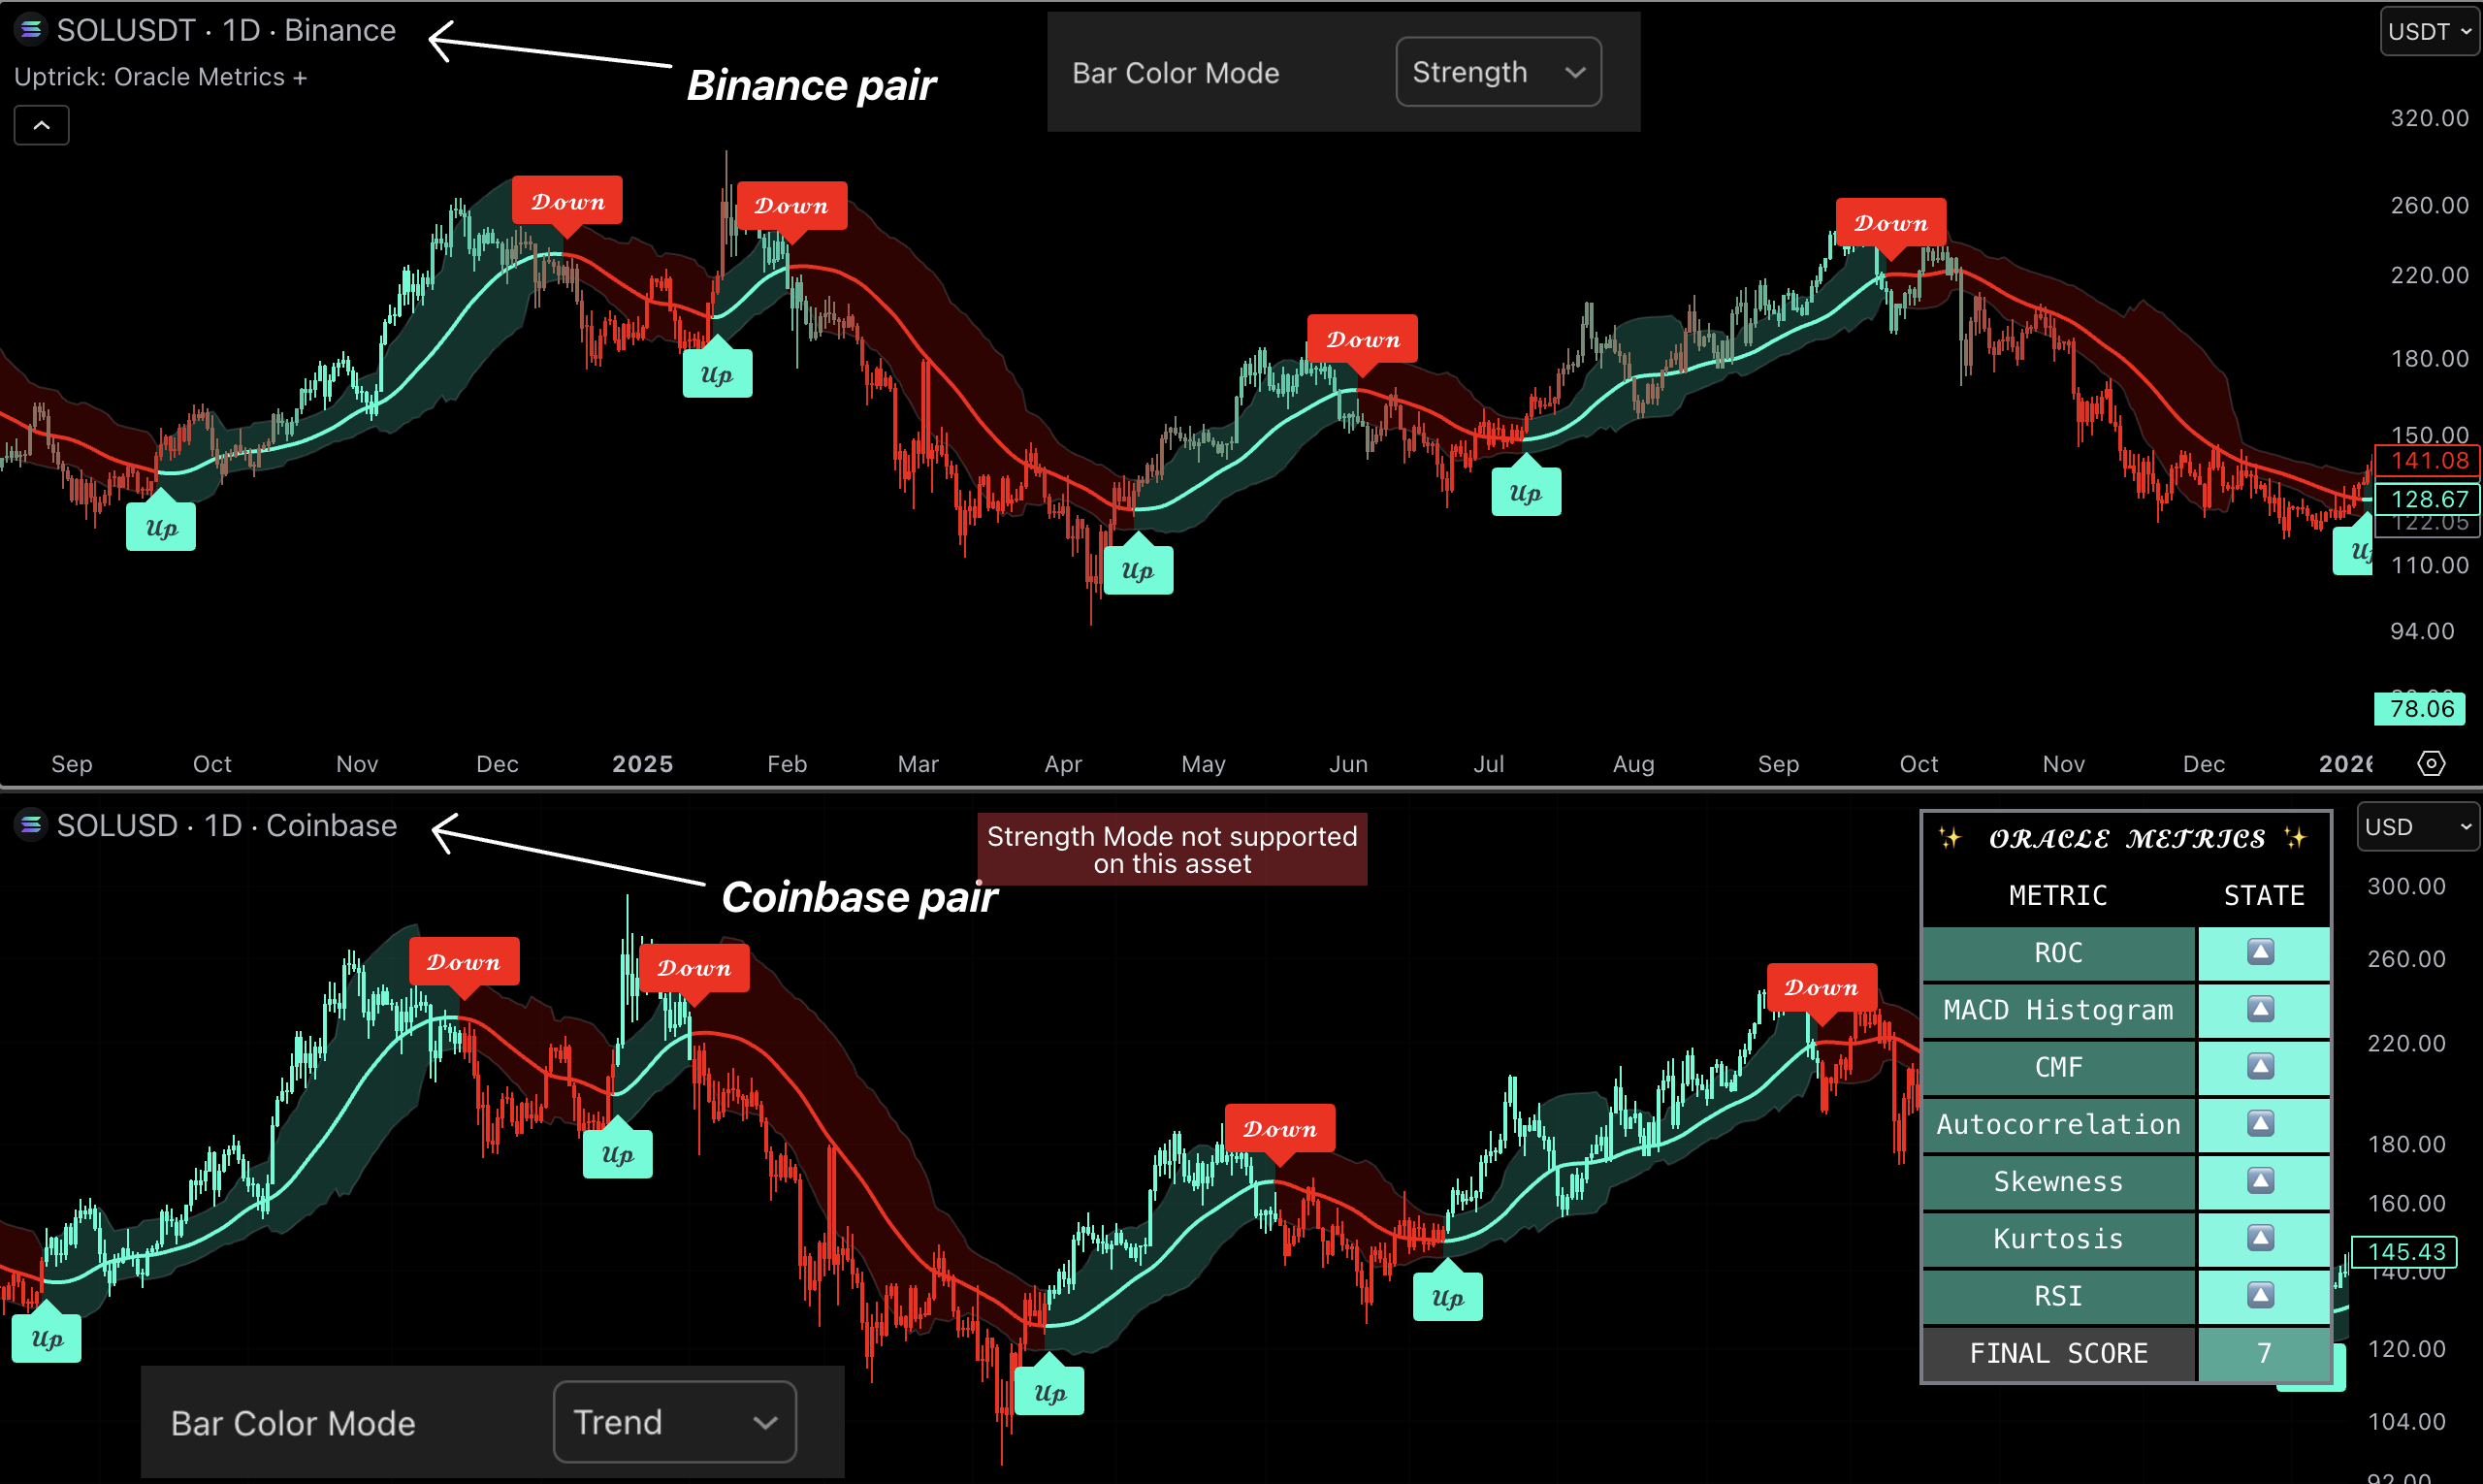
Bar Coloring
Use Trend colors on any chart. Use Strength colors only on the supported Binance major pairs.
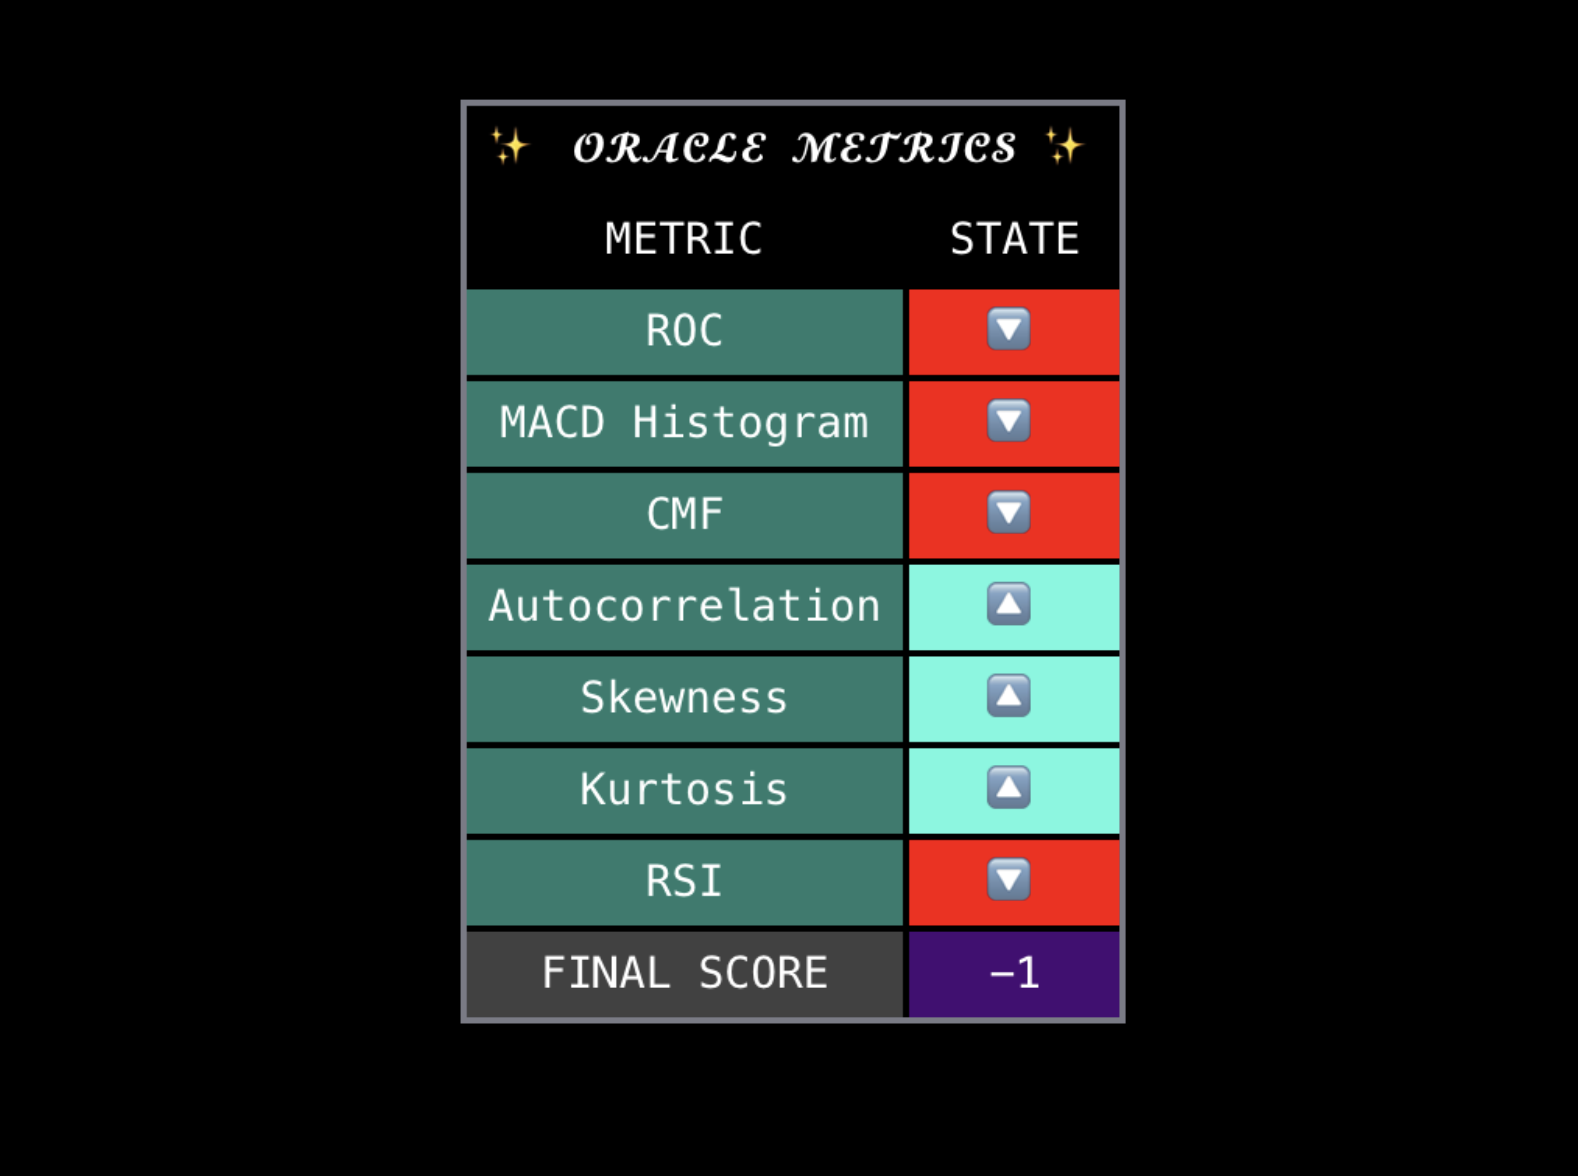
Metrics Table
Use the final score as the main confirmation and individual rows only to understand disagreement.
Input Adjustments
Keep calculation defaults while learning. Choose one bar-color mode, keep the table visible when it affects decisions, and adjust only table position or visibility for readability.
ℹStrength Mode is limited to its supported Binance pairs; use Trend Mode elsewhere.
Recommended
Best For
Major-asset trading and strength confirmation.
Recommended Setup
Use another trend indicator for the setup, then require Oracle direction and metrics to support it.
Why
Oracle is strongest as a confluence filter that shows whether a major's trend has internal strength.
Signals
Trading Signals Suite
Build a simple trend or range workflow from signals, bias, structure, and managed exits.
Introduction
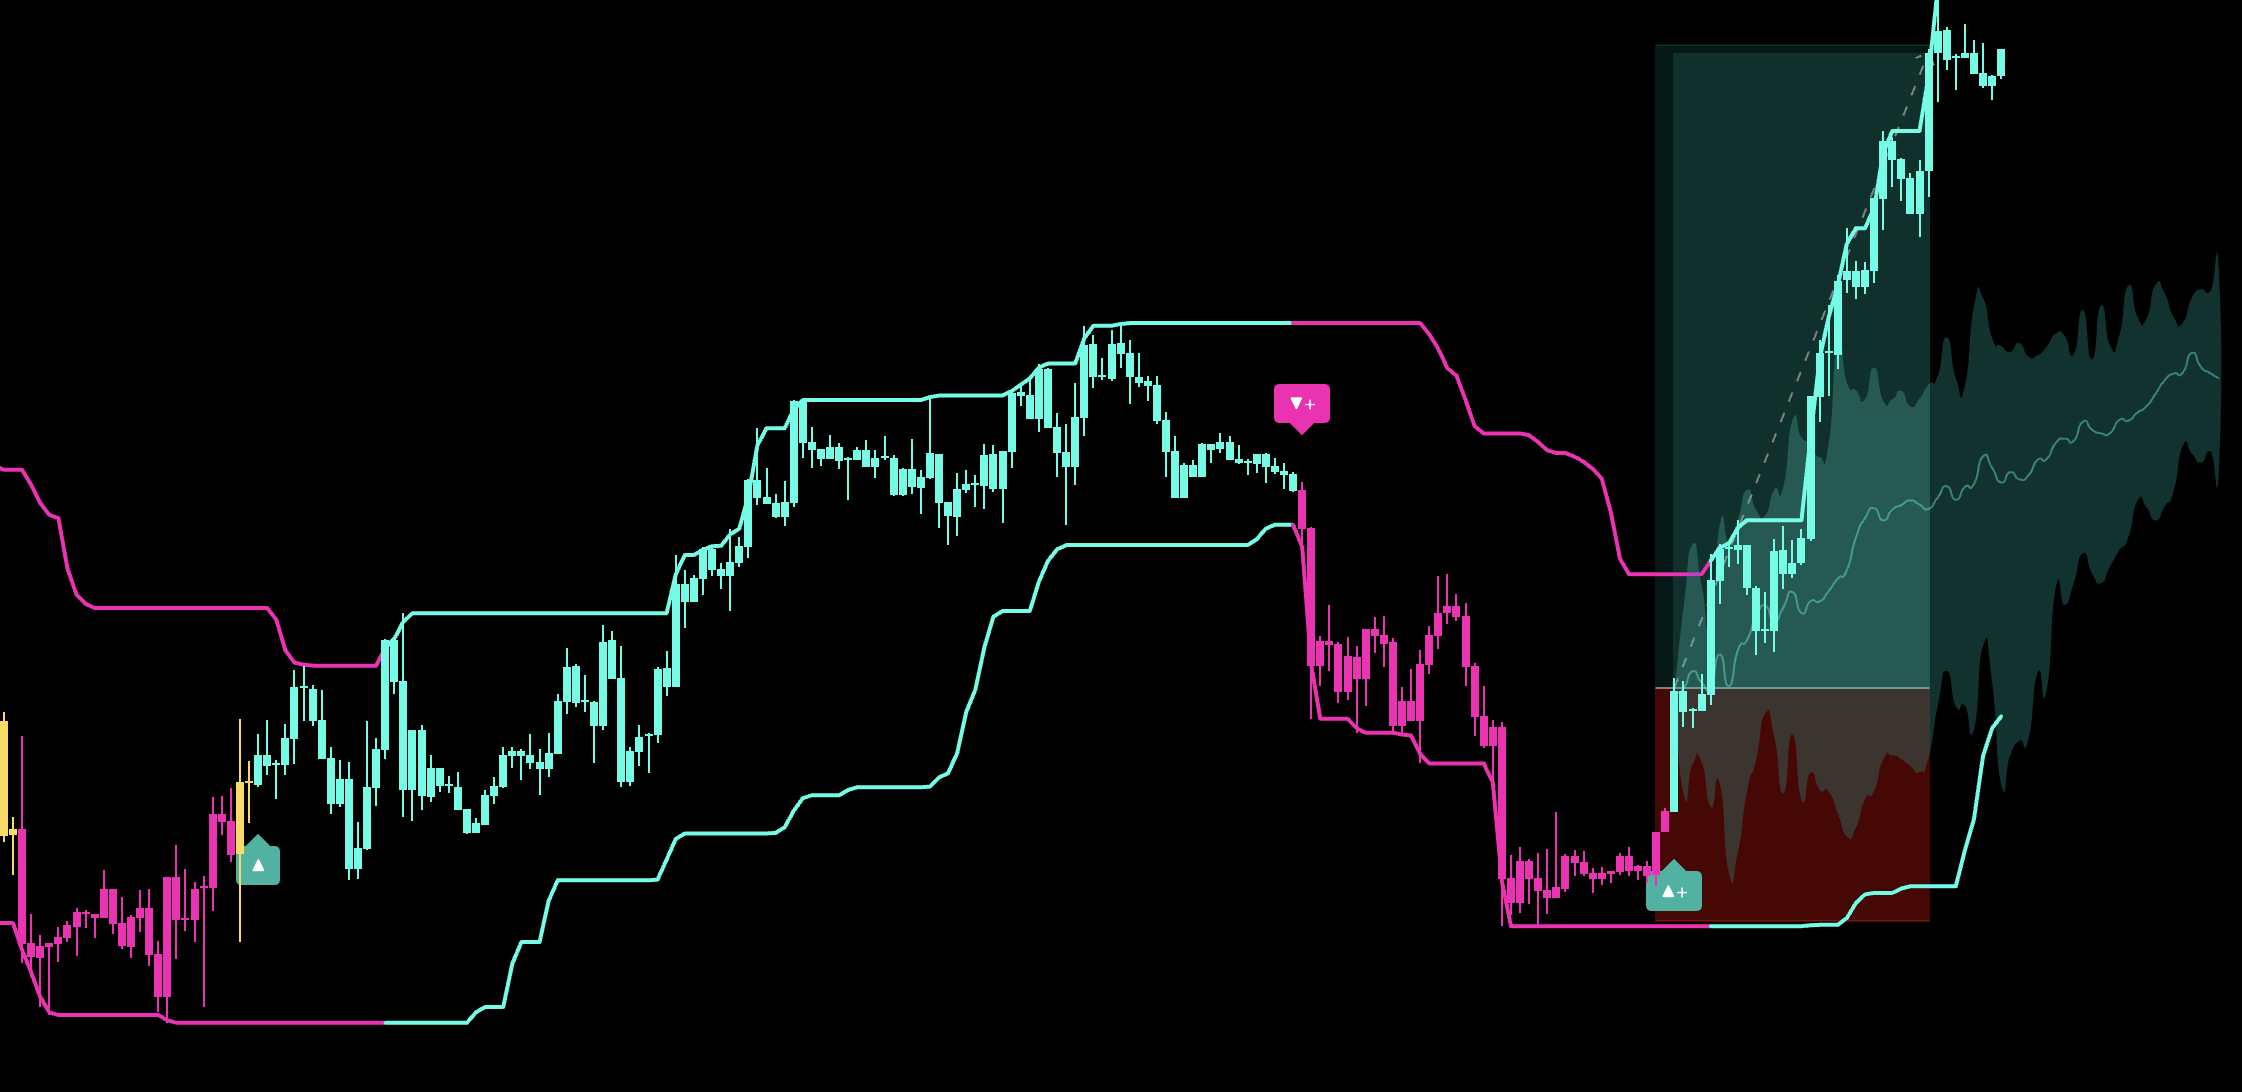
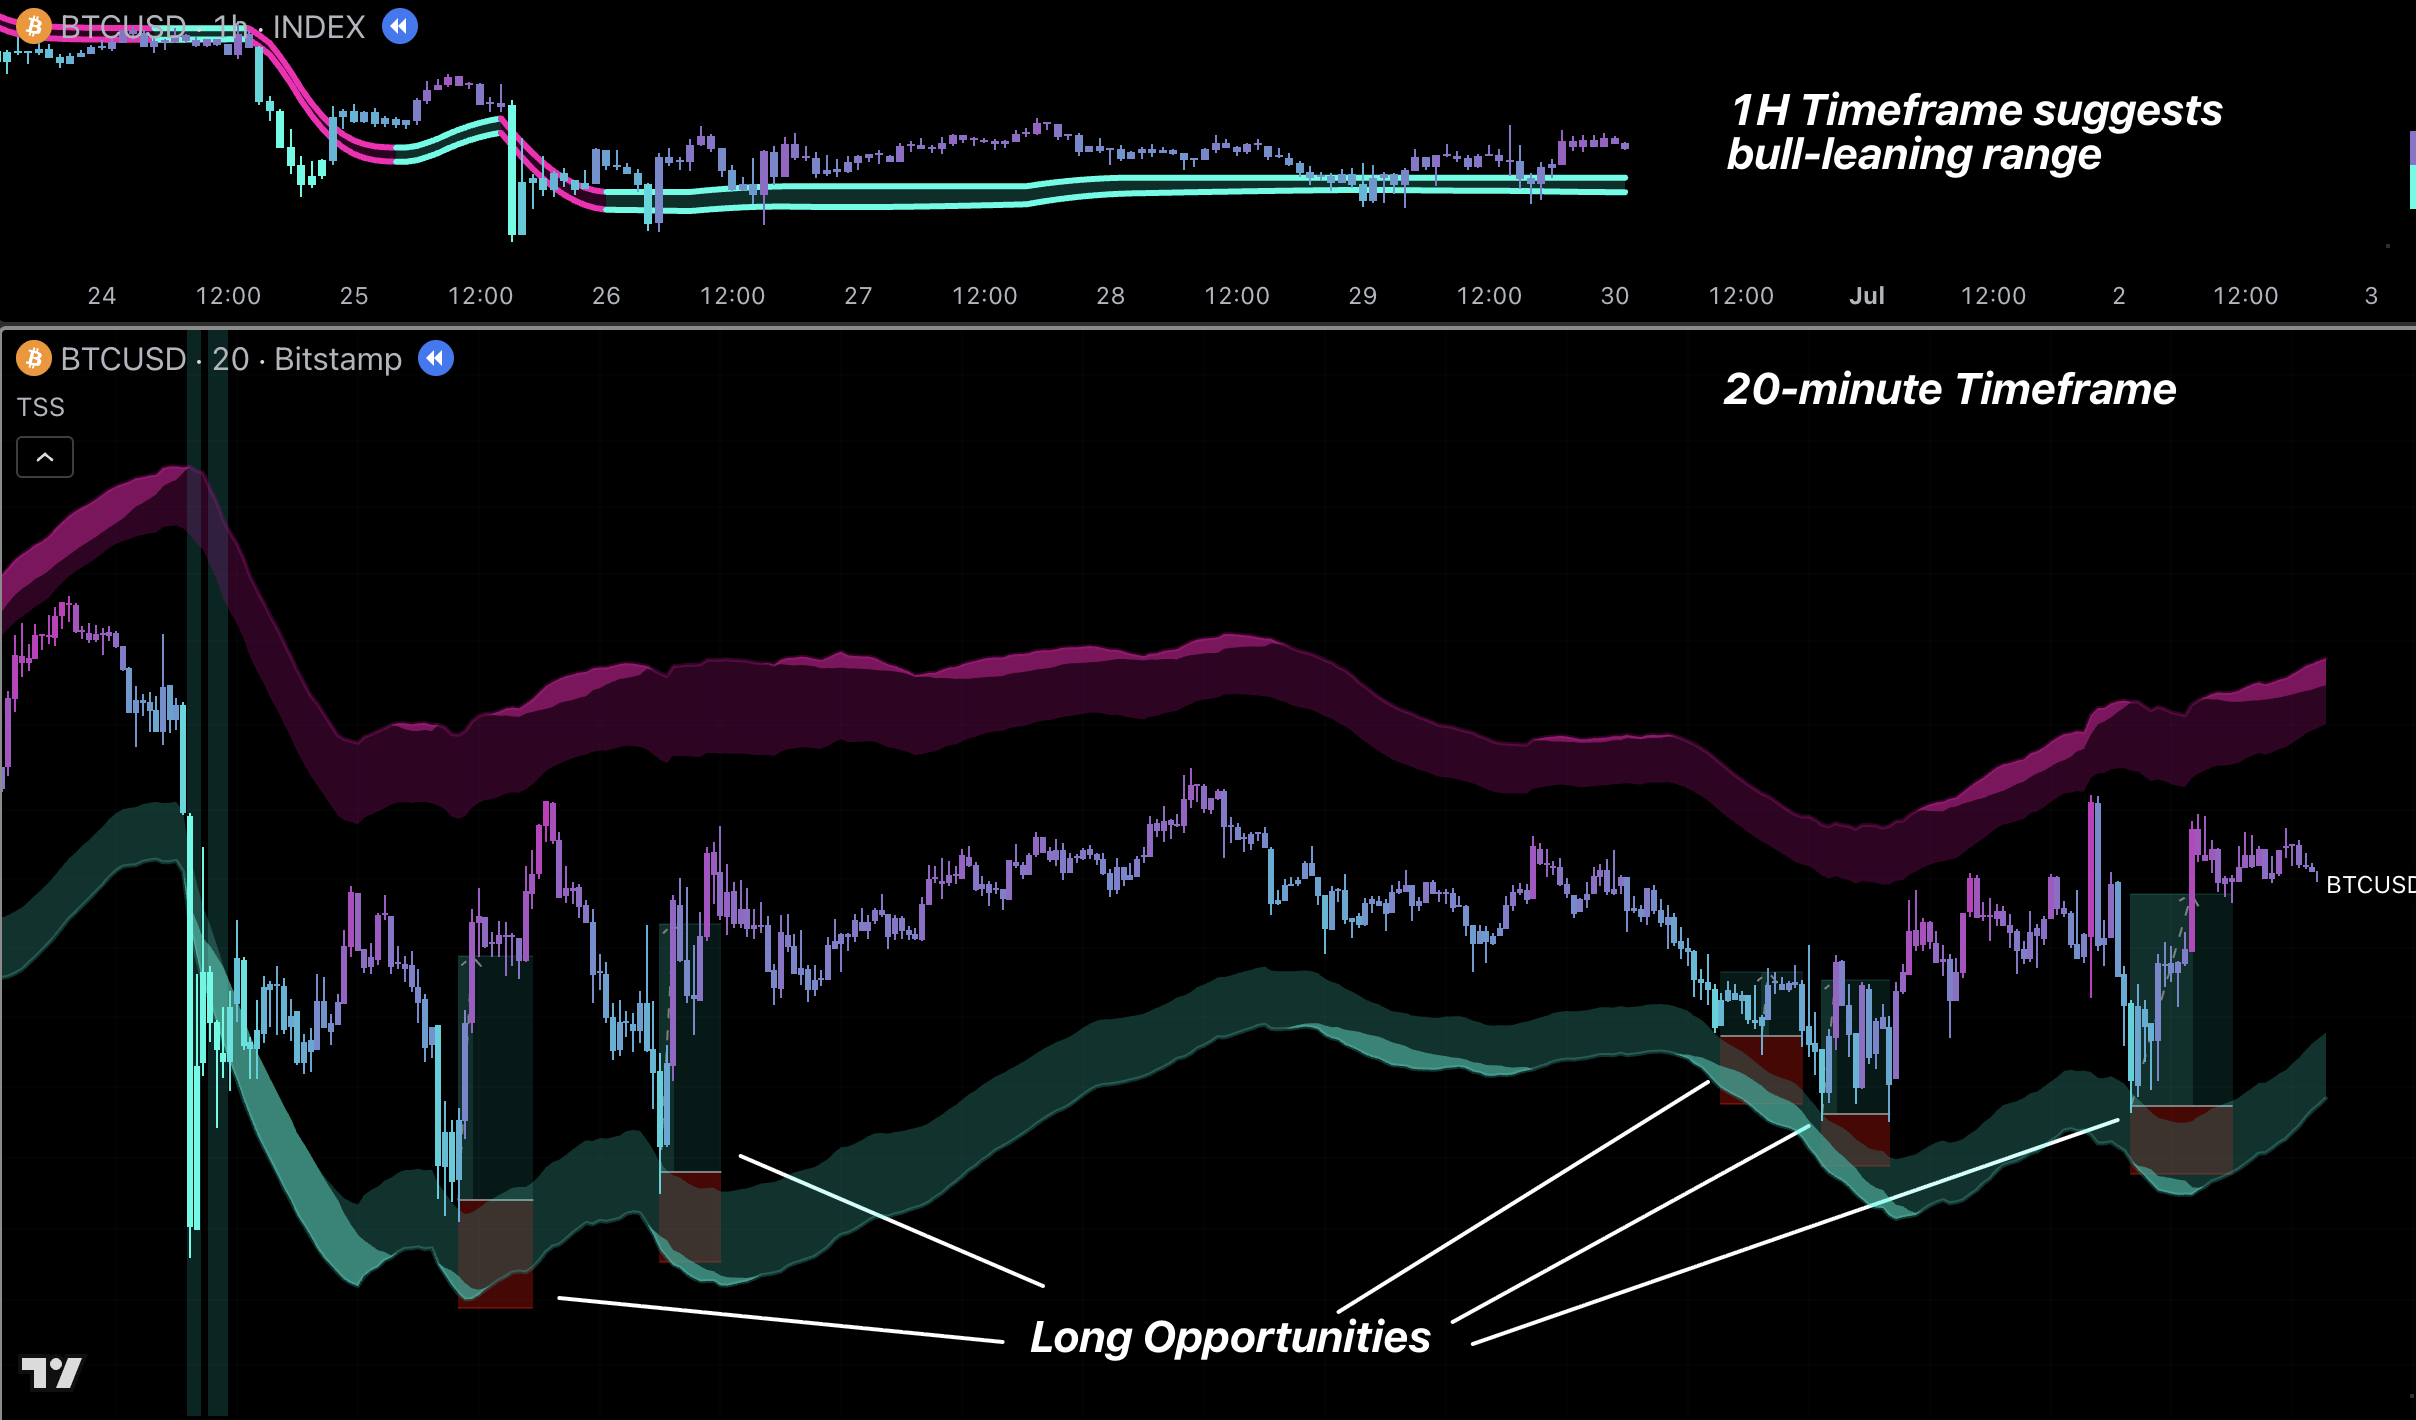
TSS has many optional tools, but a usable setup needs only a signal, one bias filter, one risk reference, and the TP/SL plan. Do not enable every feature as a mandatory confirmation.
How to Use
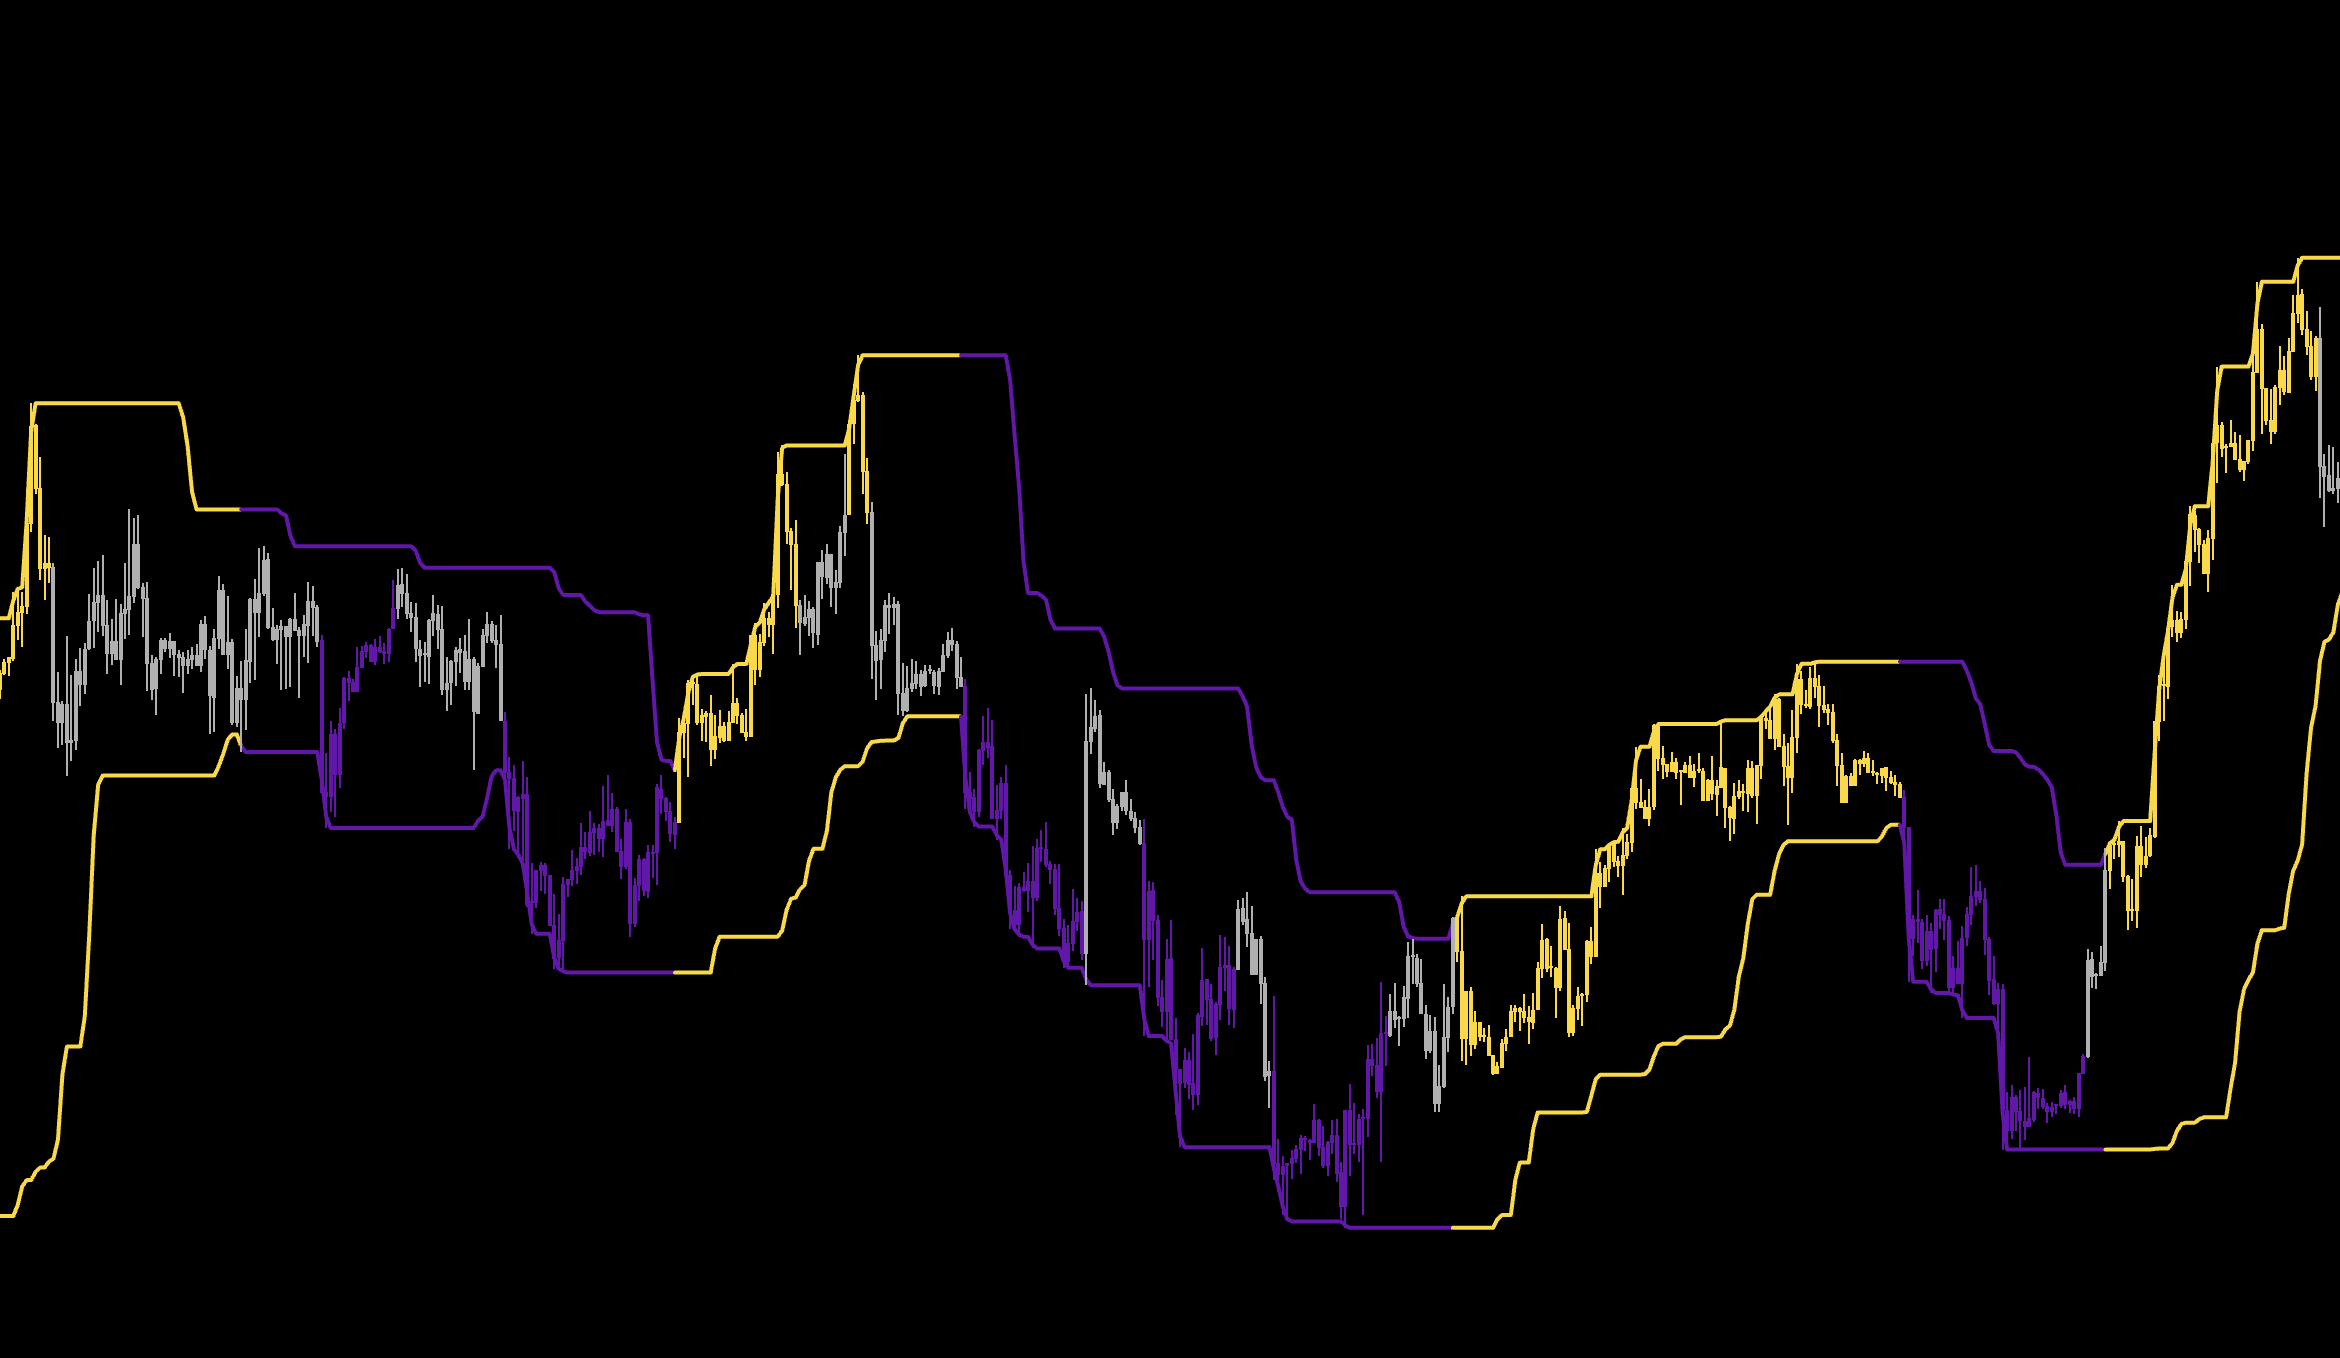
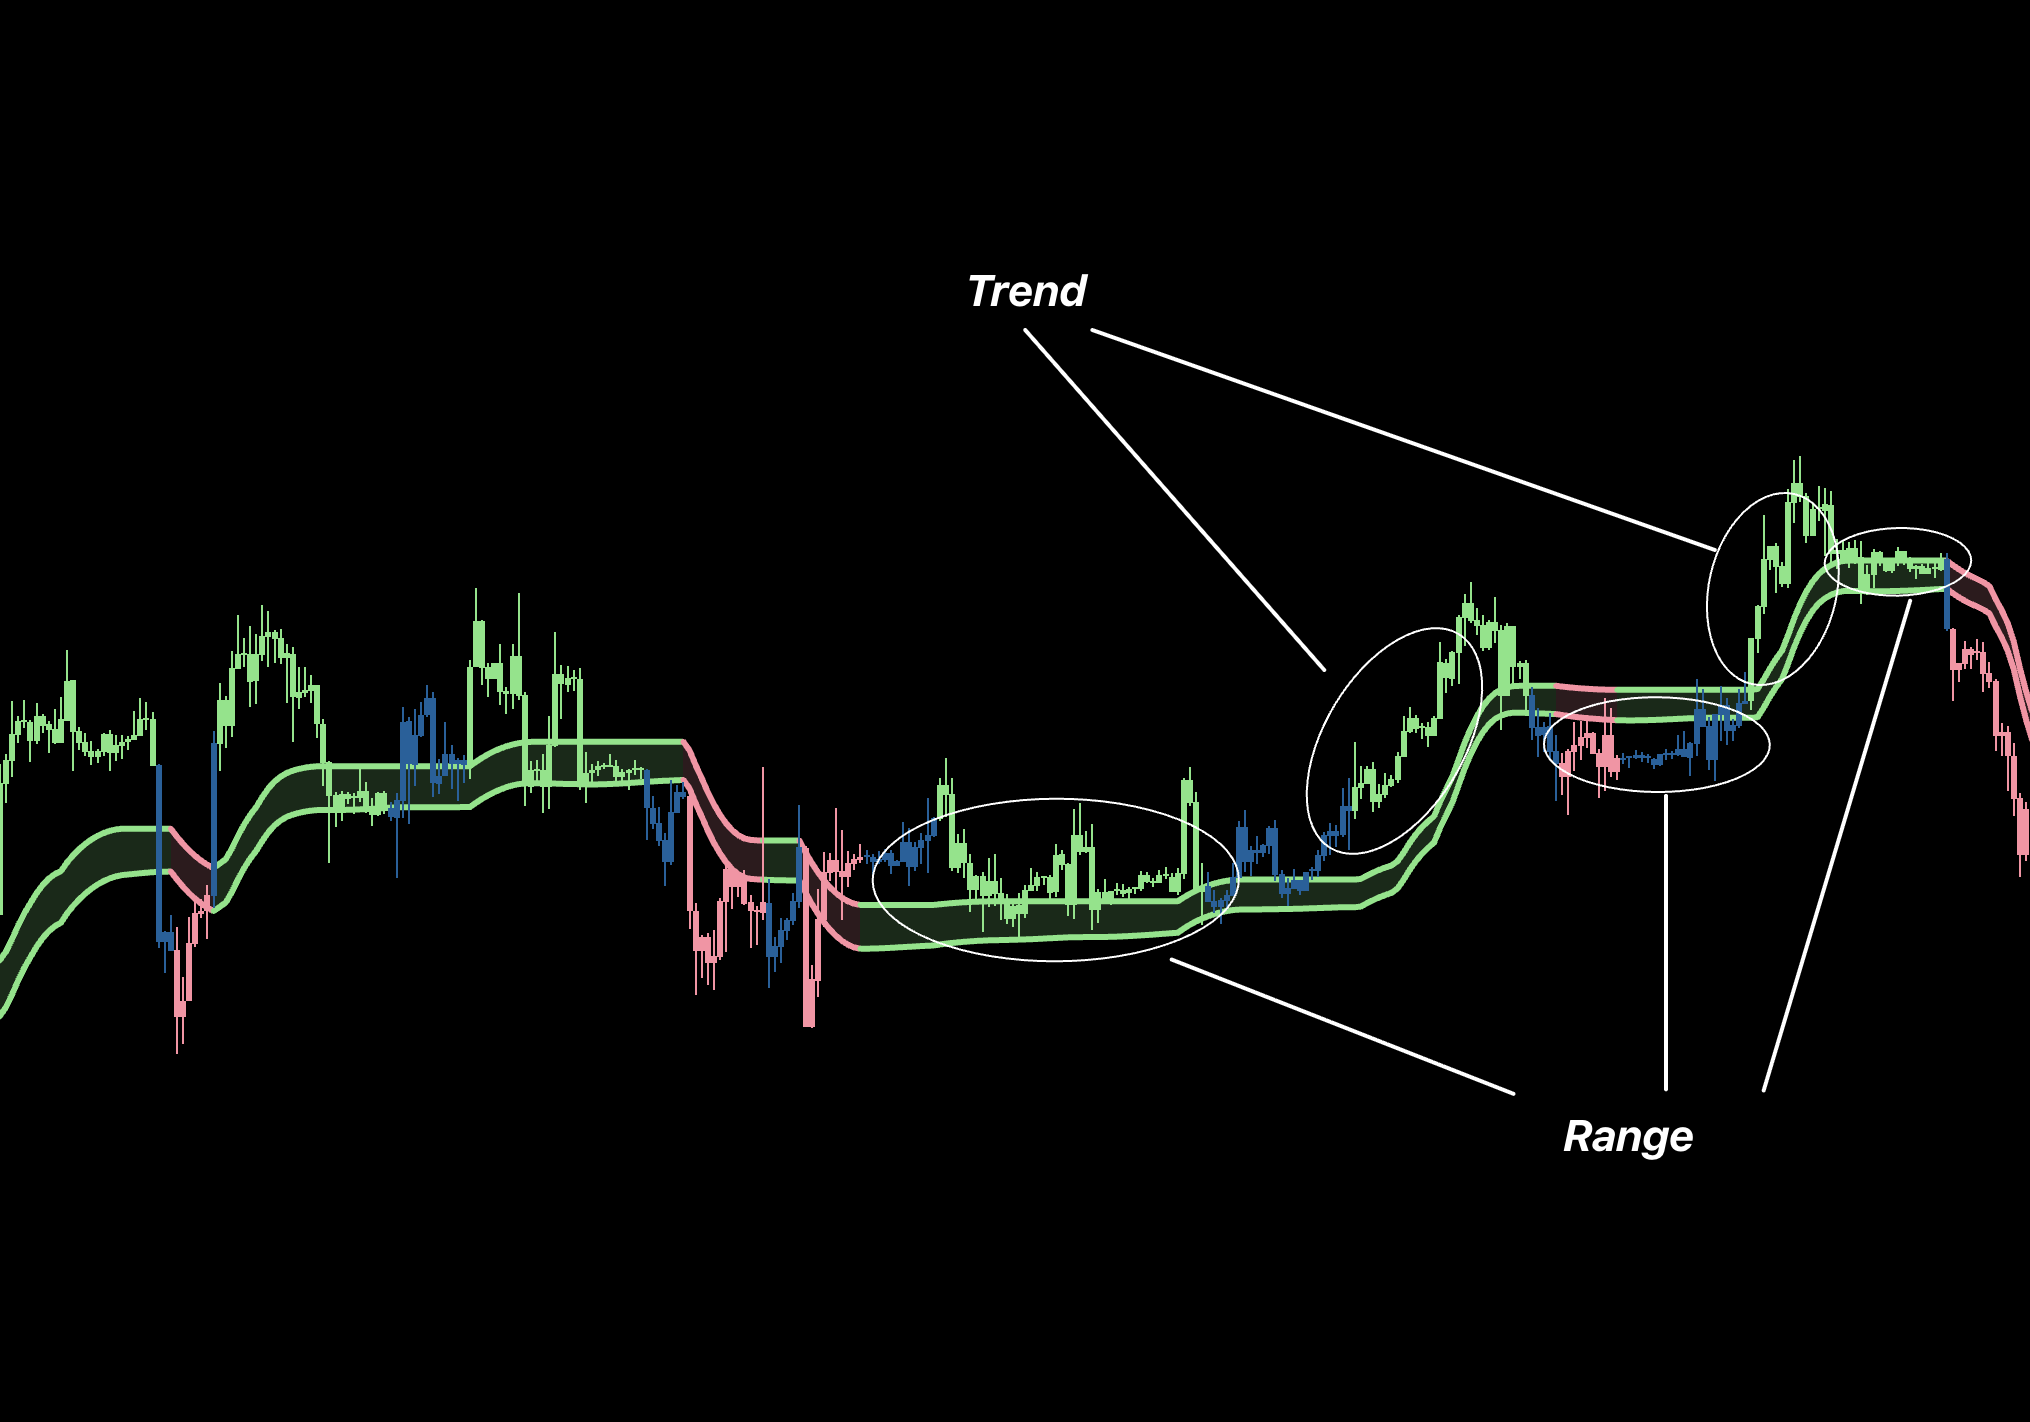
Trending market
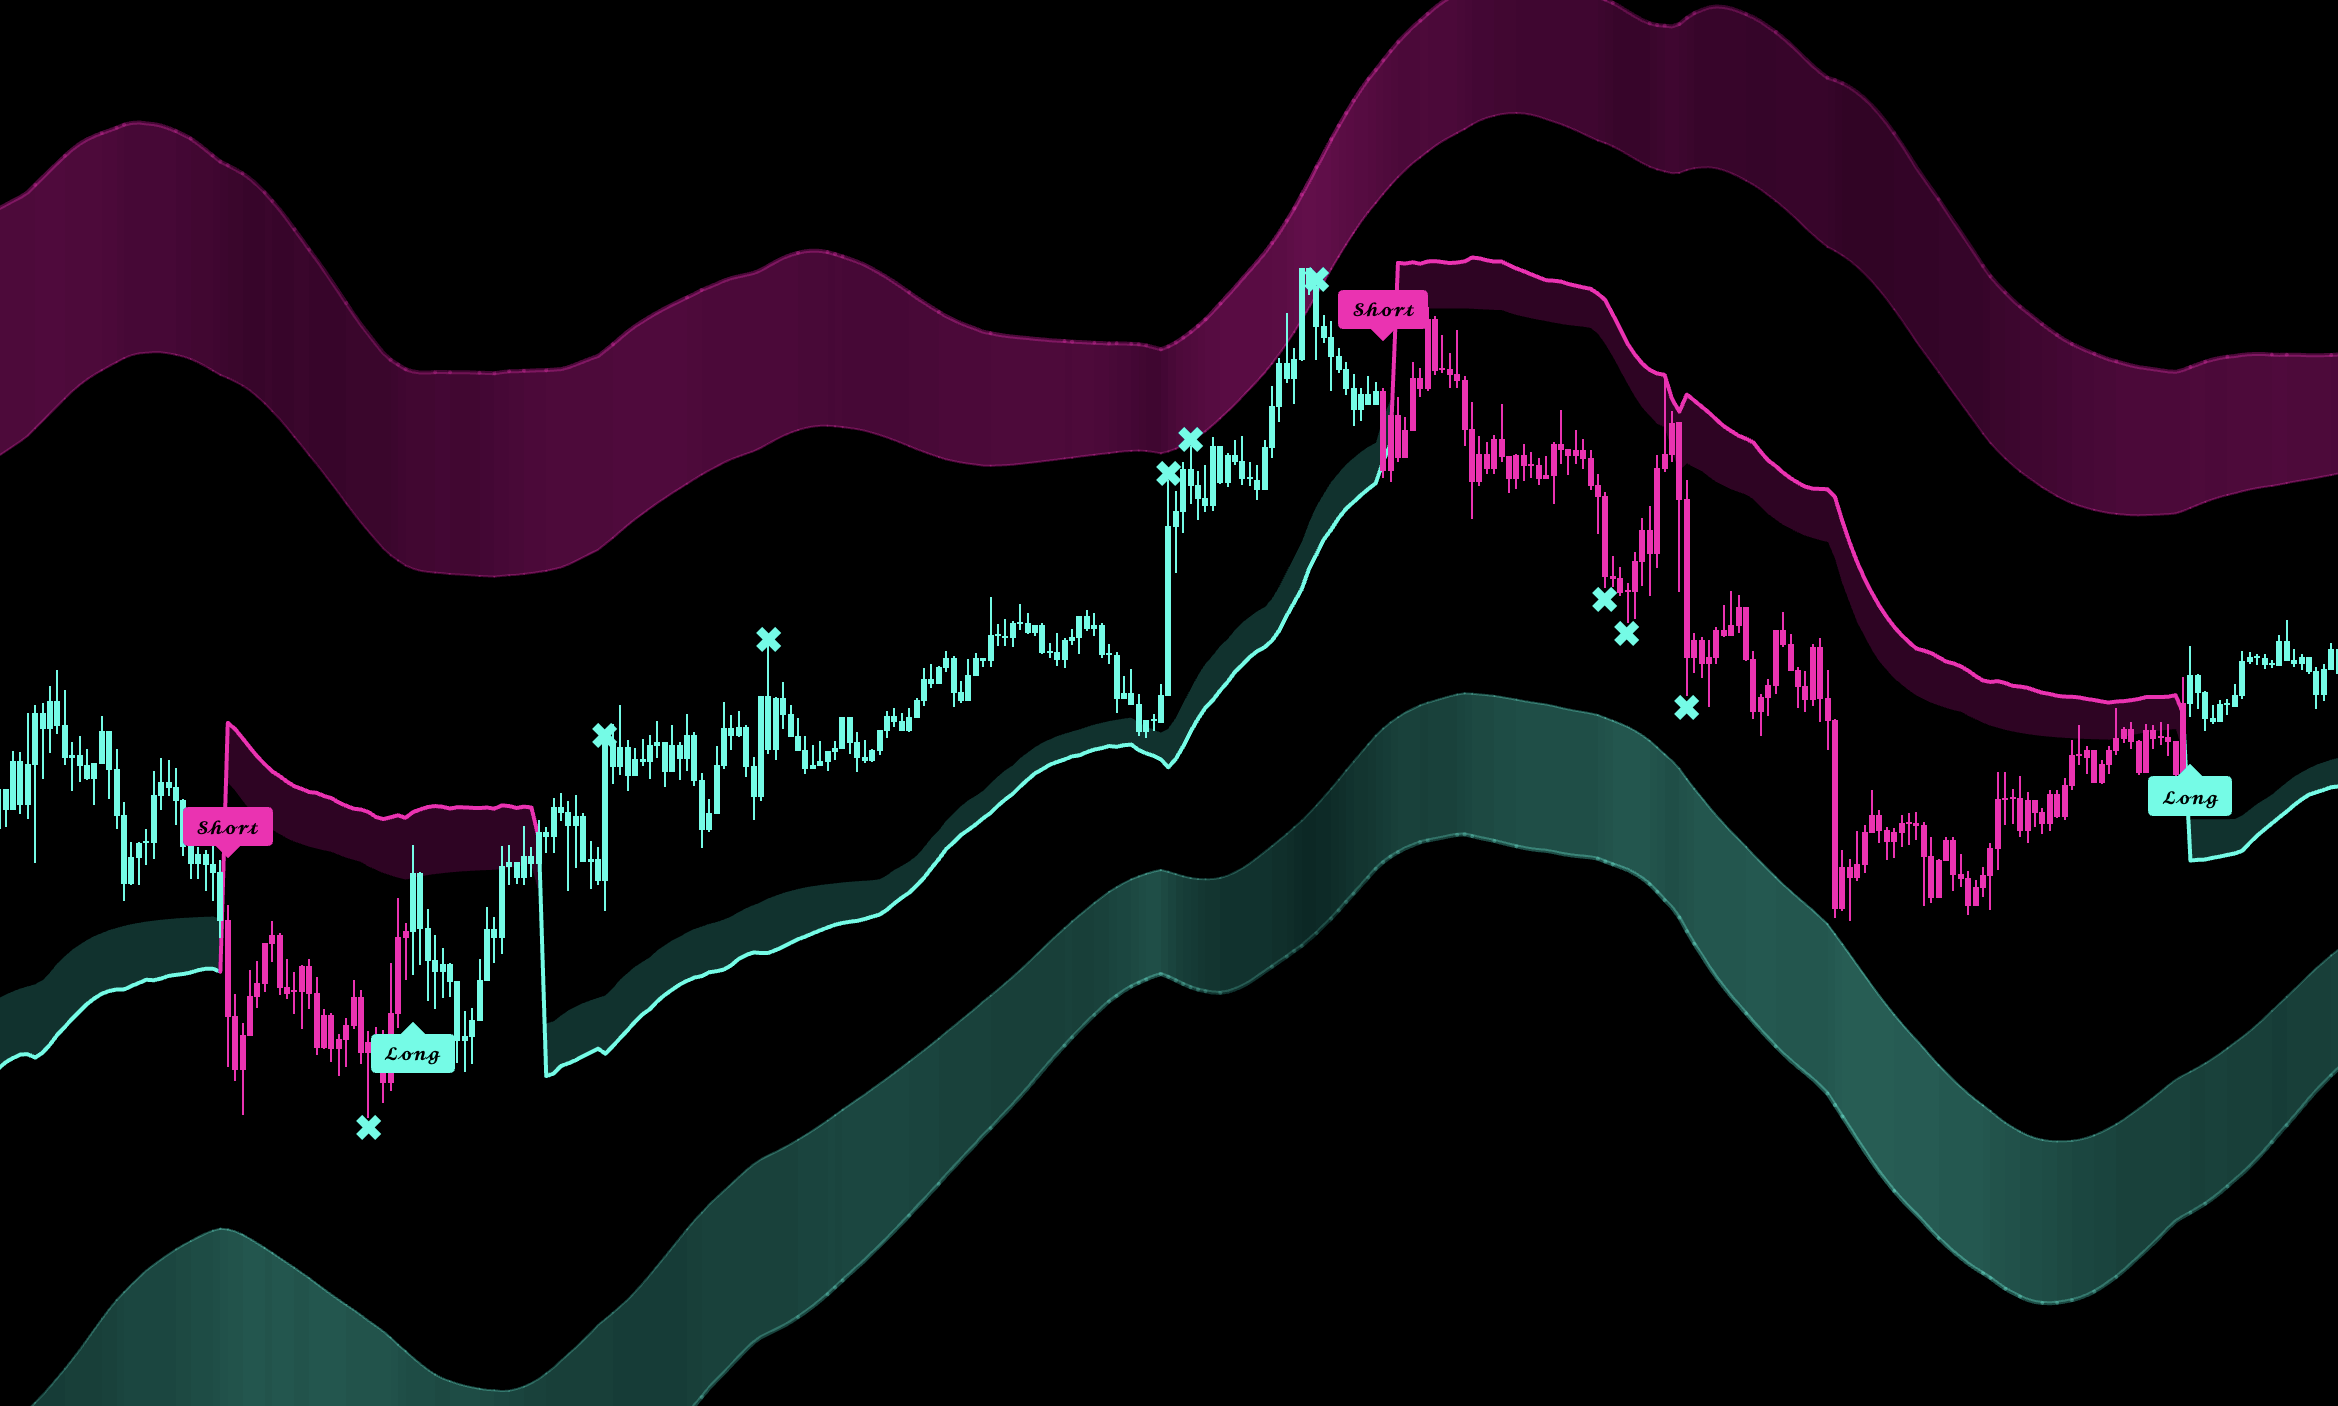
Use the Predictive Cloud or Hyper Bands for direction.
Take Buy signals with bullish bias and Sell signals with bearish bias.
Choose one risk framework: follow the displayed SL and TP projections, or use the opposing Hyper Band as the stop—below the lower band for a Long and above the upper band for a Short.
When using the projected levels, follow TP1–TP3 and move SL to break-even after TP1. Do not switch risk frameworks in the middle of the trade.
Ranging market
Open the Trend Channel on a higher timeframe than the trading timeframe and use it to confirm the broader trend direction.
On the trading timeframe, use Wave Bands for entry location: in a bullish higher-timeframe trend, look for buys near the lower band; in a bearish trend, look for sells near the upper band.
For a Long, place the stop below the lower Wave Band. For a Short, place it above the upper Wave Band.
Take partial profit at the first TP signal and again near the middle of the Wave Bands.
Use the opposite outer band as the final target—the upper band for a Long or the lower band for a Short.
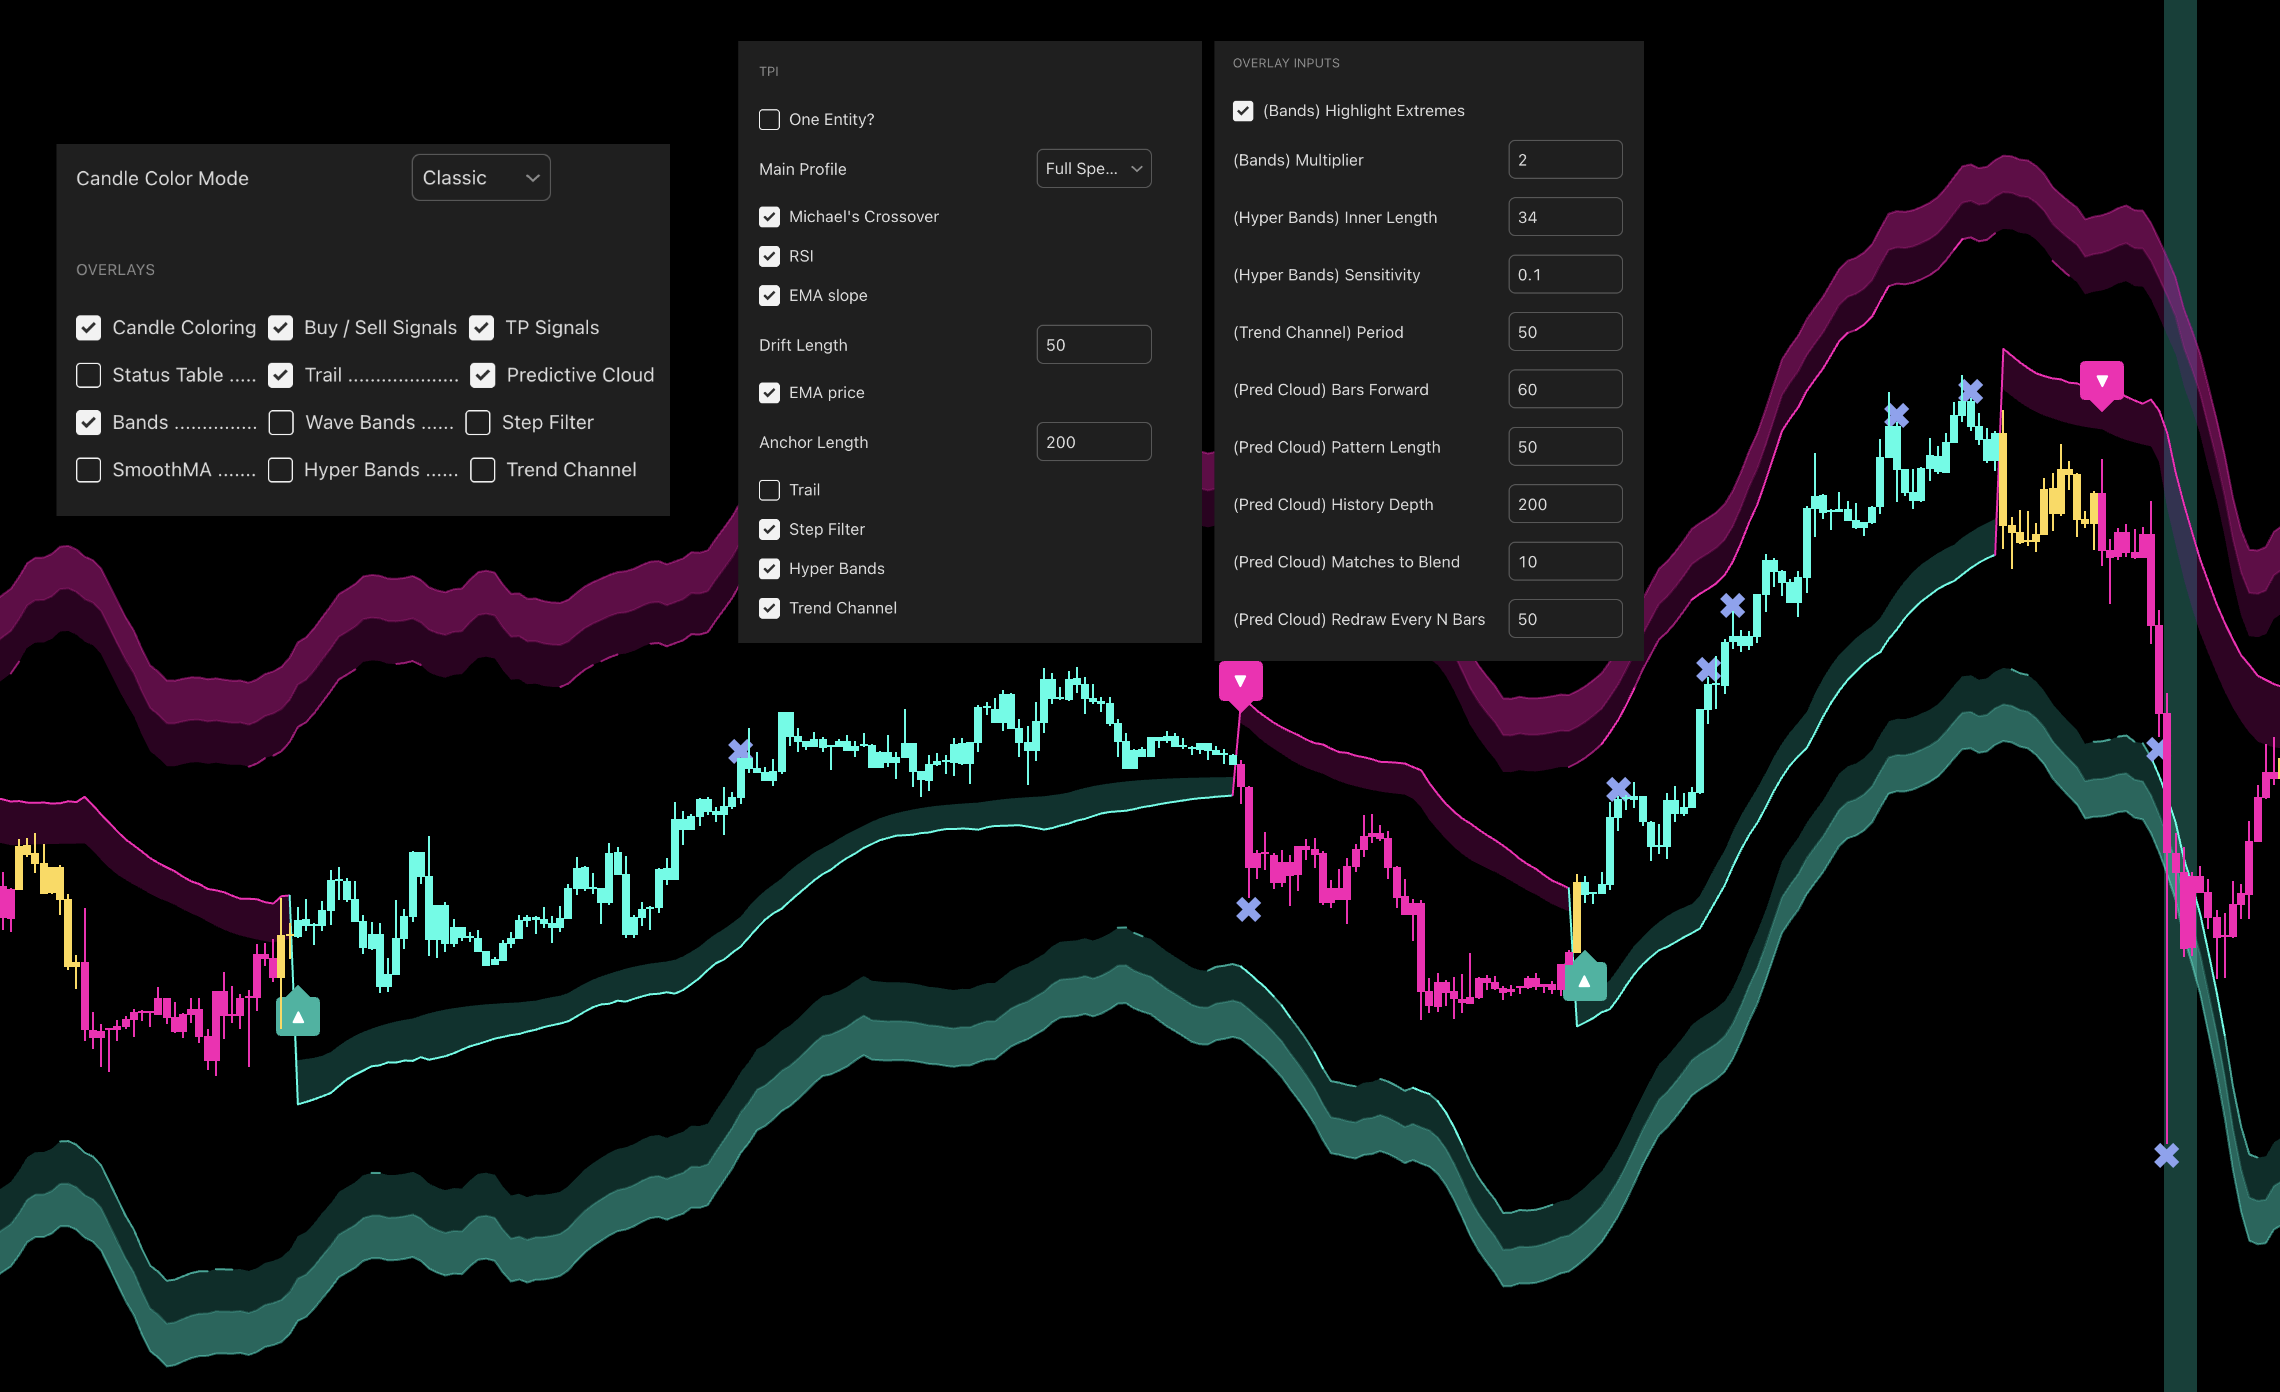
Creating Custom Systems
Start with one TPI Main Profile as the system's baseline and keep the Status Table visible.
Add only one TPI component at a time, such as RSI, EMA Slope, EMA Price, Trail, Step Filter, Hyper Bands, or Trend Channel.
Enable the matching chart overlay when you need to see how that component supports or disagrees with the setup.
Give every addition one job: direction, entry quality, range detection, stop placement, or exit management.
Test the completed combination before adding another component. More enabled tools do not automatically create a better system.
Once the custom TPI system confirms a trade, manage it with either the displayed SL/TP projections or the opposing Hyper Band as the stop.
Features and Overlays
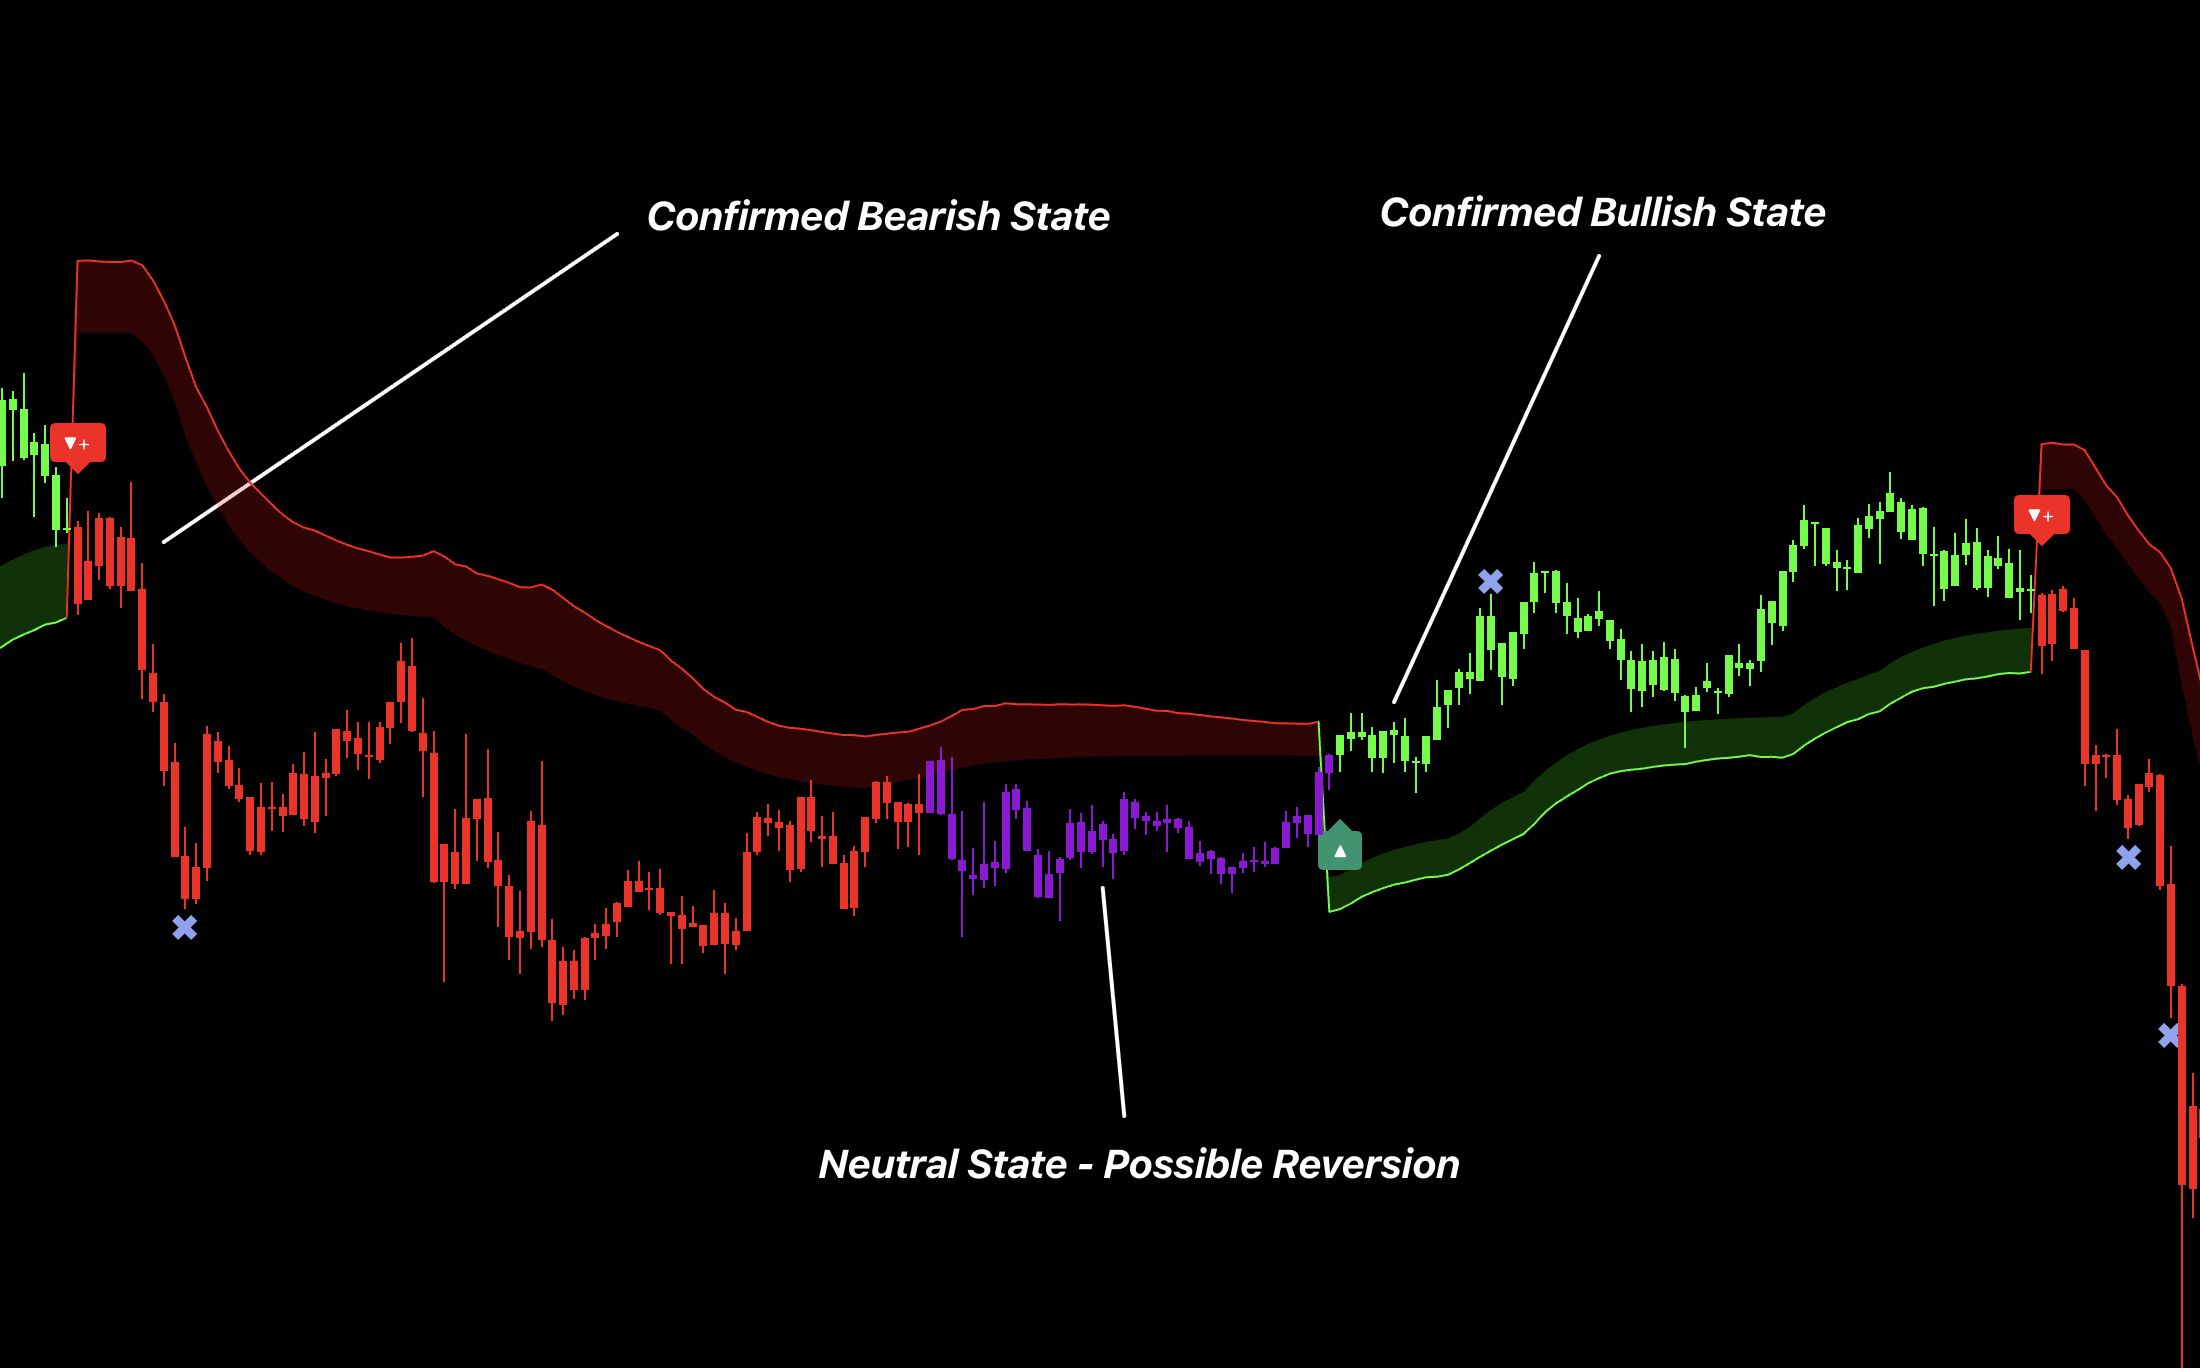
Classic Candle Color
Use bullish and bearish colors for confirmed direction. A neutral state warns that the active move may be losing confirmation.
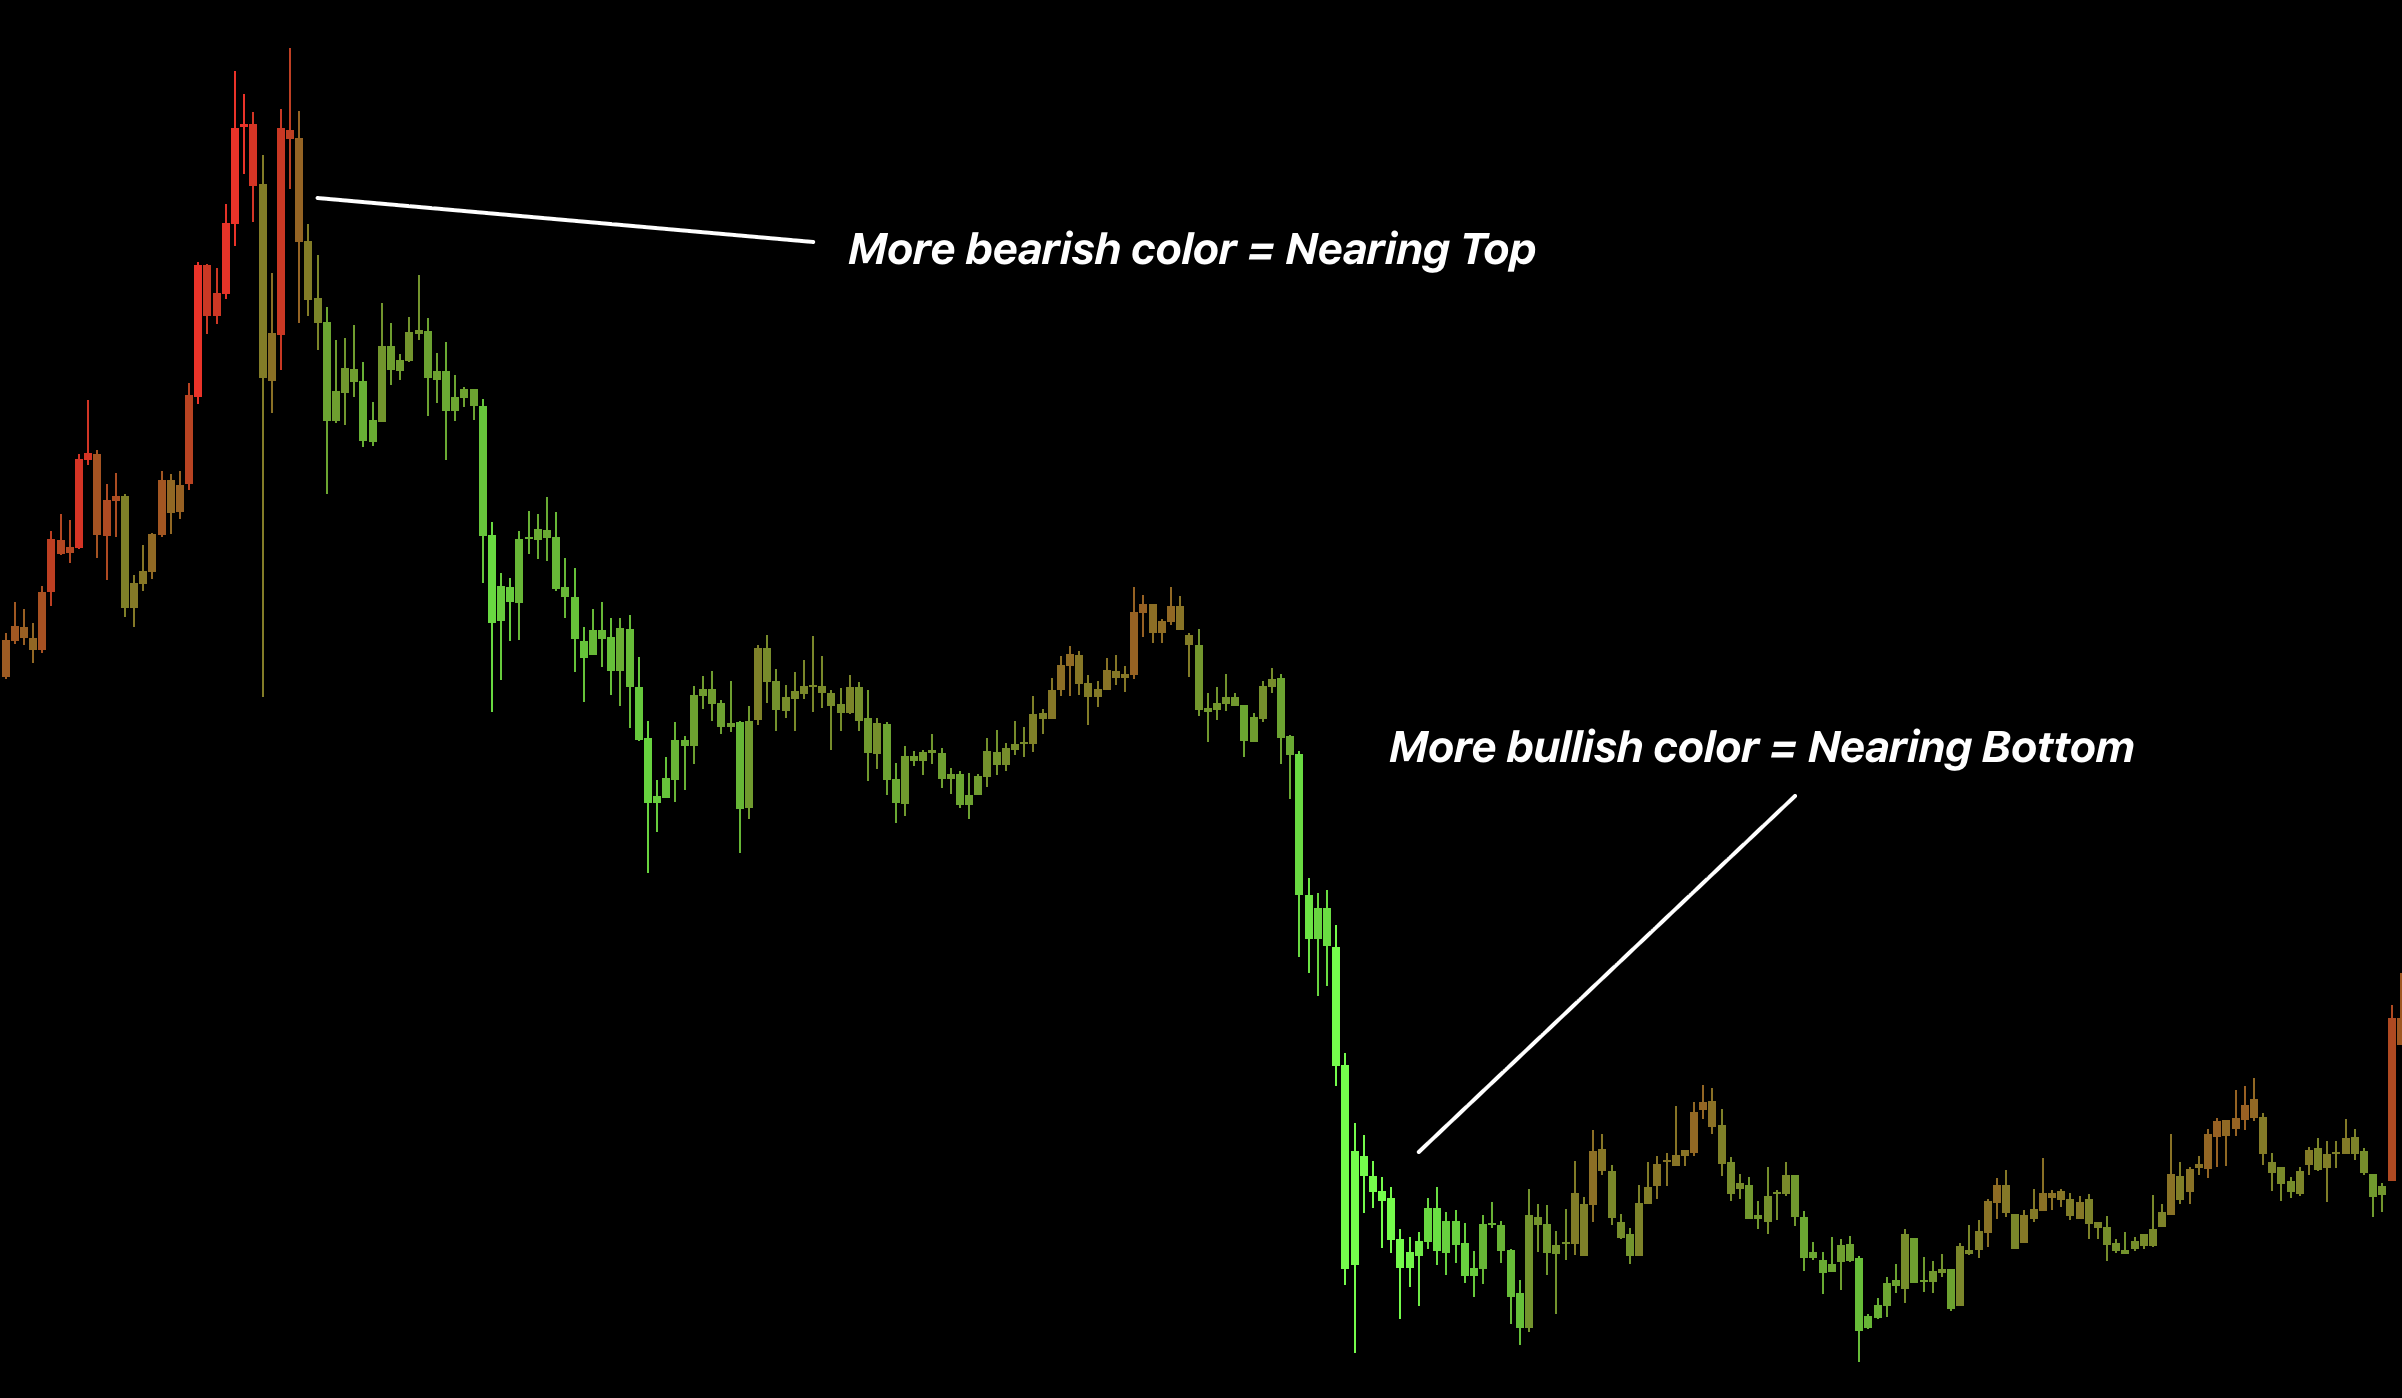
Reversal Candle Color
Use increasing bullish or bearish intensity as an exhaustion warning near a meaningful high, low, band, or range edge. Wait for a matching reversal signal before entering.
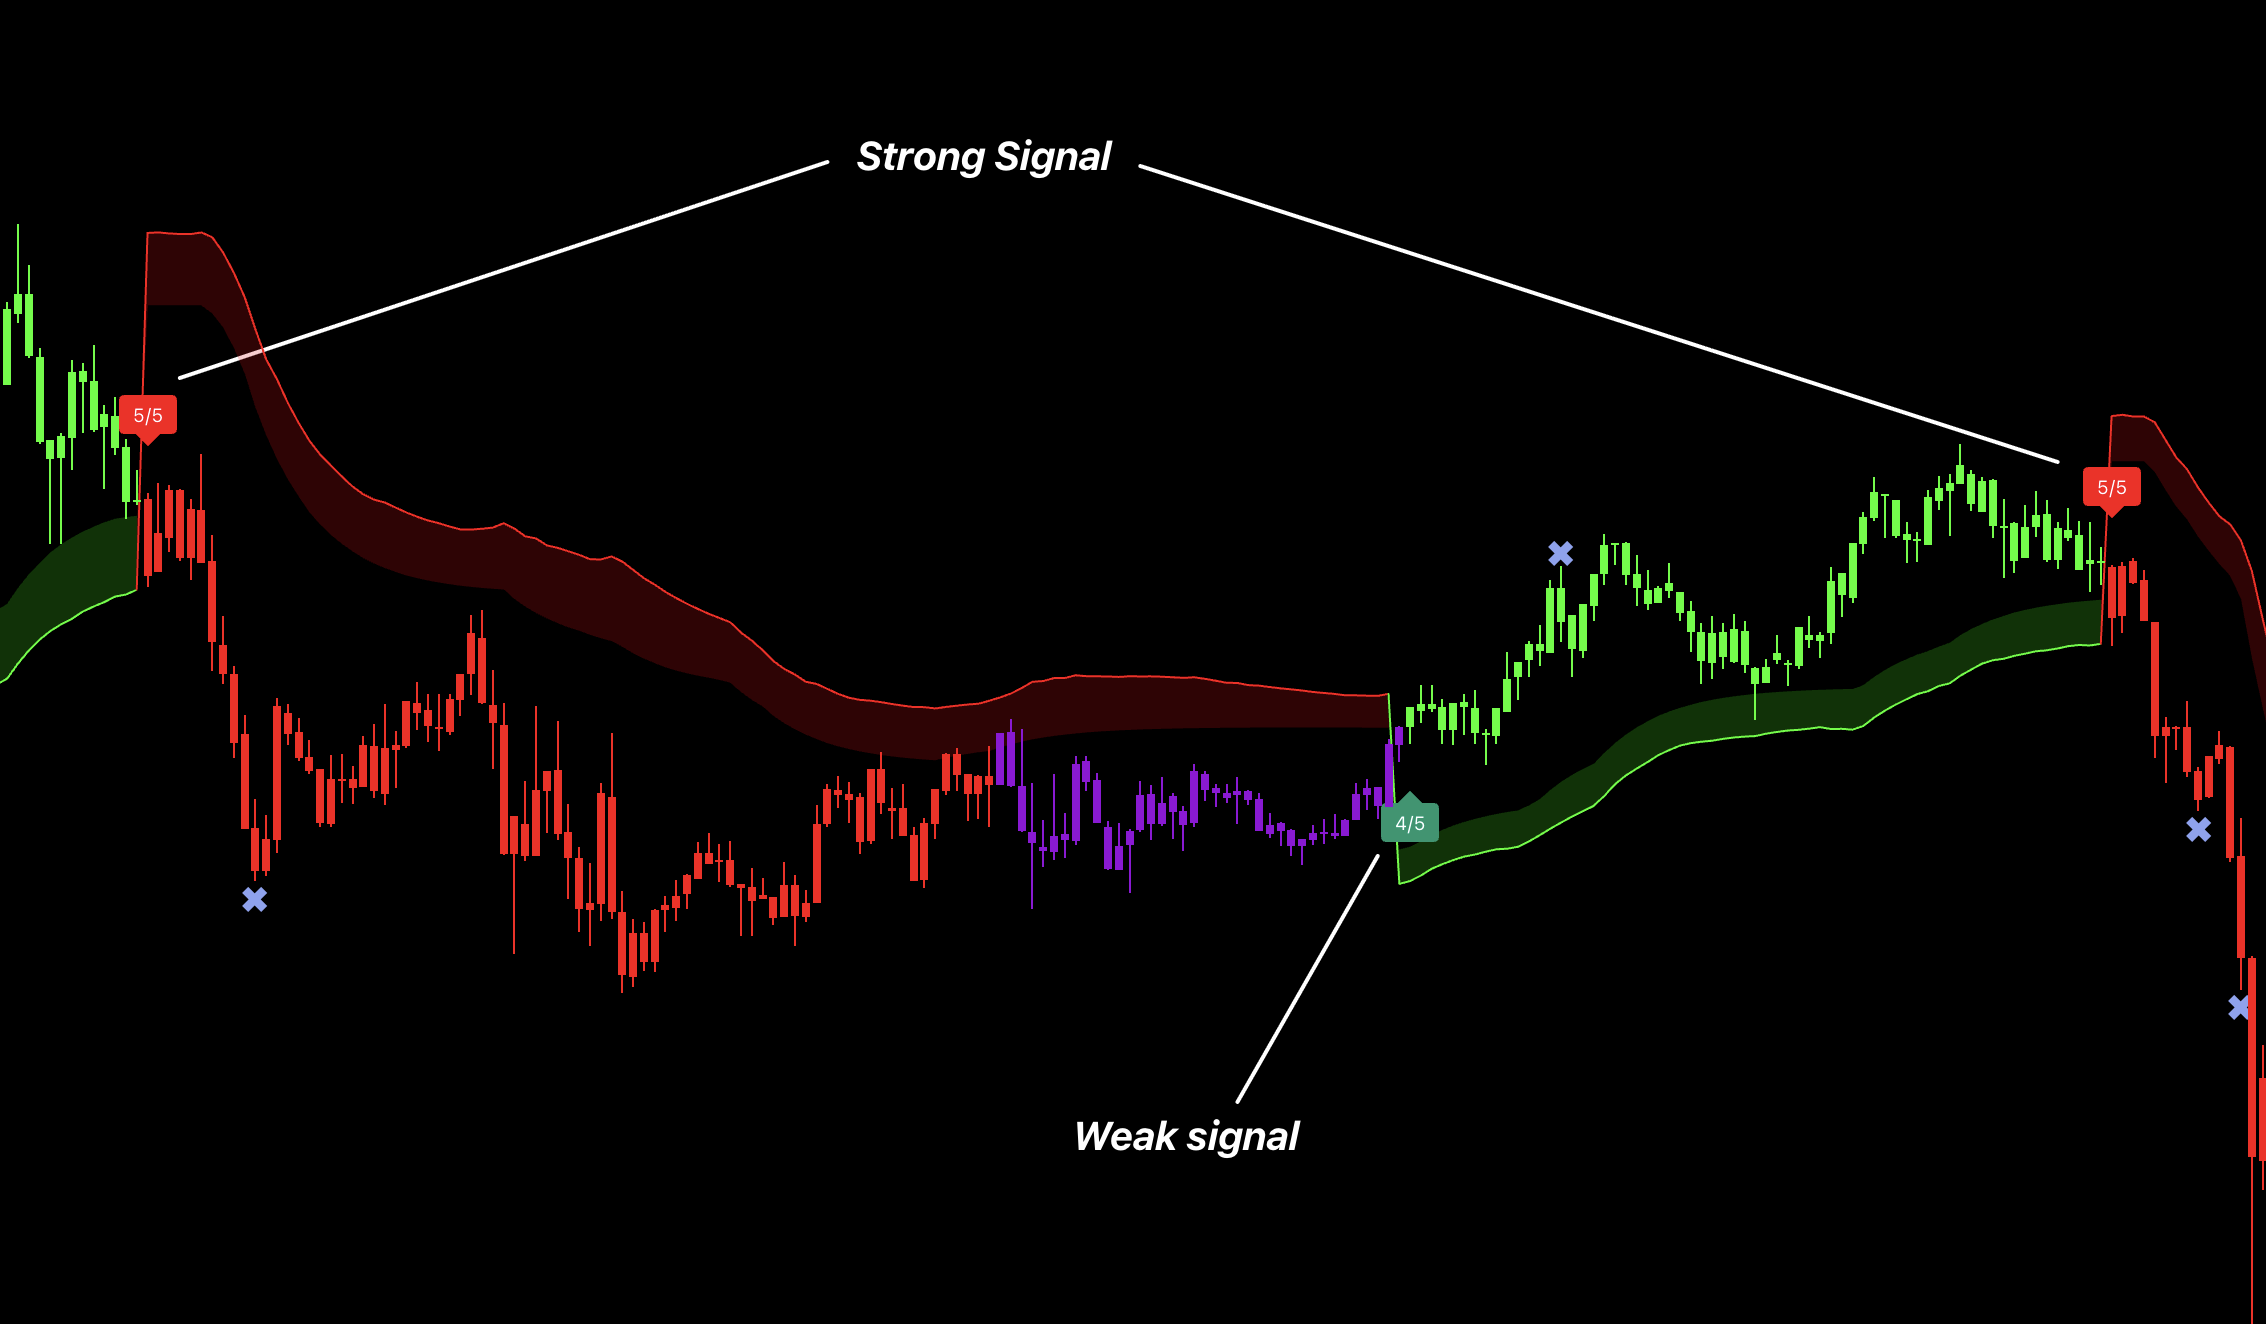
Entry Labels and Strength
Use Buy/Sell as the trigger and strength as a quality filter, not as position size.
Trail
Use pullbacks toward the supportive side for continuation and trailing risk.
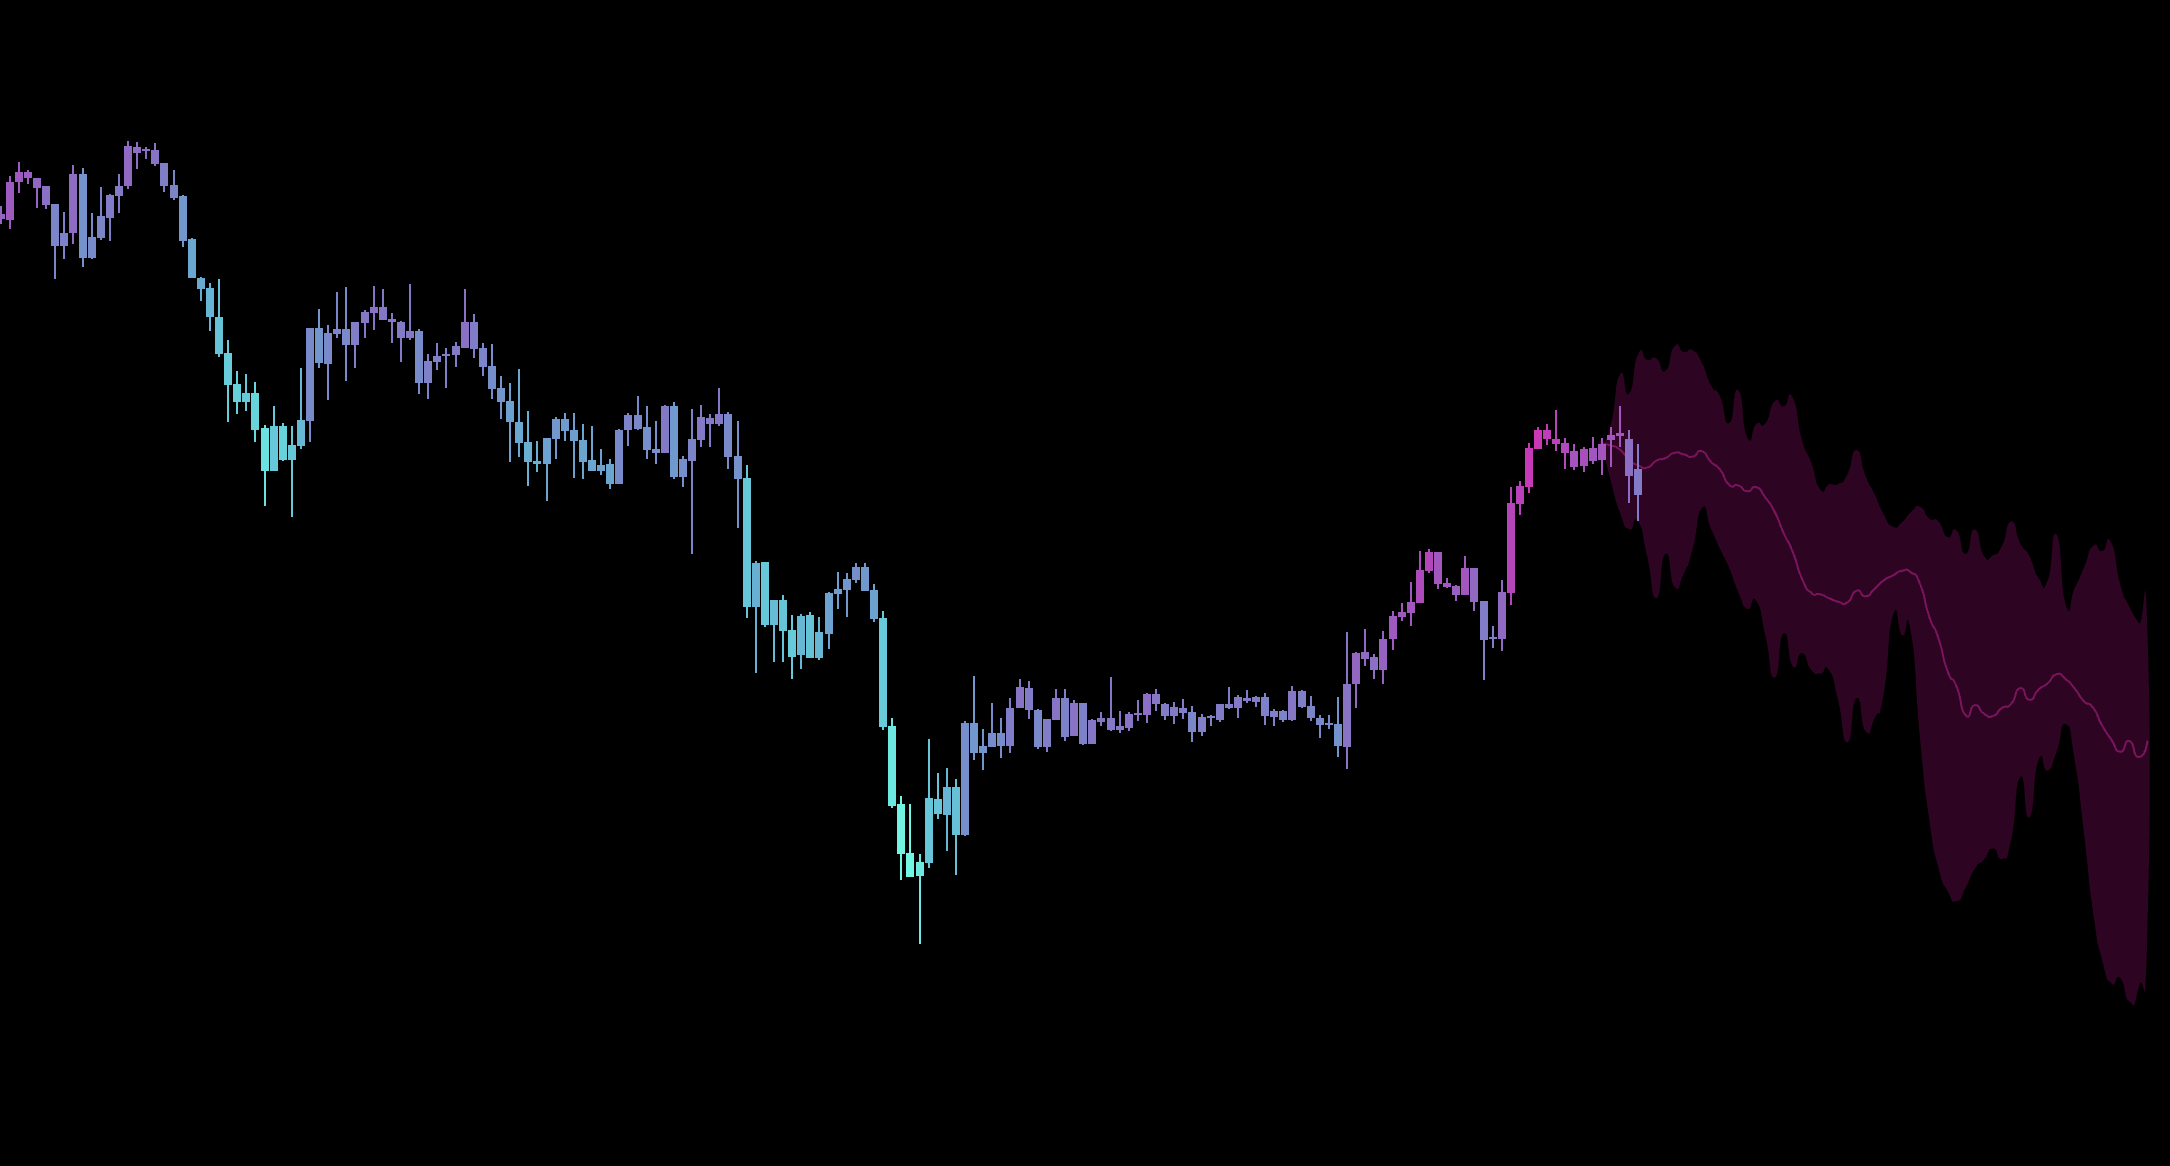
Predictive Cloud
Use bullish Cloud as Long bias and bearish Cloud as Short bias.
Bands
Use the wider extremes for reaction and profit-taking.
Wave Bands
Buy near the lower side and sell near the upper side in ranges; use opacity to read pressure in trends.
Step Filter
Use as one lower-timeframe direction filter.
SmoothMA
Favor signals on the supported side and treat signals against it as countertrend.
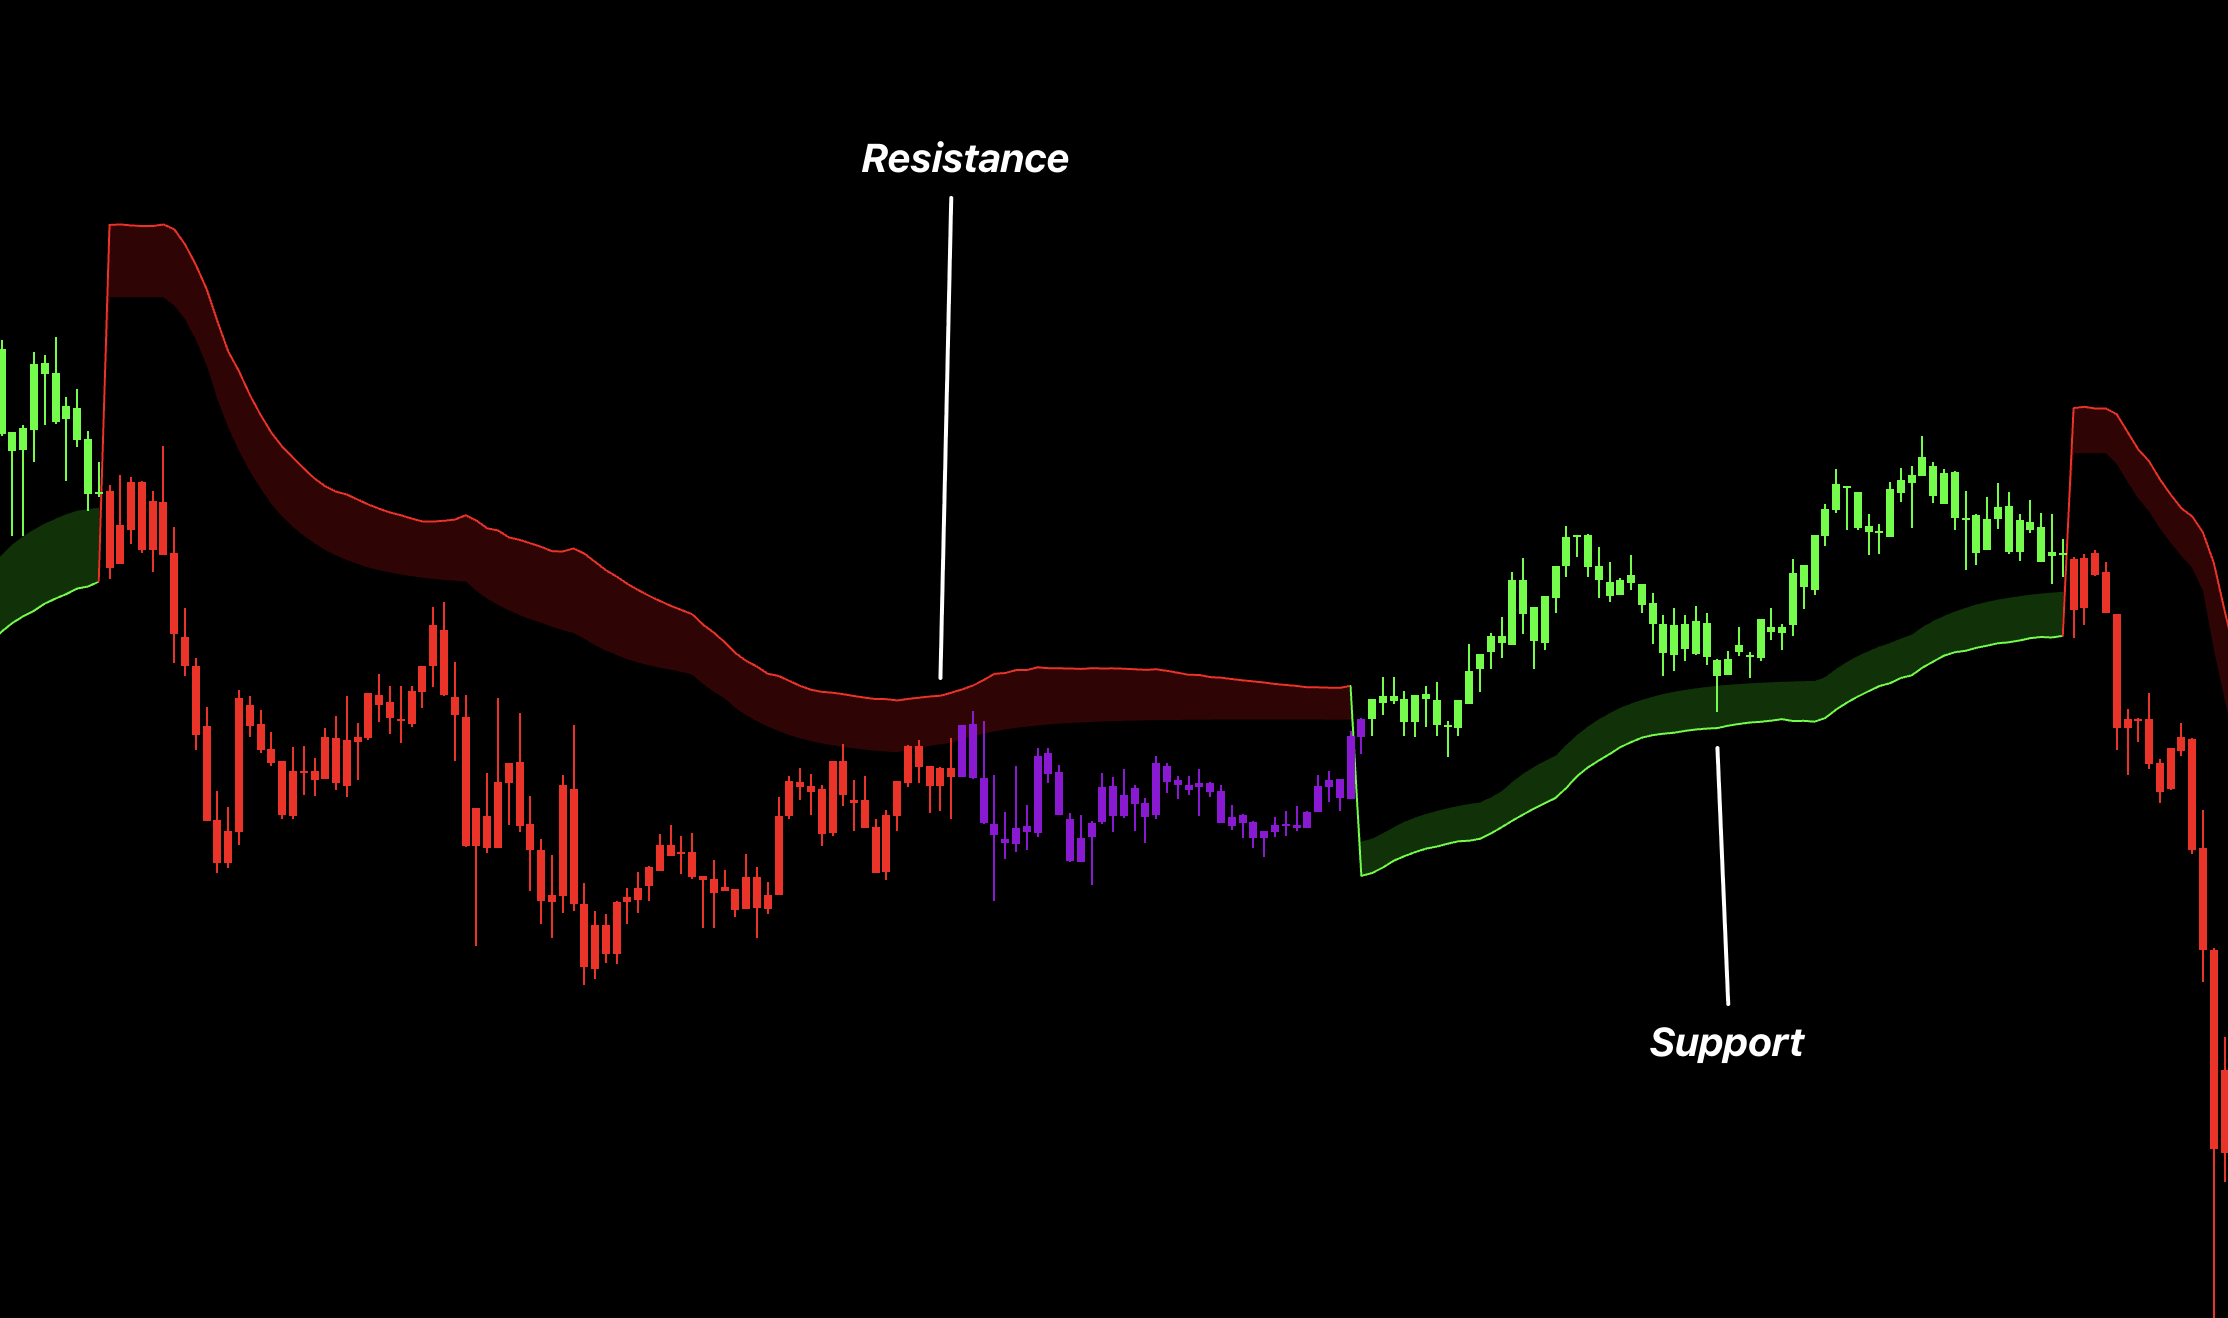
Hyper Bands
Trade with their direction, place Long stops below the lower band and Short stops above the upper band, and respect color flips.
Trend Channel
Use it on a higher timeframe than the trading chart to confirm the broader trend direction, then favor Wave Band entries that align with that direction.
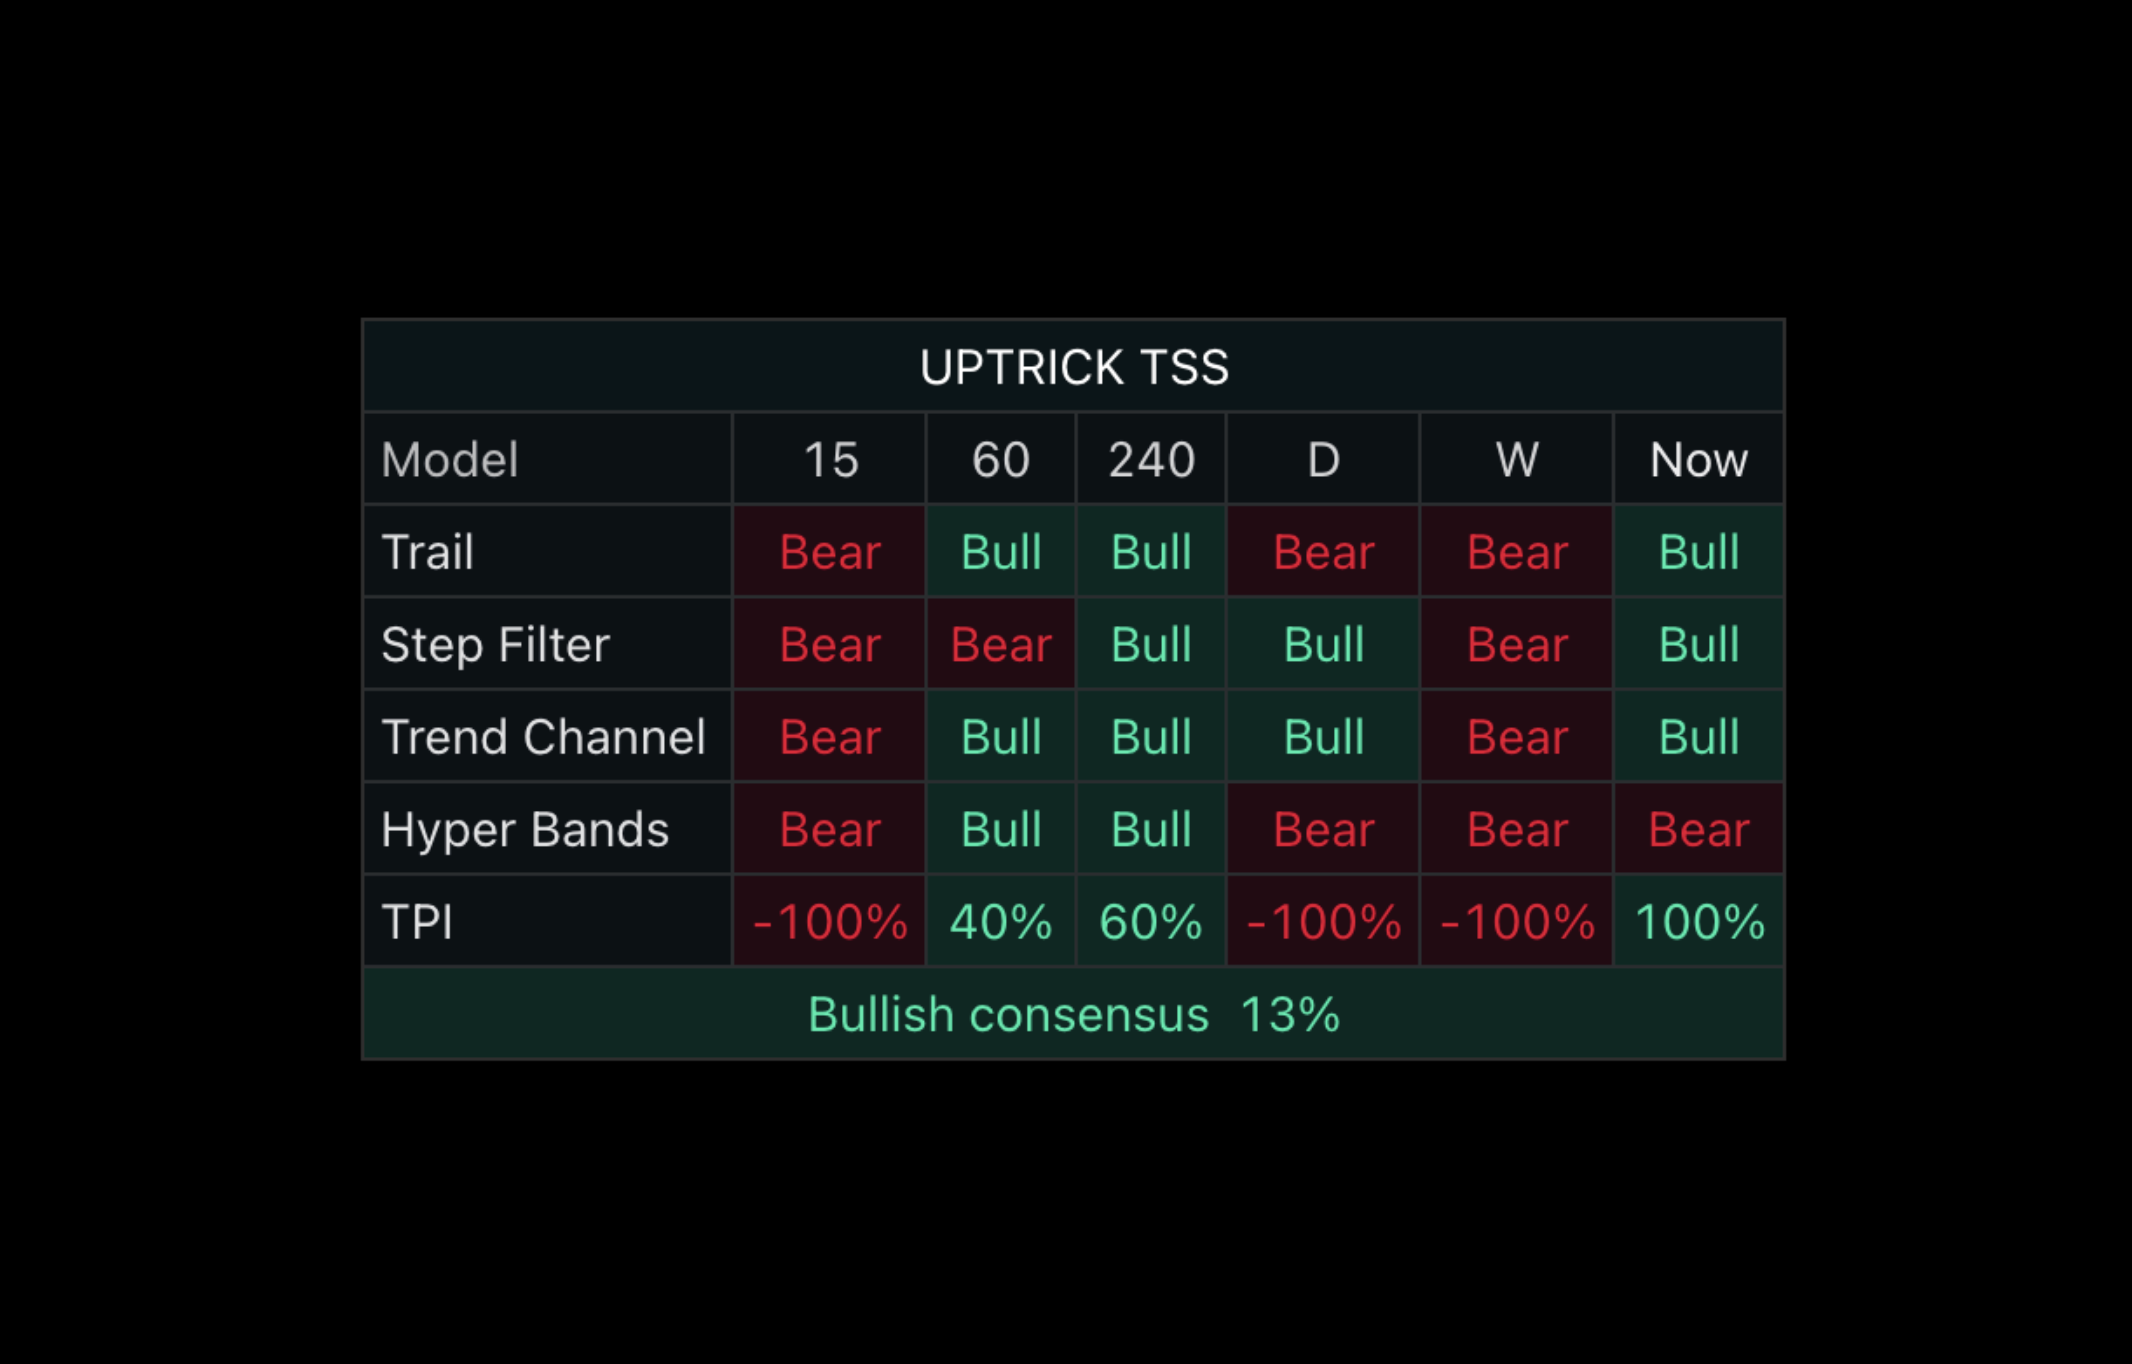
TPI and Status Table
Choose a Main Profile as the starting point, then read the final consensus first. Bullish supports Longs, bearish supports Shorts, and mixed means reduce conviction. Add optional TPI components one at a time and use the individual rows to understand agreement—not as a requirement to force every tool into the system.
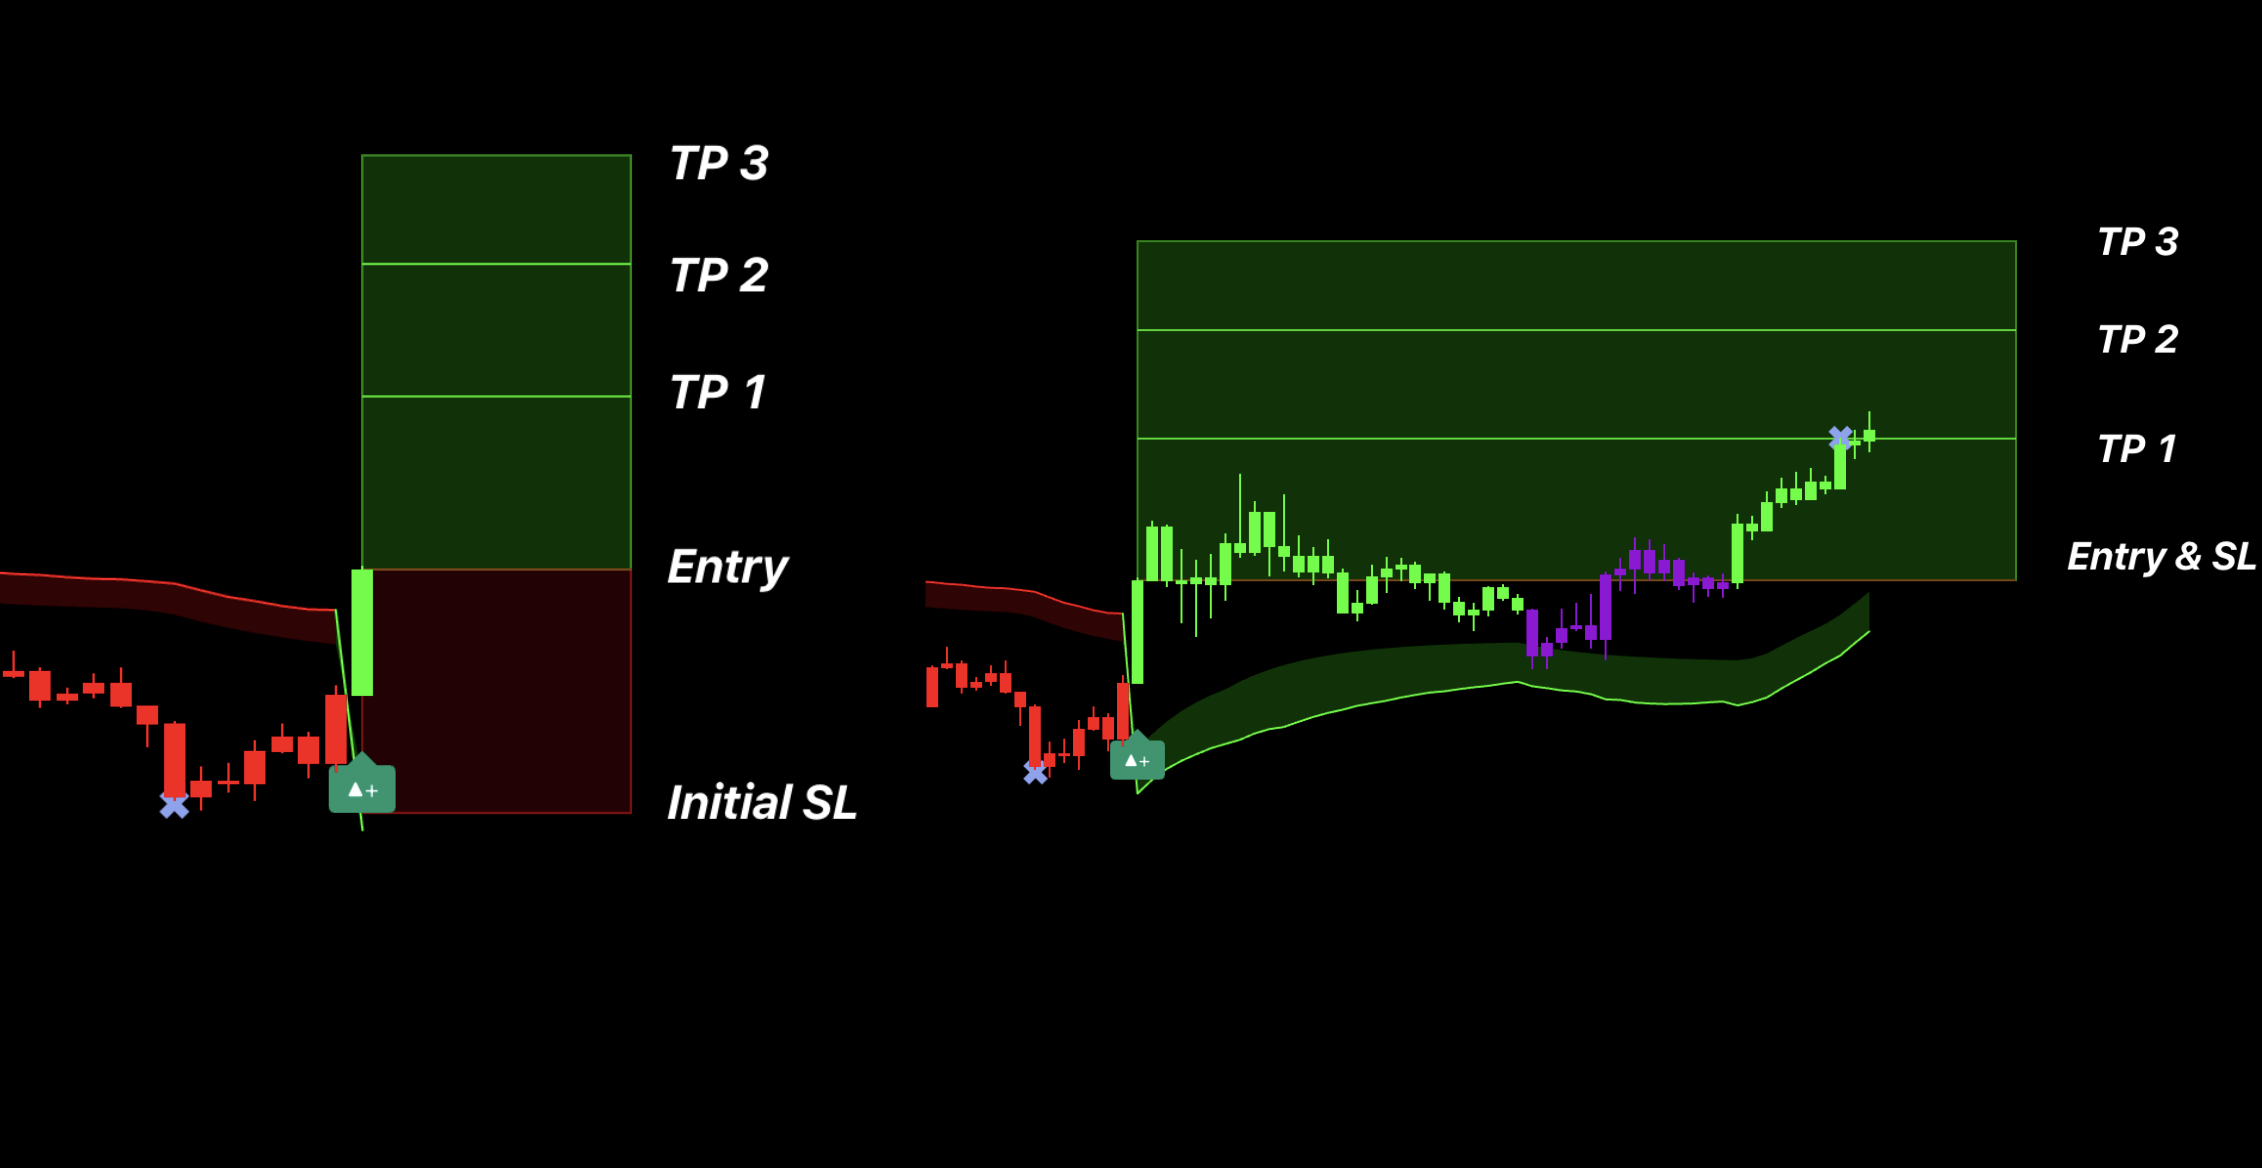
TP / SL Workflow
Choose One Risk Framework
Projected SL and TPs
Follow the latest signal's displayed SL, TP1, TP2, and TP3 as one complete trade plan.
Hyper Band Stop
Use the lower Hyper Band as the Long stop or the upper Hyper Band as the Short stop. Keep a defined profit-taking plan and do not move between stop methods mid-trade.
Use the latest signal's entry, SL, and targets only.
Take partial profit at TP1, TP2, and TP3.
Move SL to break-even after TP1.
Additional targets after TP3 are optional extensions, not reasons to avoid earlier profit-taking.
How to Adjust the Inputs
Goal
Adjustment
Simple trend setup
Signals + Predictive Cloud + Hyper Bands + TP/SL.
Wave Band setup
Higher-timeframe Trend Channel for direction + trading-timeframe Wave Bands for entries, stops, and targets.
Custom TPI system
Start with one Main Profile, add one TPI component at a time, and enable only the matching overlays needed to make decisions.
Fewer entries
Add one direction filter or require stronger signal strength.
More responsive bias
Shorten the selected filter gradually; expect more flips.
Wider stop
Use the outer Hyper Band or increase the chosen volatility distance while reducing size.
Cleaner chart
Hide every feature that does not change entry, stop, target, or bias.
Recommended
Best For
Lower-timeframe trading and custom system development.
Recommended Setup
Build with one signal, one bias overlay, one risk overlay, and TP/SL management.
Why
Its 12+ overlays can create a clear, low-noise workflow. Risk is structured, but no indicator is risk-free.
Trend
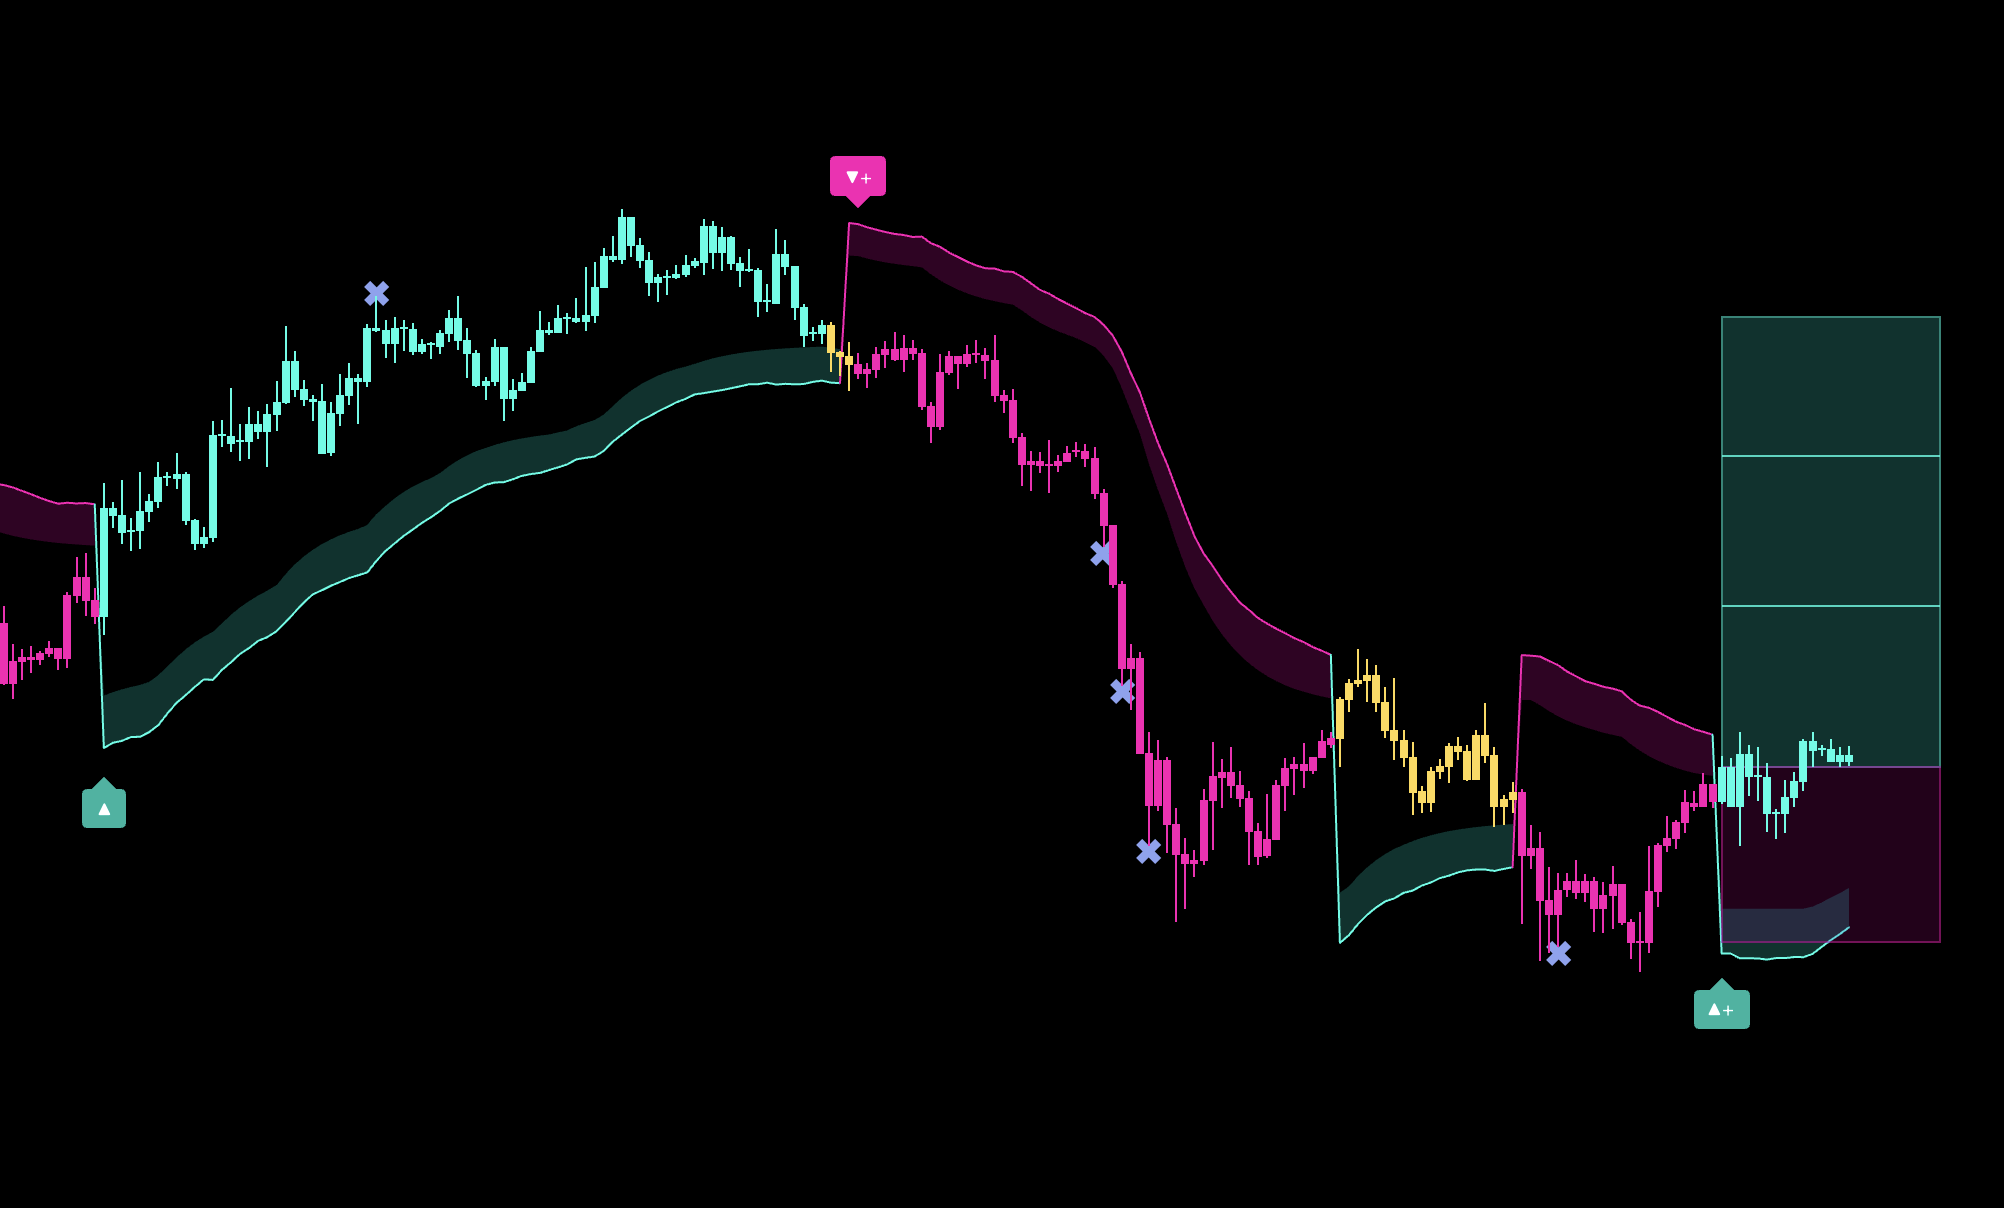
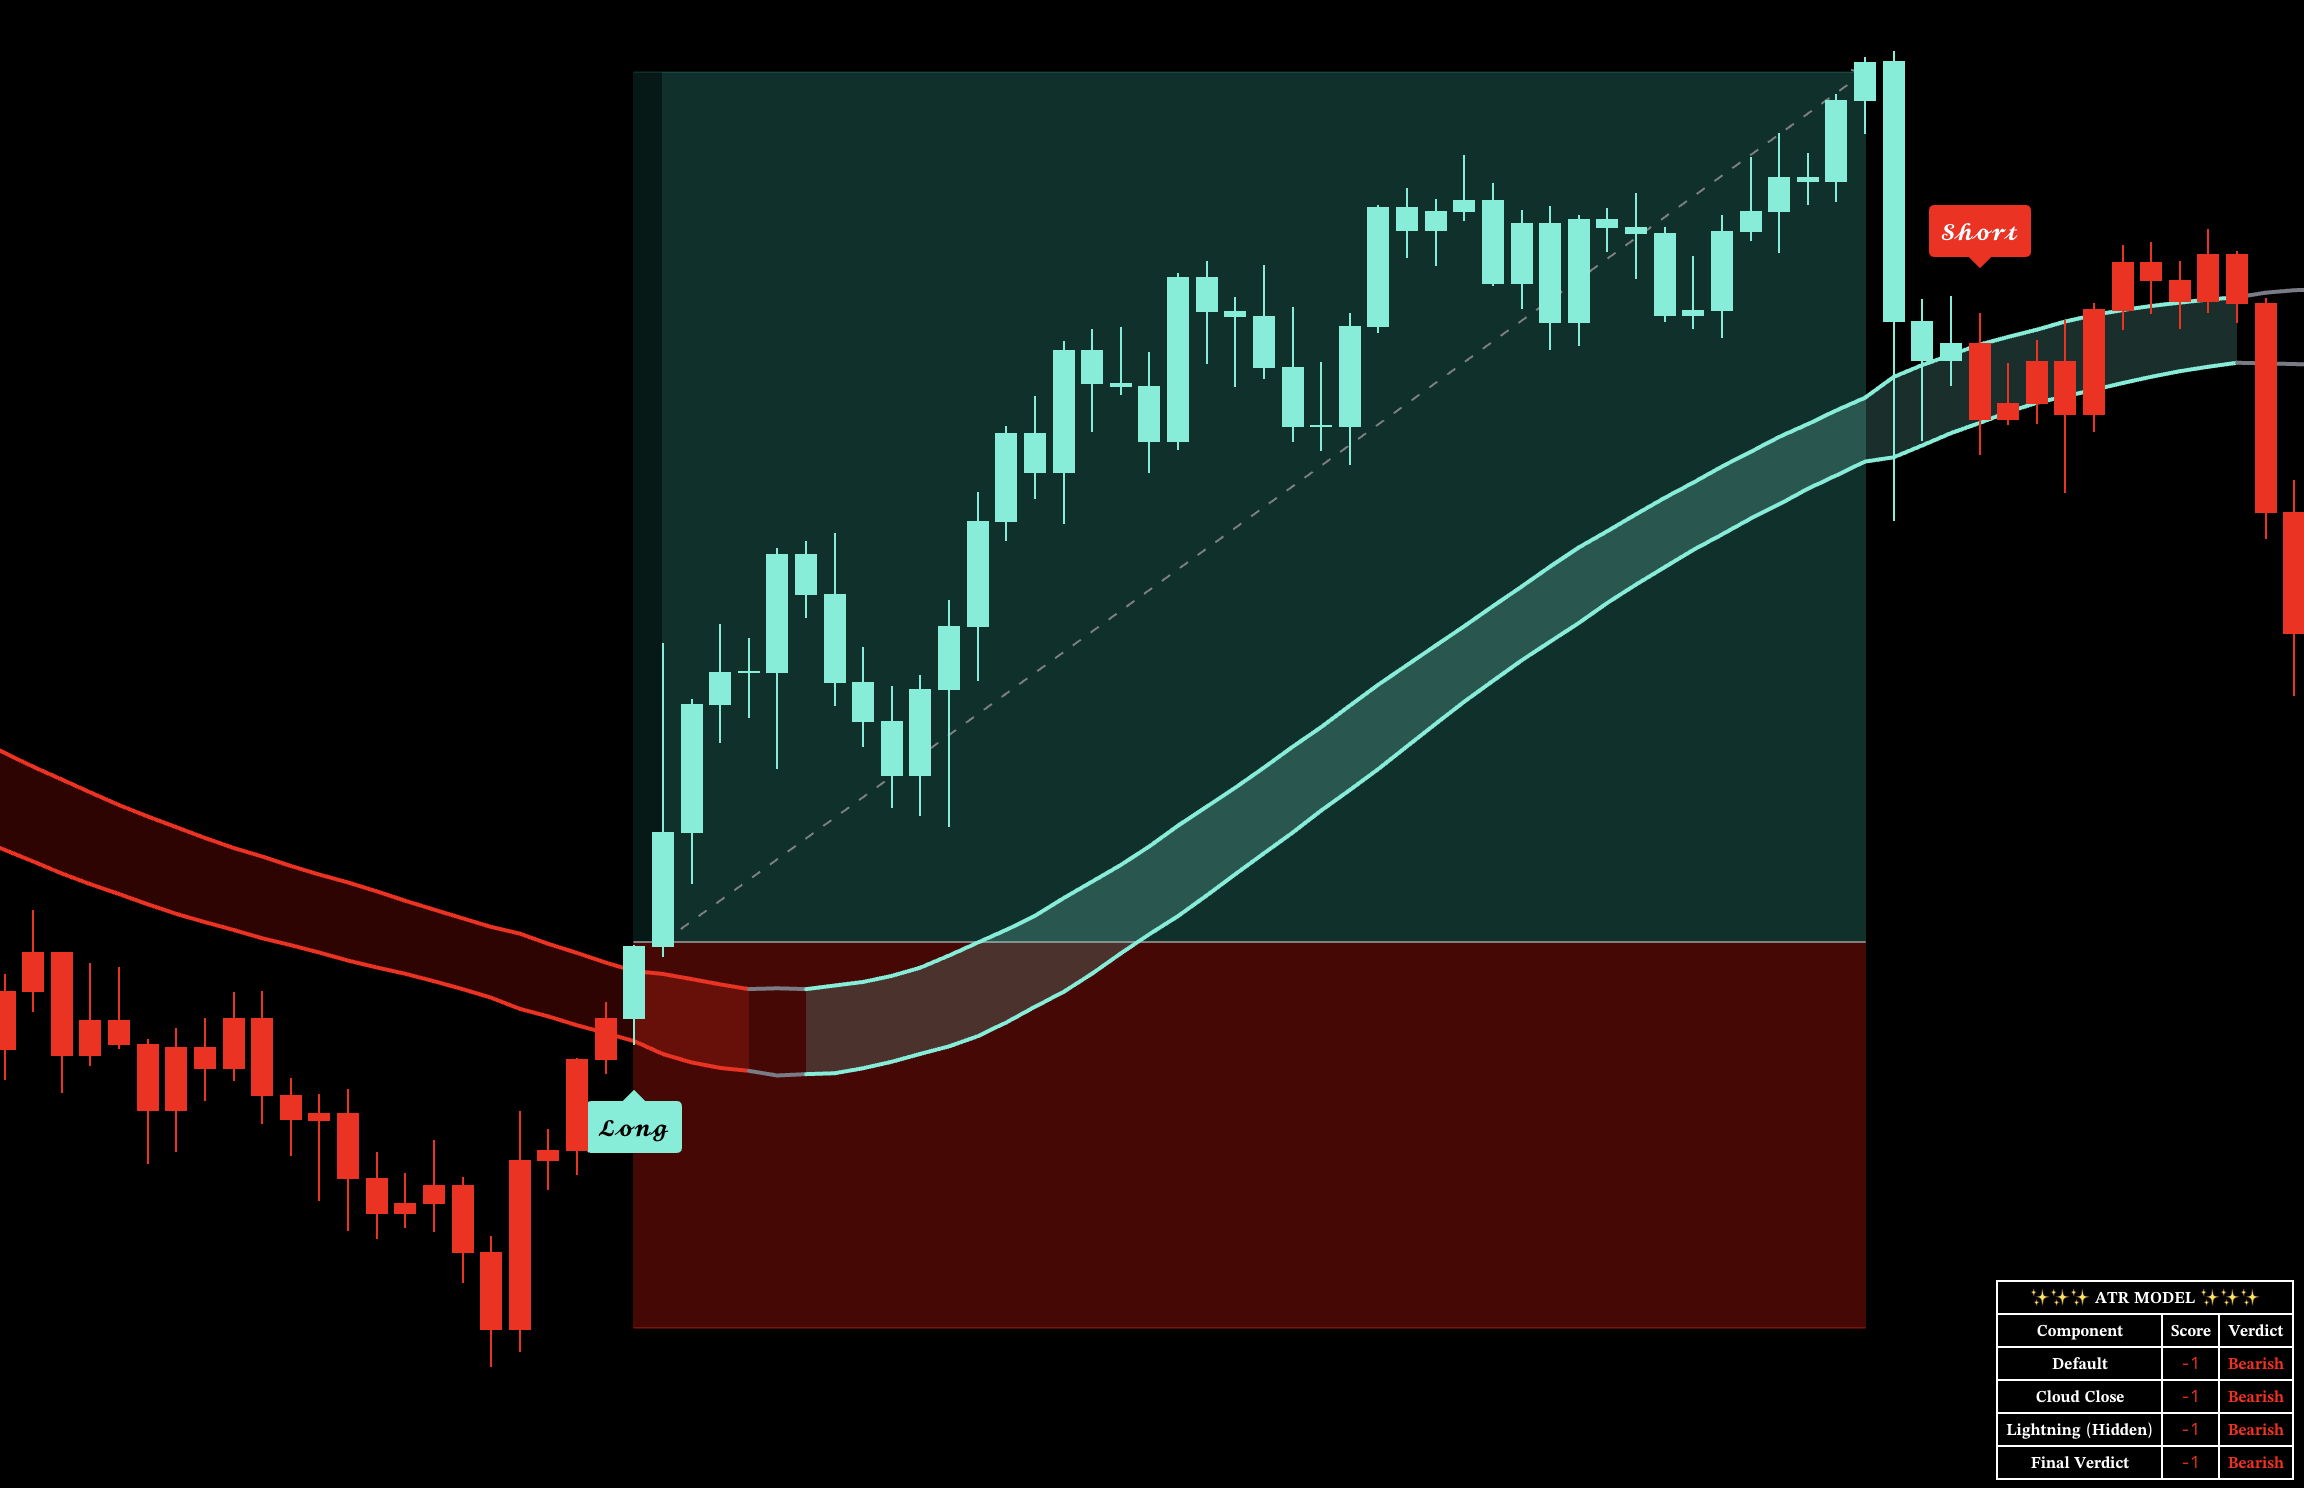
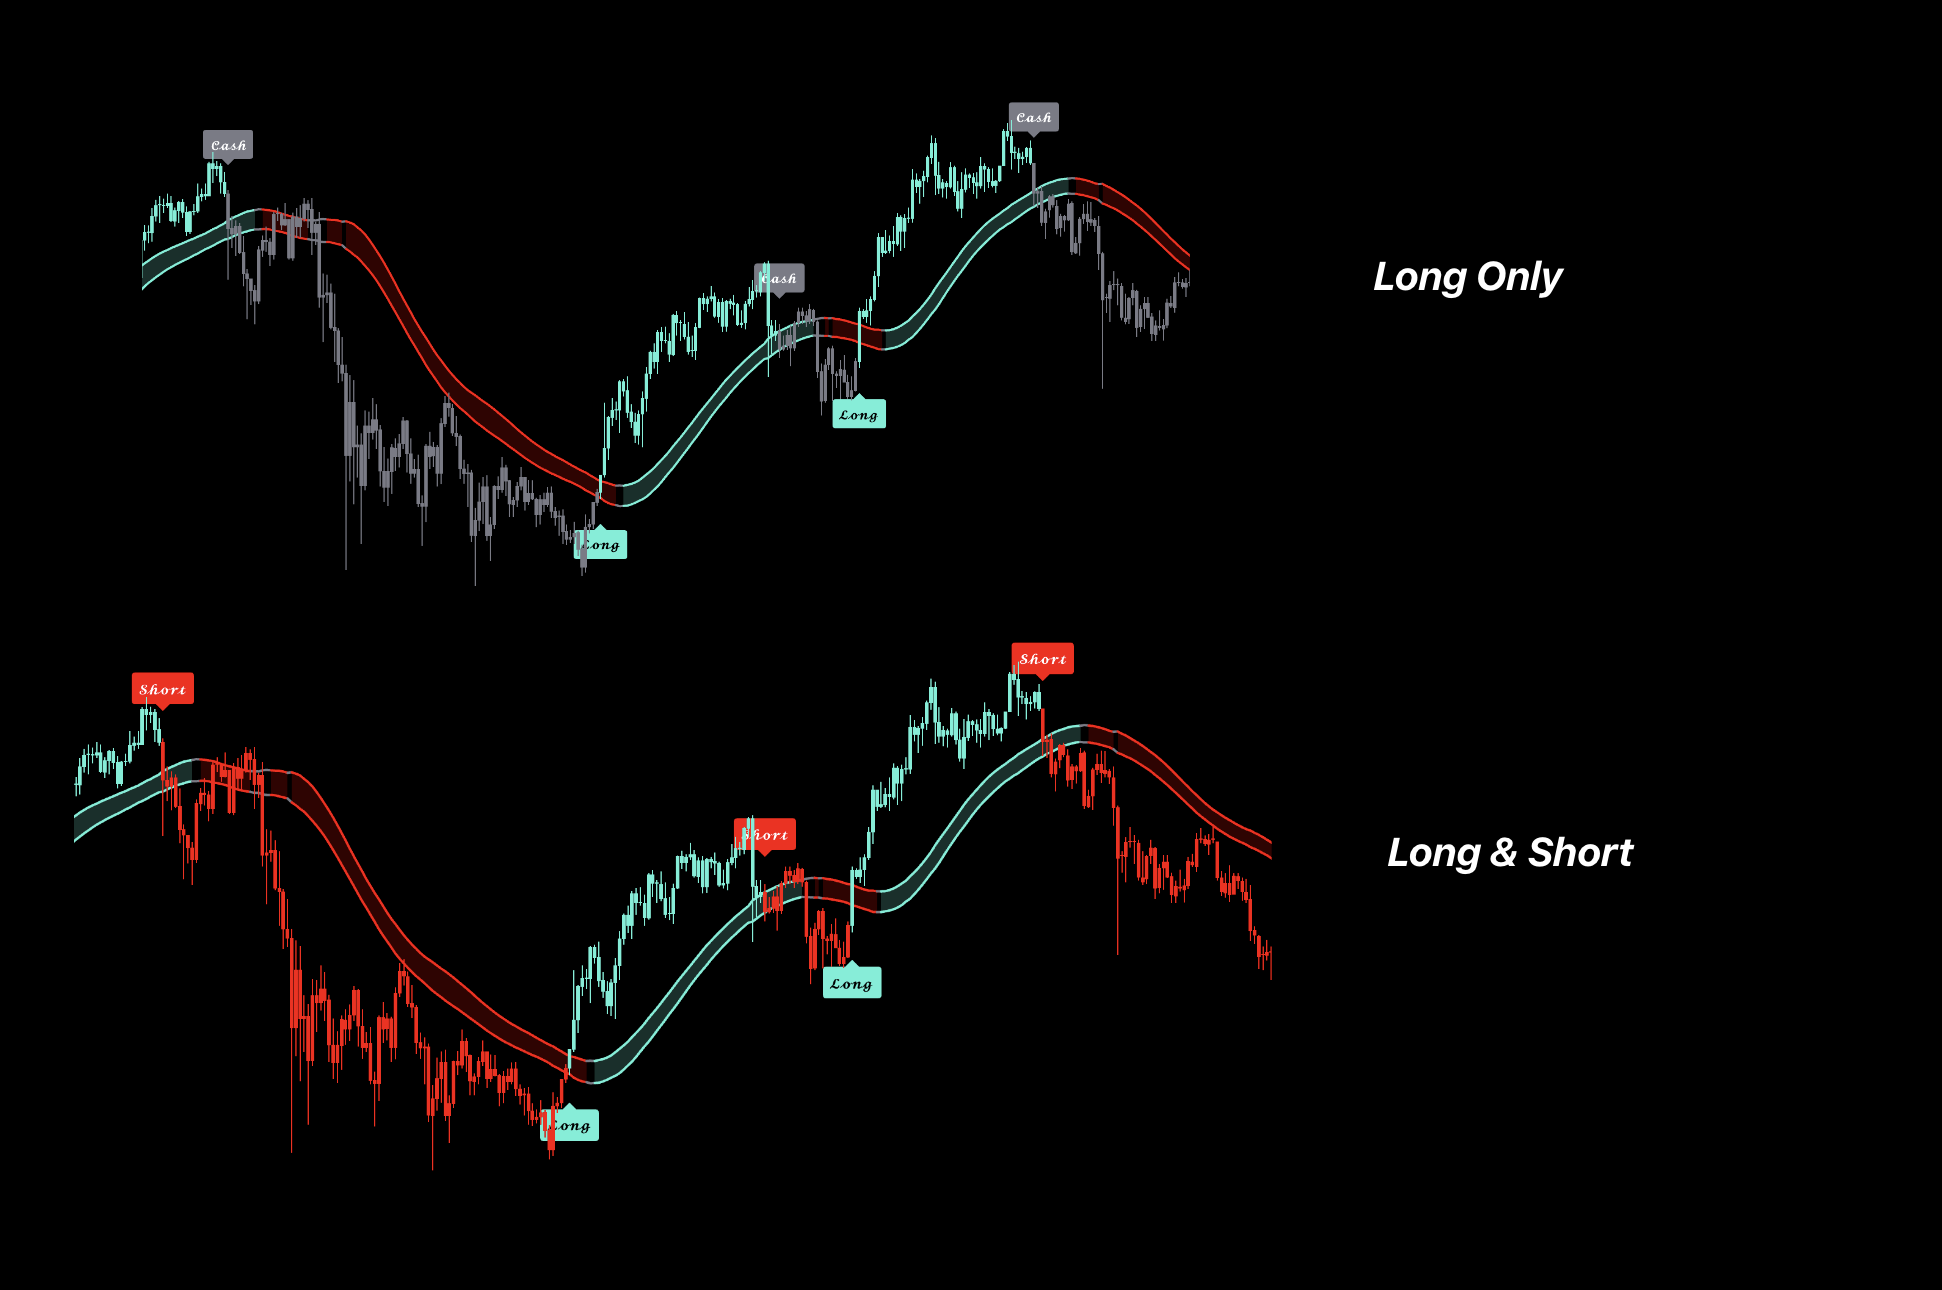
ATR Model
Follow the active trend state, place risk at the opposing ATR Band, and manage profit at projected levels.
Introduction
ATR Model gives one active instruction—Long, Short, or Cash—plus volatility bands, projected levels, and a verdict table for confidence.
How to Use
1. Daily Signal Trading
Use the 1D chart with the default signal setup and follow the confirmed Long or Short direction.
Choose one stop method before entering: below or above the opposing band, an ATR-based stop, or beyond the latest Swing High / Low.
Take partial profit at approximately 1R, 2R, and 3R.
If a projected level, support, or resistance is closer than a fixed target, use that nearby structure as the practical profit area instead.
Keep the selected stop and target plan consistent for the full trade.
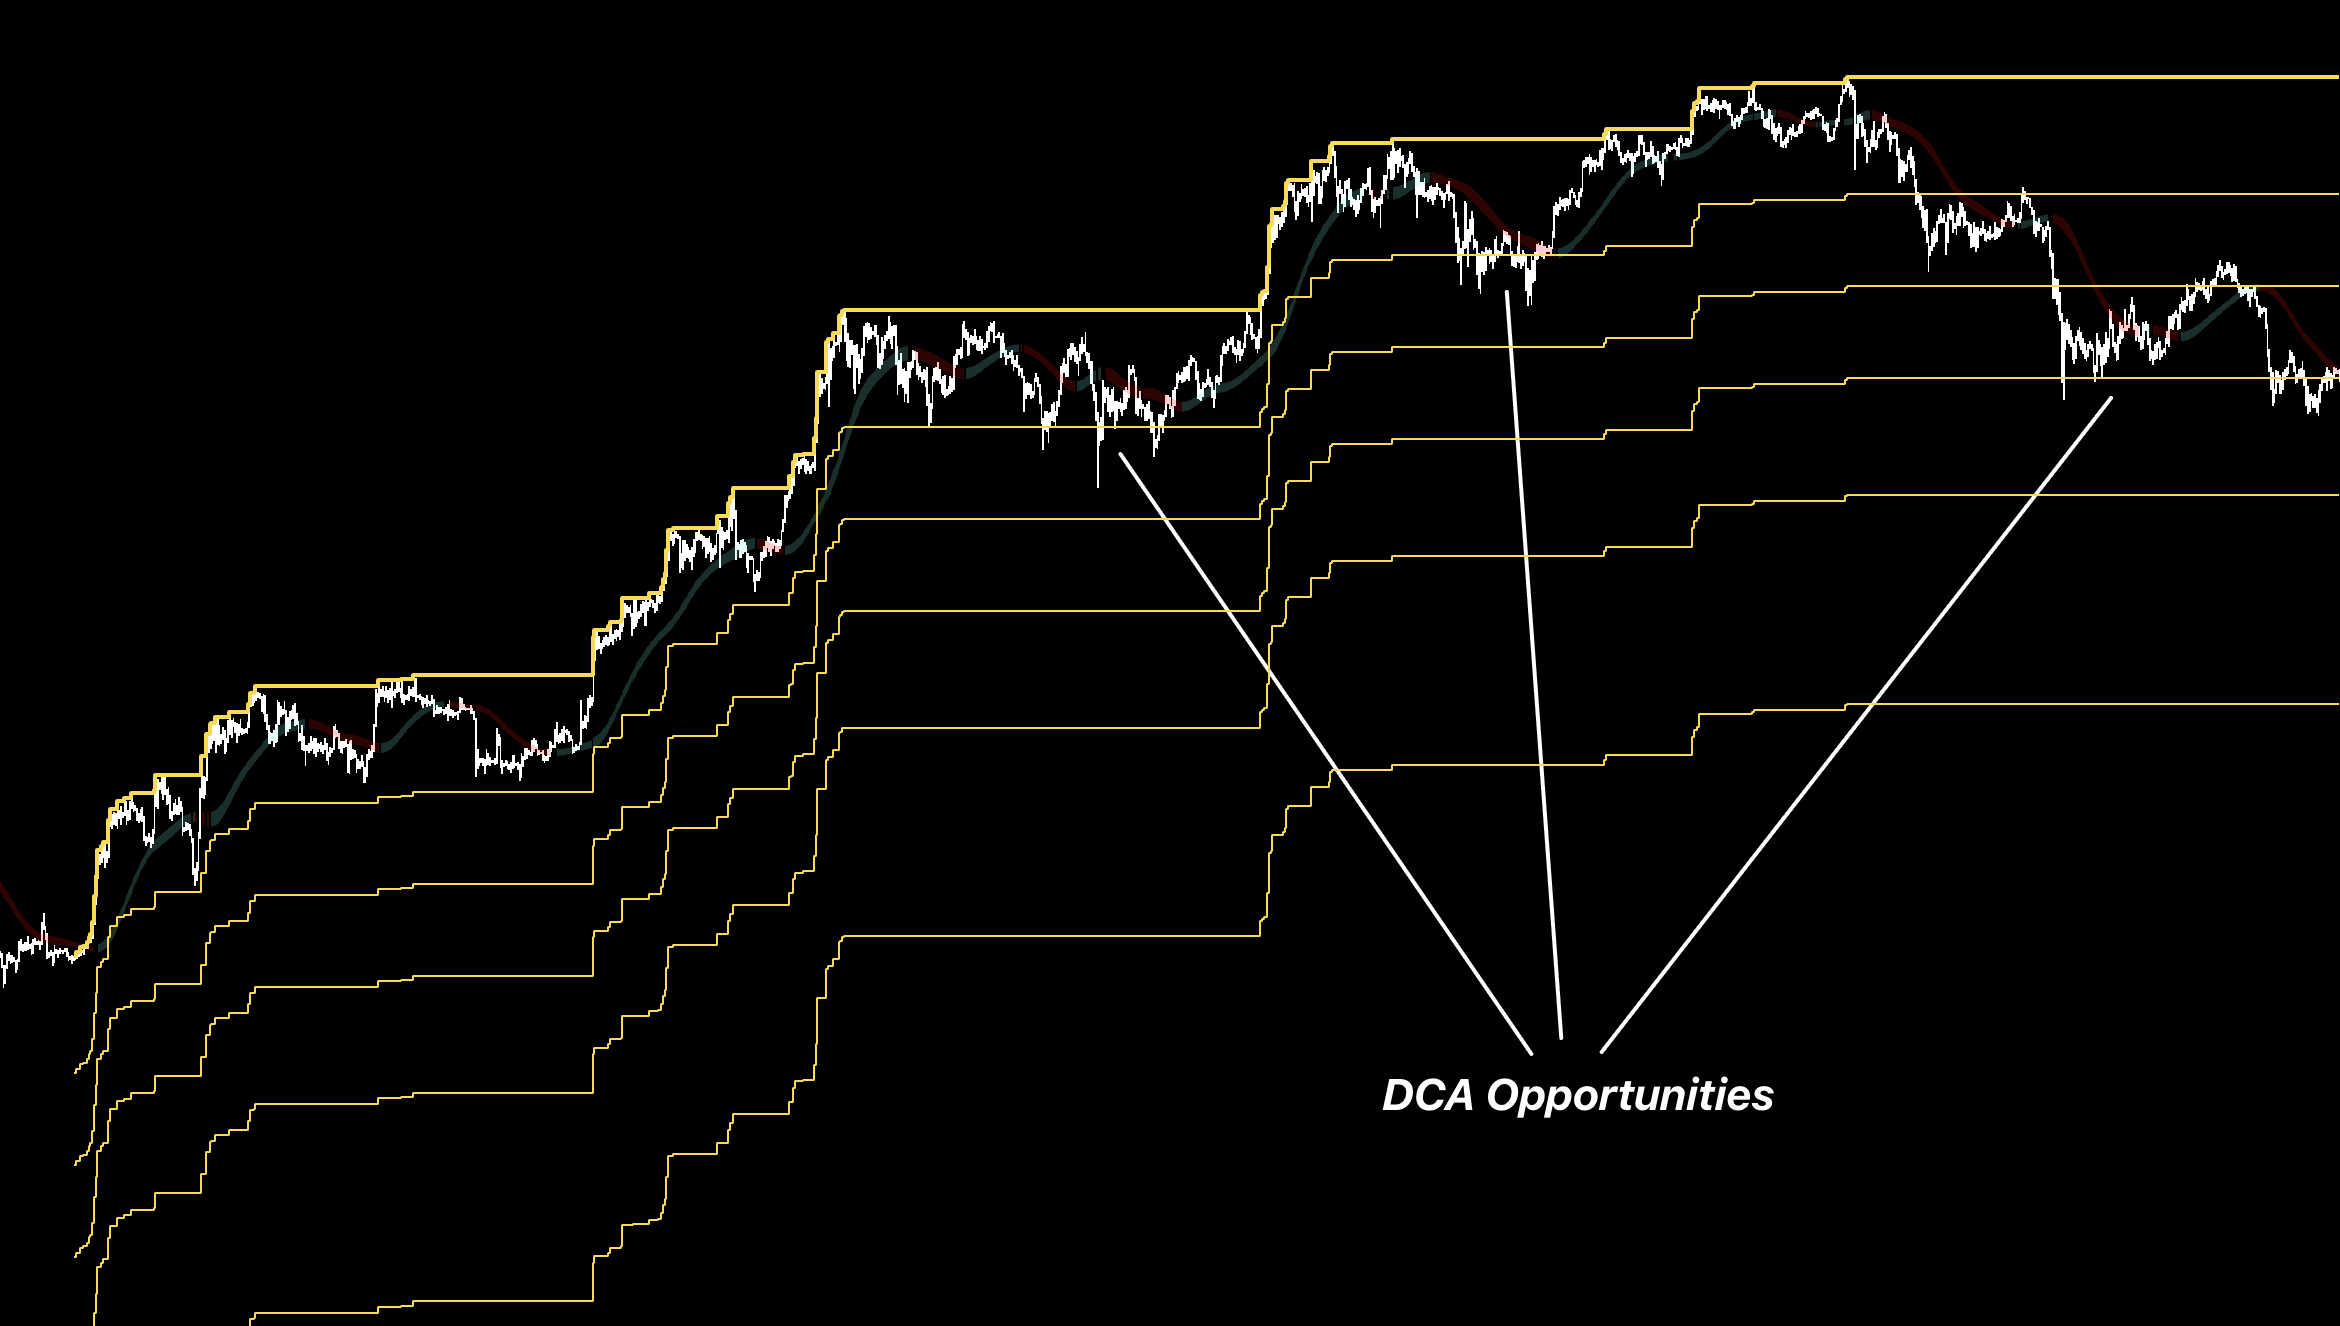
2. Long-Term DCA Planning — Daily or Higher
Use the 1D, Weekly, or another higher timeframe and zoom out to see the complete projected level structure.
Treat the levels below price as potential future scale-in zones rather than one exact all-in entry.
Divide the planned capital between multiple levels and review the next level before adding another allocation.
Use the active state and Verdict table as context for how aggressively to scale, not as a promise that a level must hold.
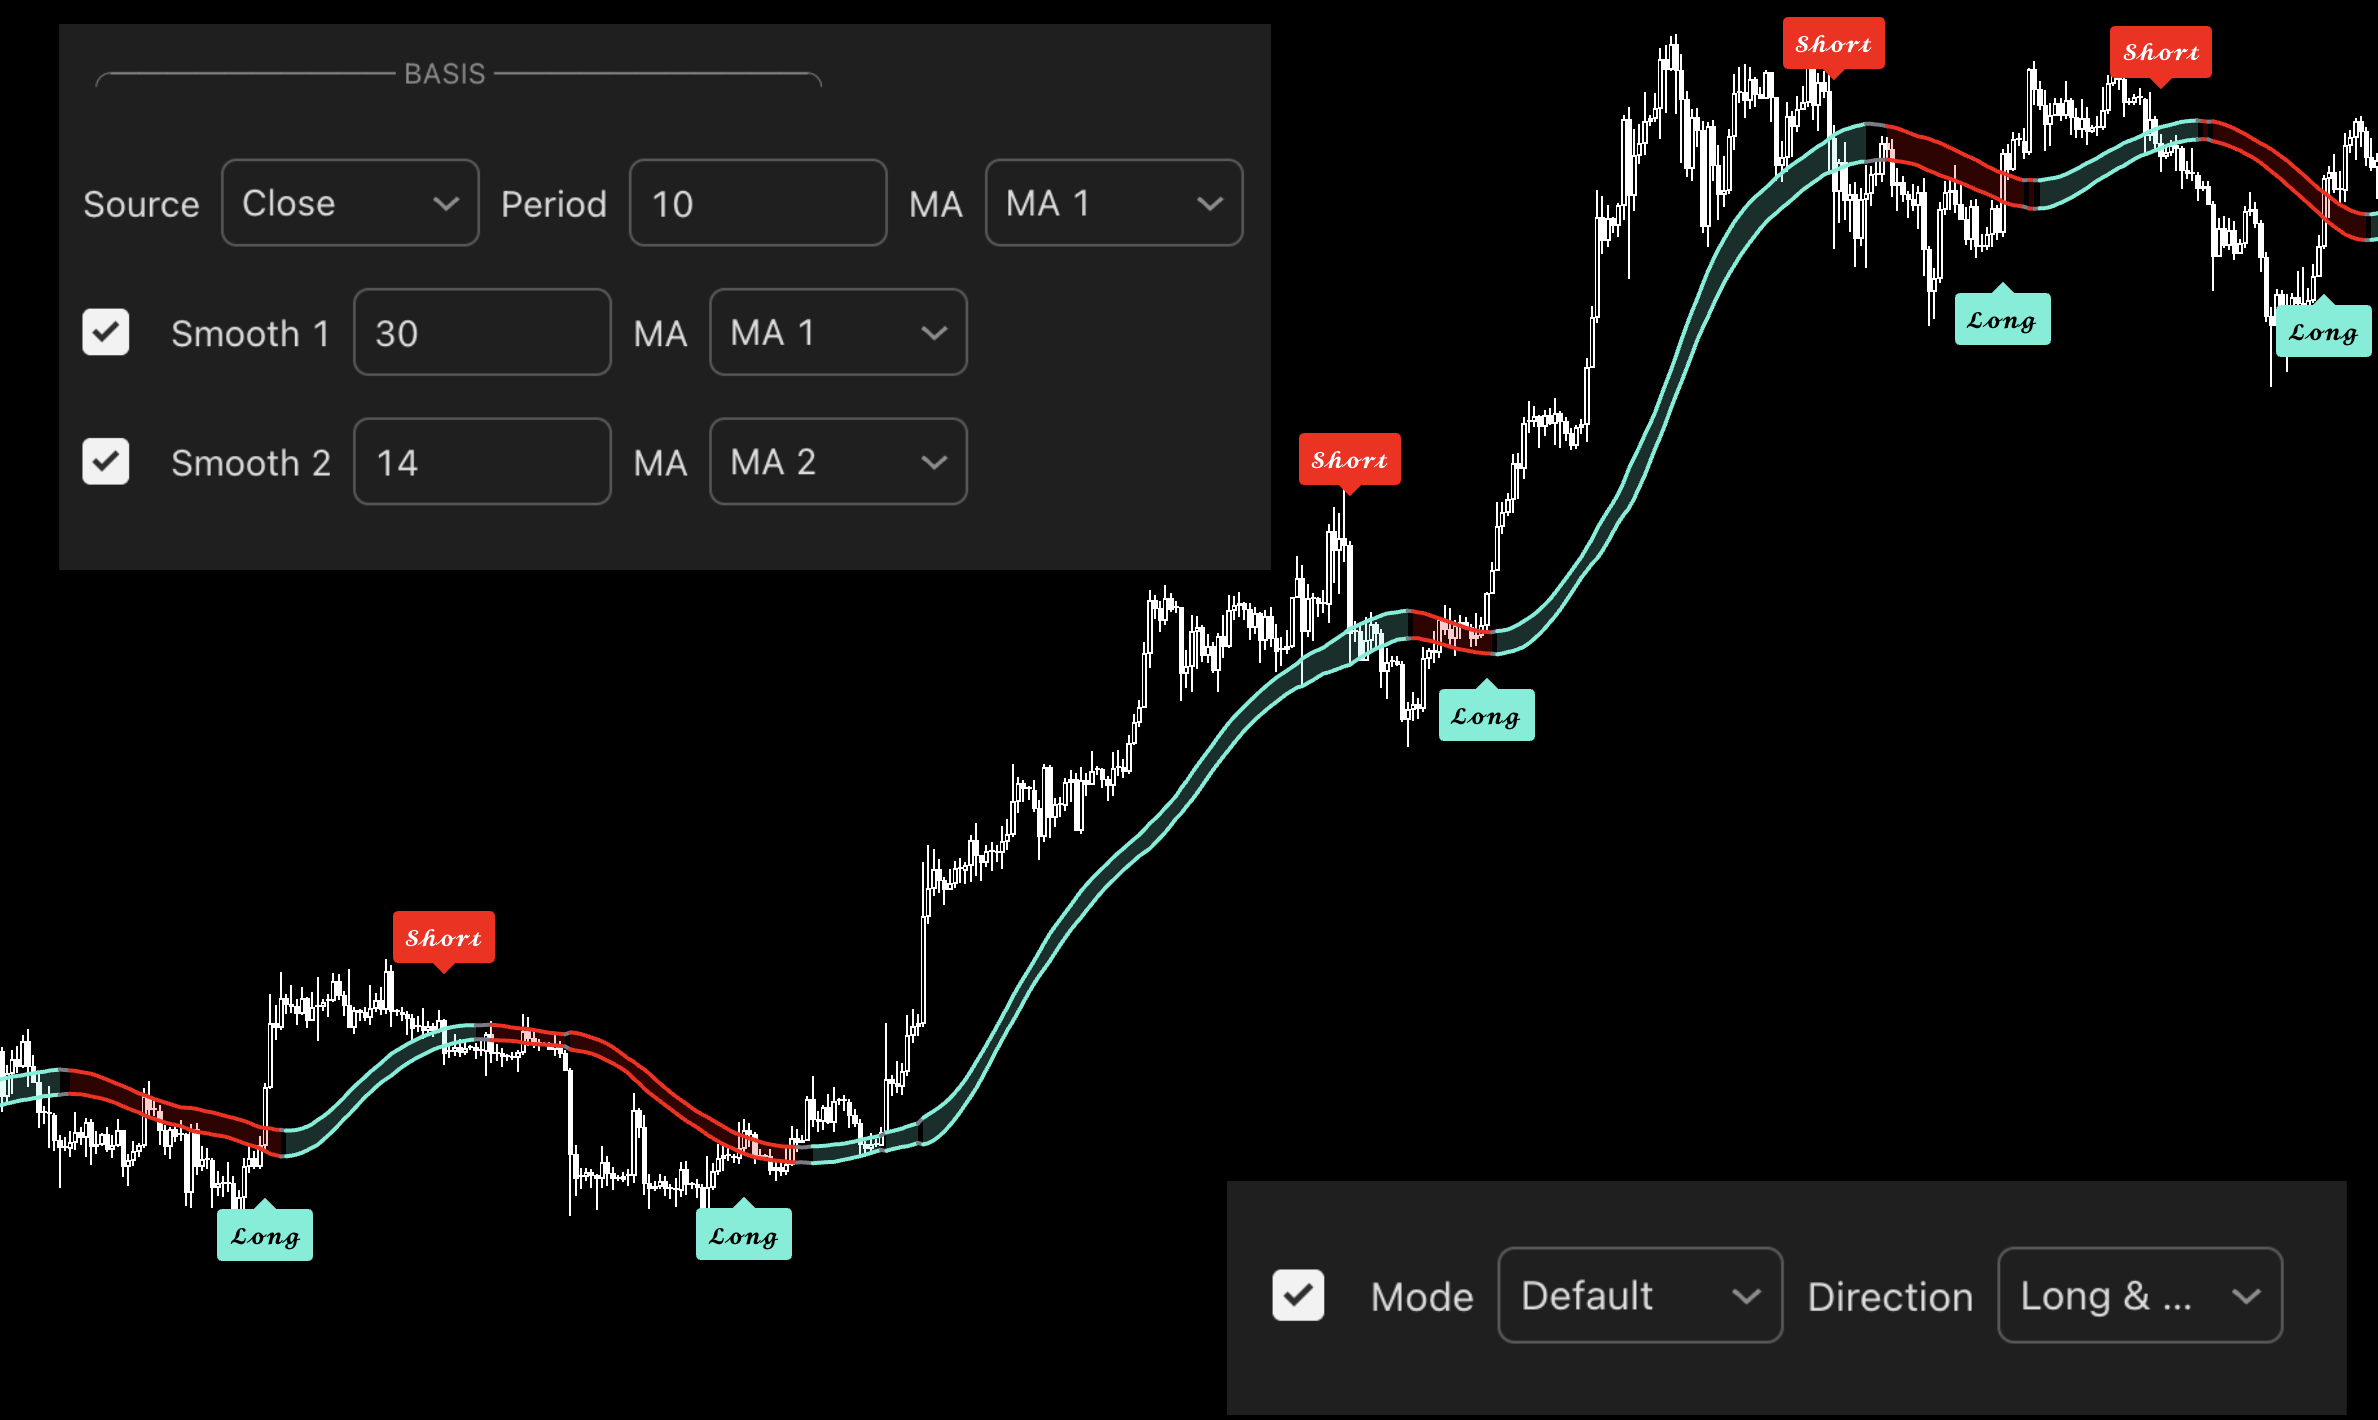
3. Custom System Building
Choose Default, Cloud Close, or Final Verdict Mode as the starting behavior for the system.
Adjust smoothing and the number of moving averages to change the balance between responsiveness and noise: fewer or faster averages react earlier, while more or slower averages create smoother confirmation.
Use the Verdict table to compare agreement and decide whether it acts as a filter, a confidence check, or the main system state.
Keep the bands and projected levels only when they have a defined job such as stop placement, scale-in planning, or profit-taking.
Change and test one input group at a time before combining it into the final system.
Features
Default Mode
Use as the complete starting signal mode.
Cloud Close Mode
Use for simpler state changes based on price and band structure.
Final Verdict Mode
Use for the most selective workflow based on combined agreement.
Trade Direction
Use Long & Short for both sides or Long Only when bearish states should become Cash.
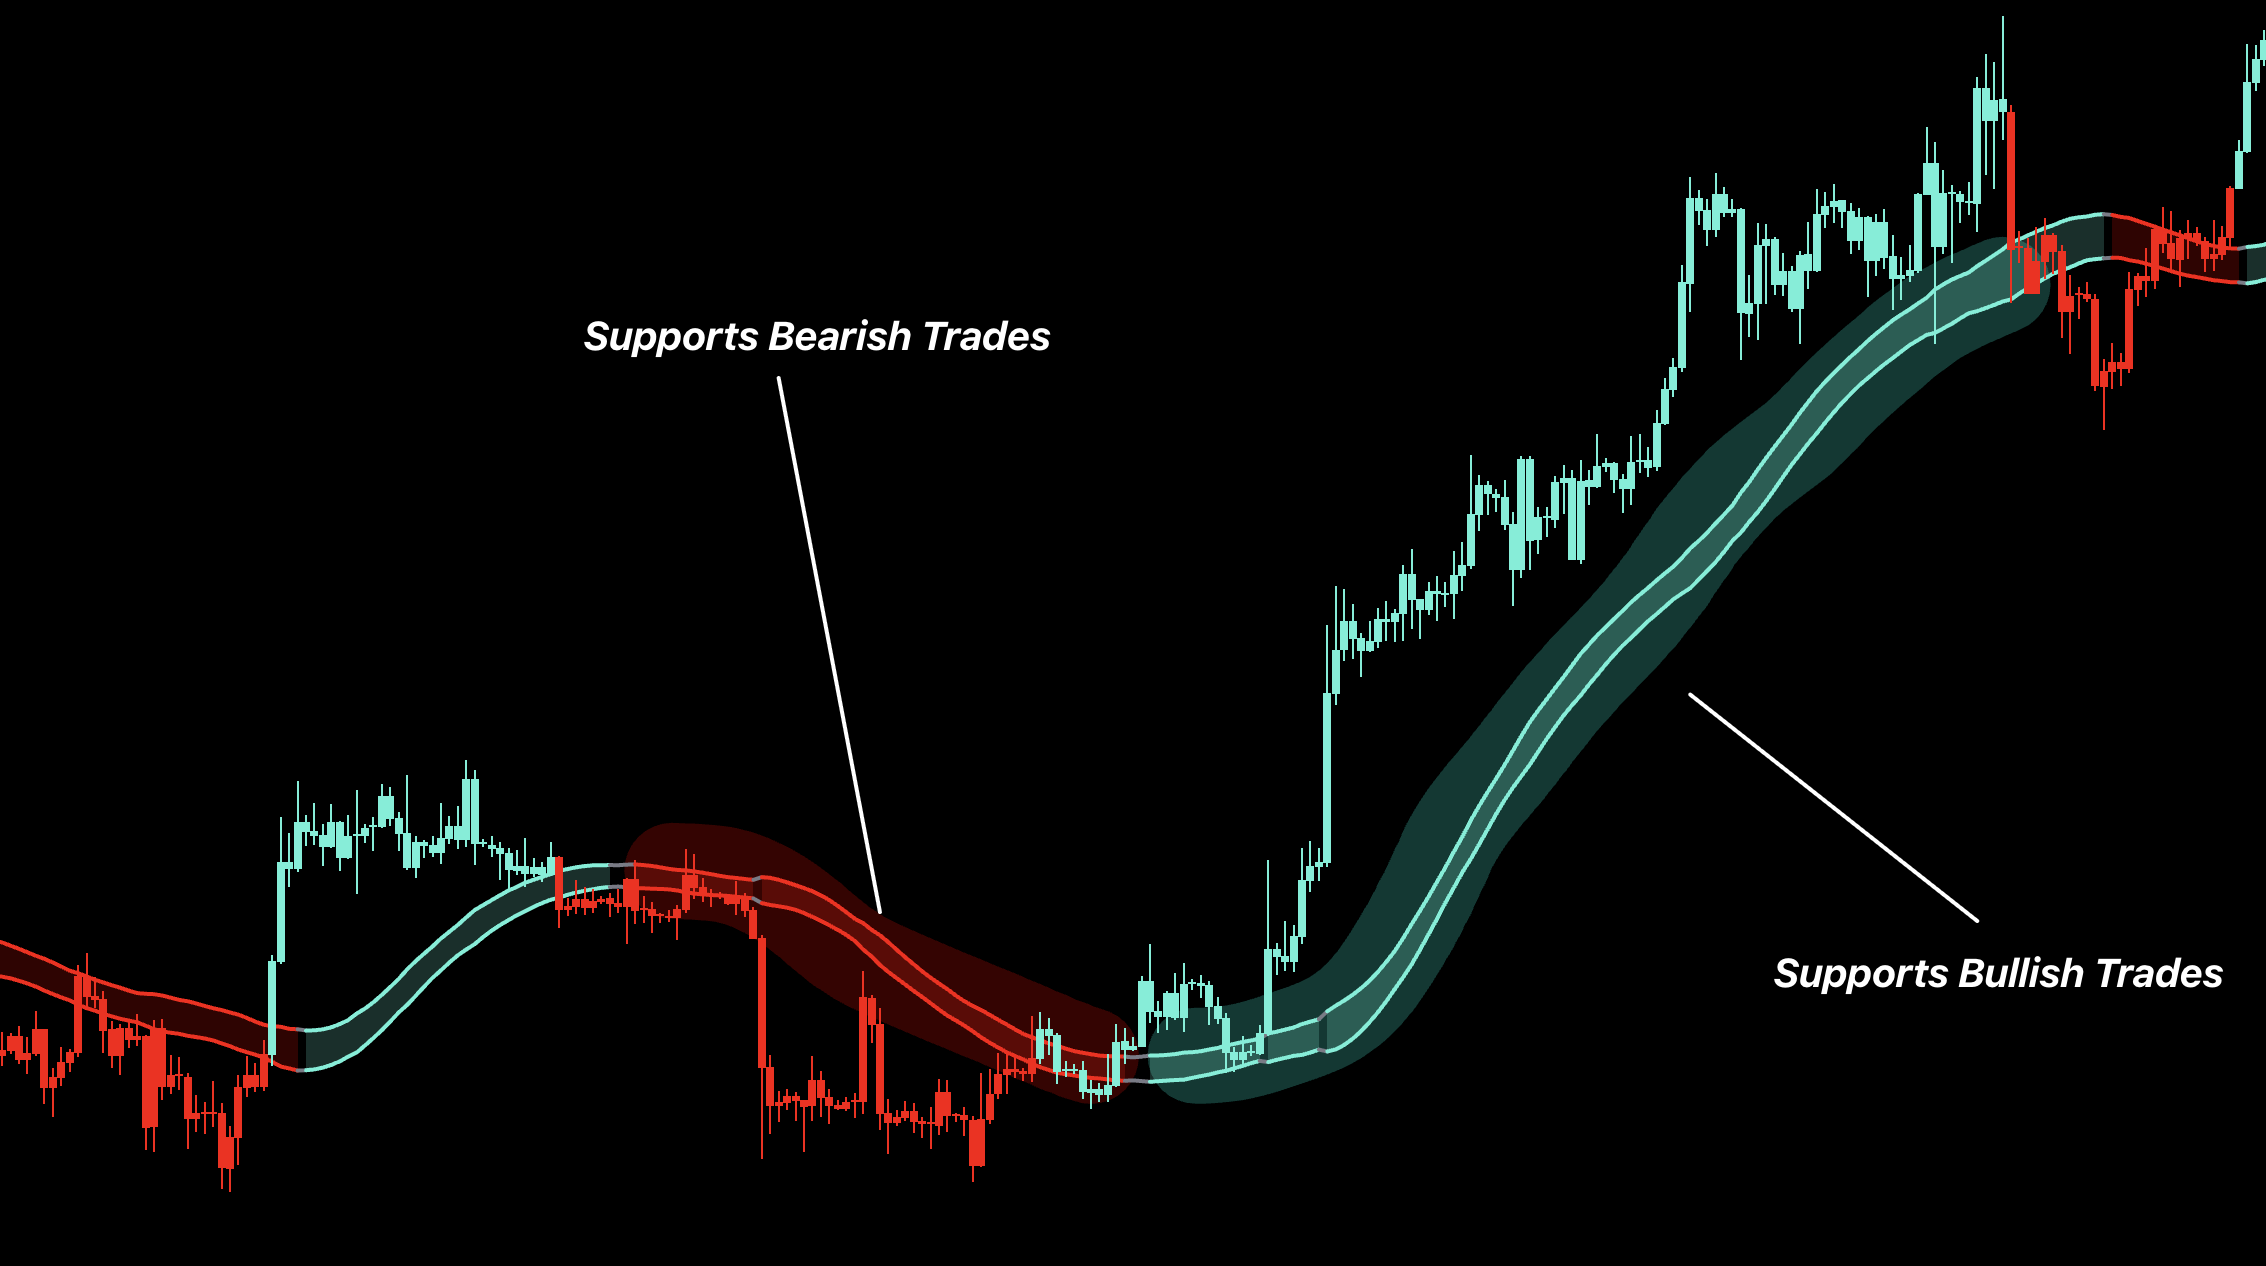
ATR Bands
Place stops at the opposing band and reduce conviction when both bands flatten.
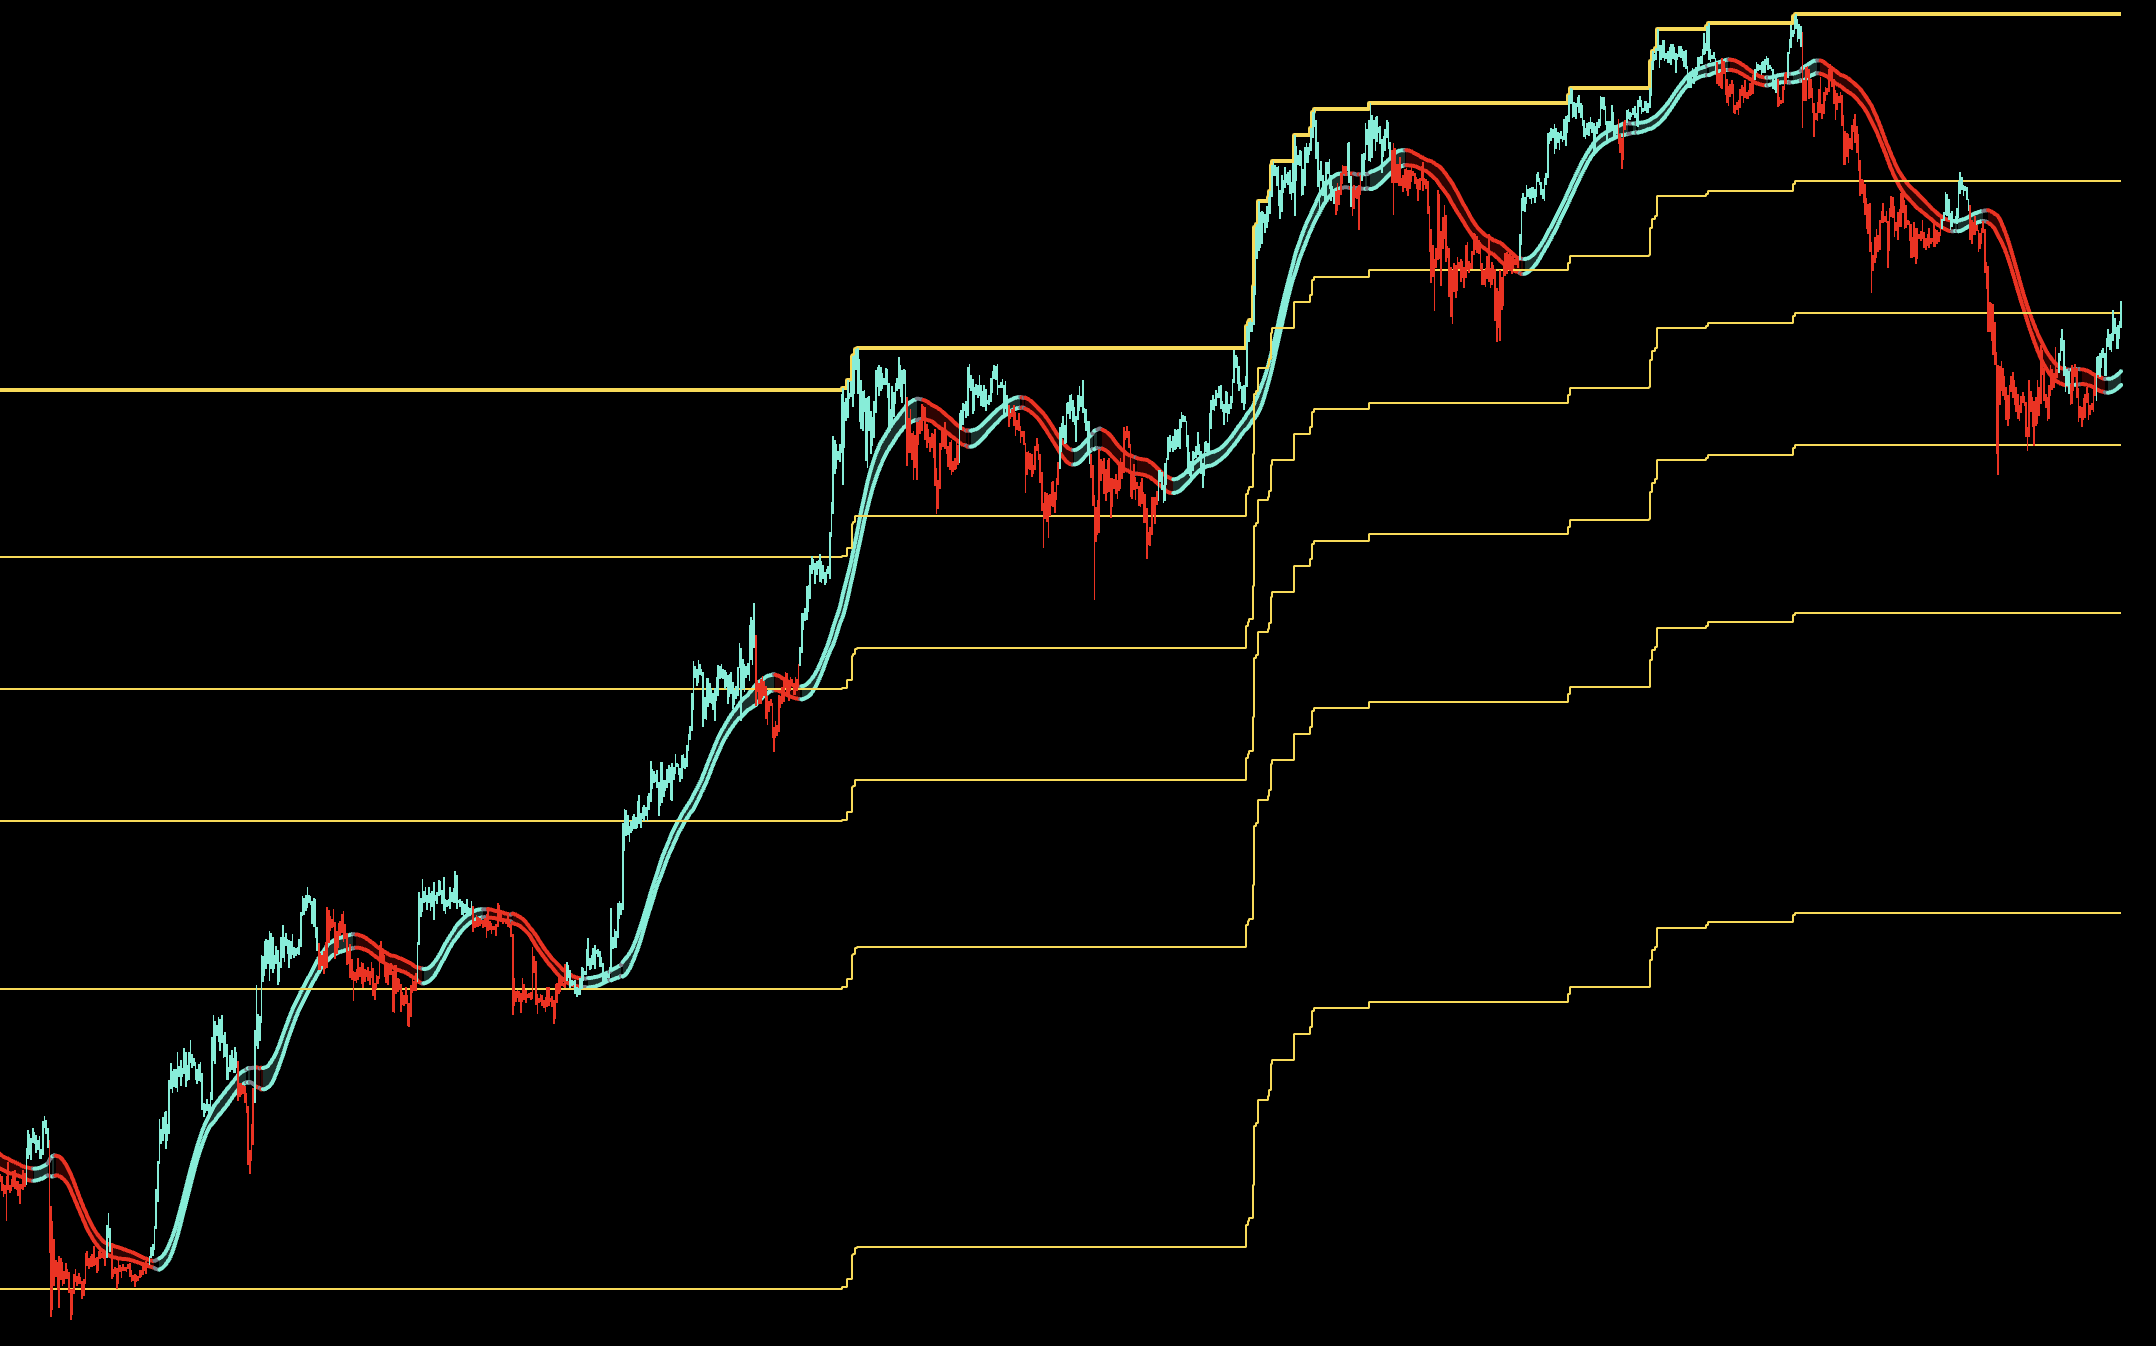
Projected Levels
Use each next level as a reaction and partial-profit area.
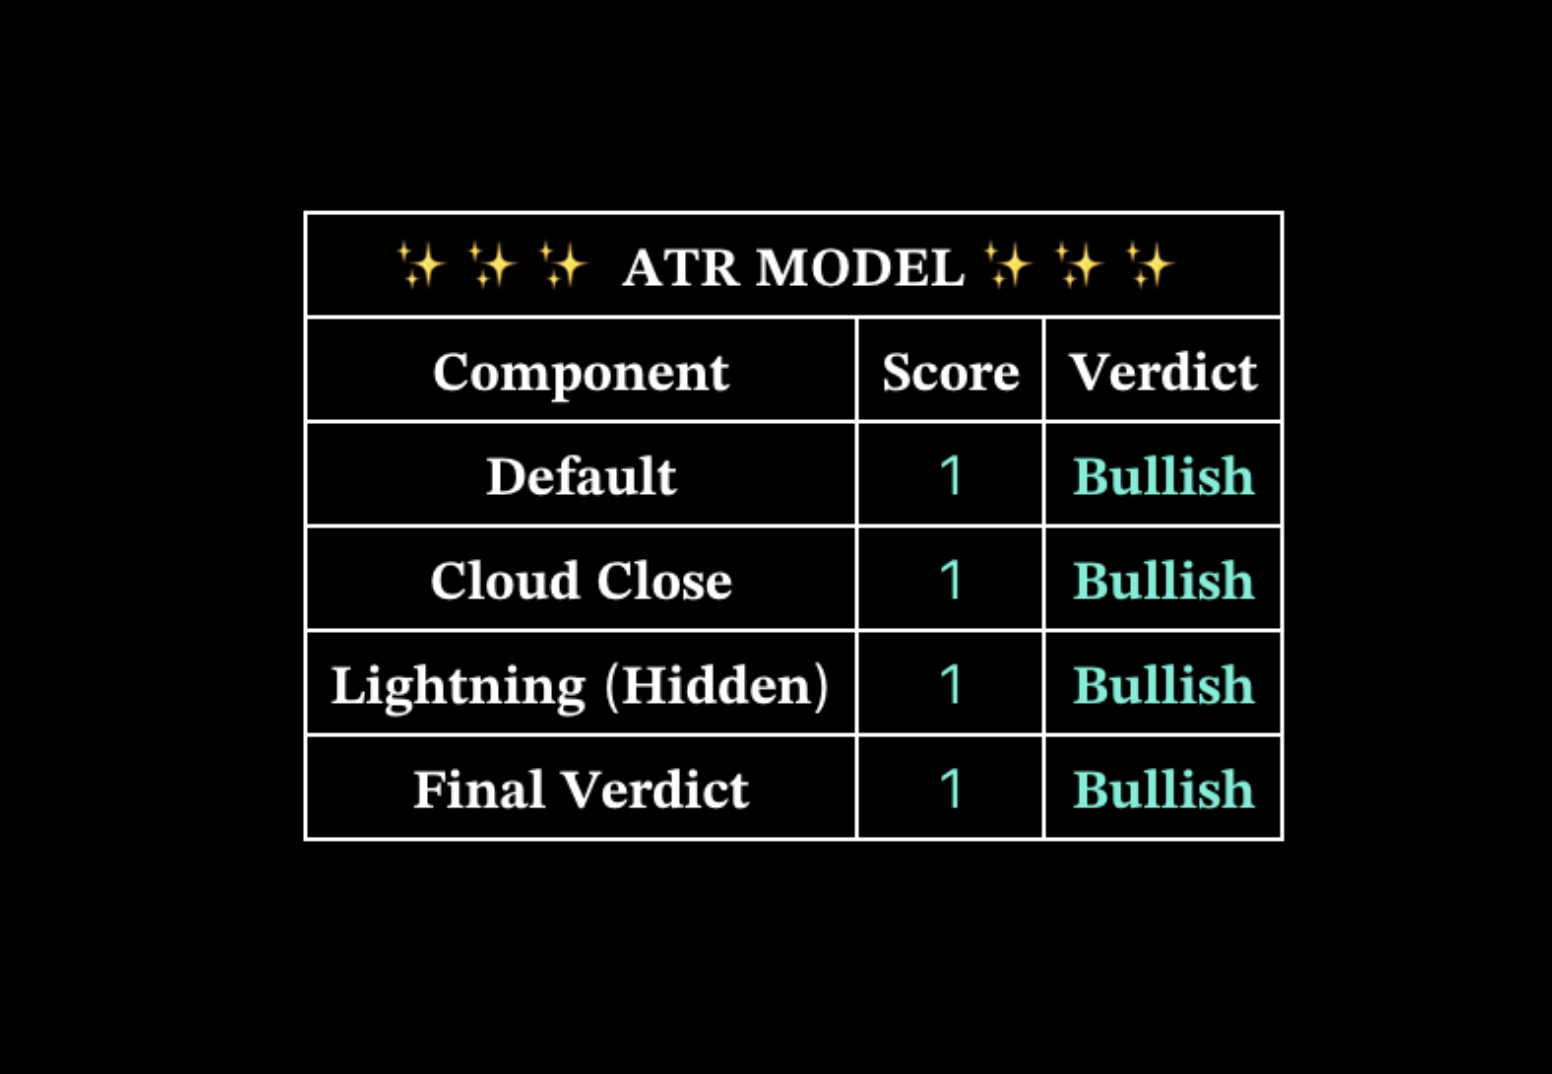
Verdict Table
Use agreement as confidence and mixed readings as a reason to wait or reduce size.
How to Adjust the Inputs
Goal
Adjustment
Standard use
Default Mode with bands and Verdict visible.
Spot-only use
Long Only so bearish states become Cash.
Faster signal system
Use fewer or faster moving averages; expect earlier changes and more noise.
Smoother signal system
Use more or slower moving averages; expect later but steadier confirmation.
Stop placement
Choose the opposing band, ATR distance, or Swing High / Low, then reduce size if the selected stop is wider.
Broader targets
Use a broader level anchor; keep it relevant to the chart timeframe.
Recommended
Best For
Daily confluence and long-term level planning.
Recommended Setup
Zoom out, use the projected levels as future buy/reaction zones, and confirm direction with Oracle Metrics when useful.
Why
The levels help map where the next meaningful long-term opportunity or reaction may occur.
Trend
Majors Directional Bias Pro
Choose the correct signal engine, confirm direction, and secure profit before slower modes reverse.
Introduction
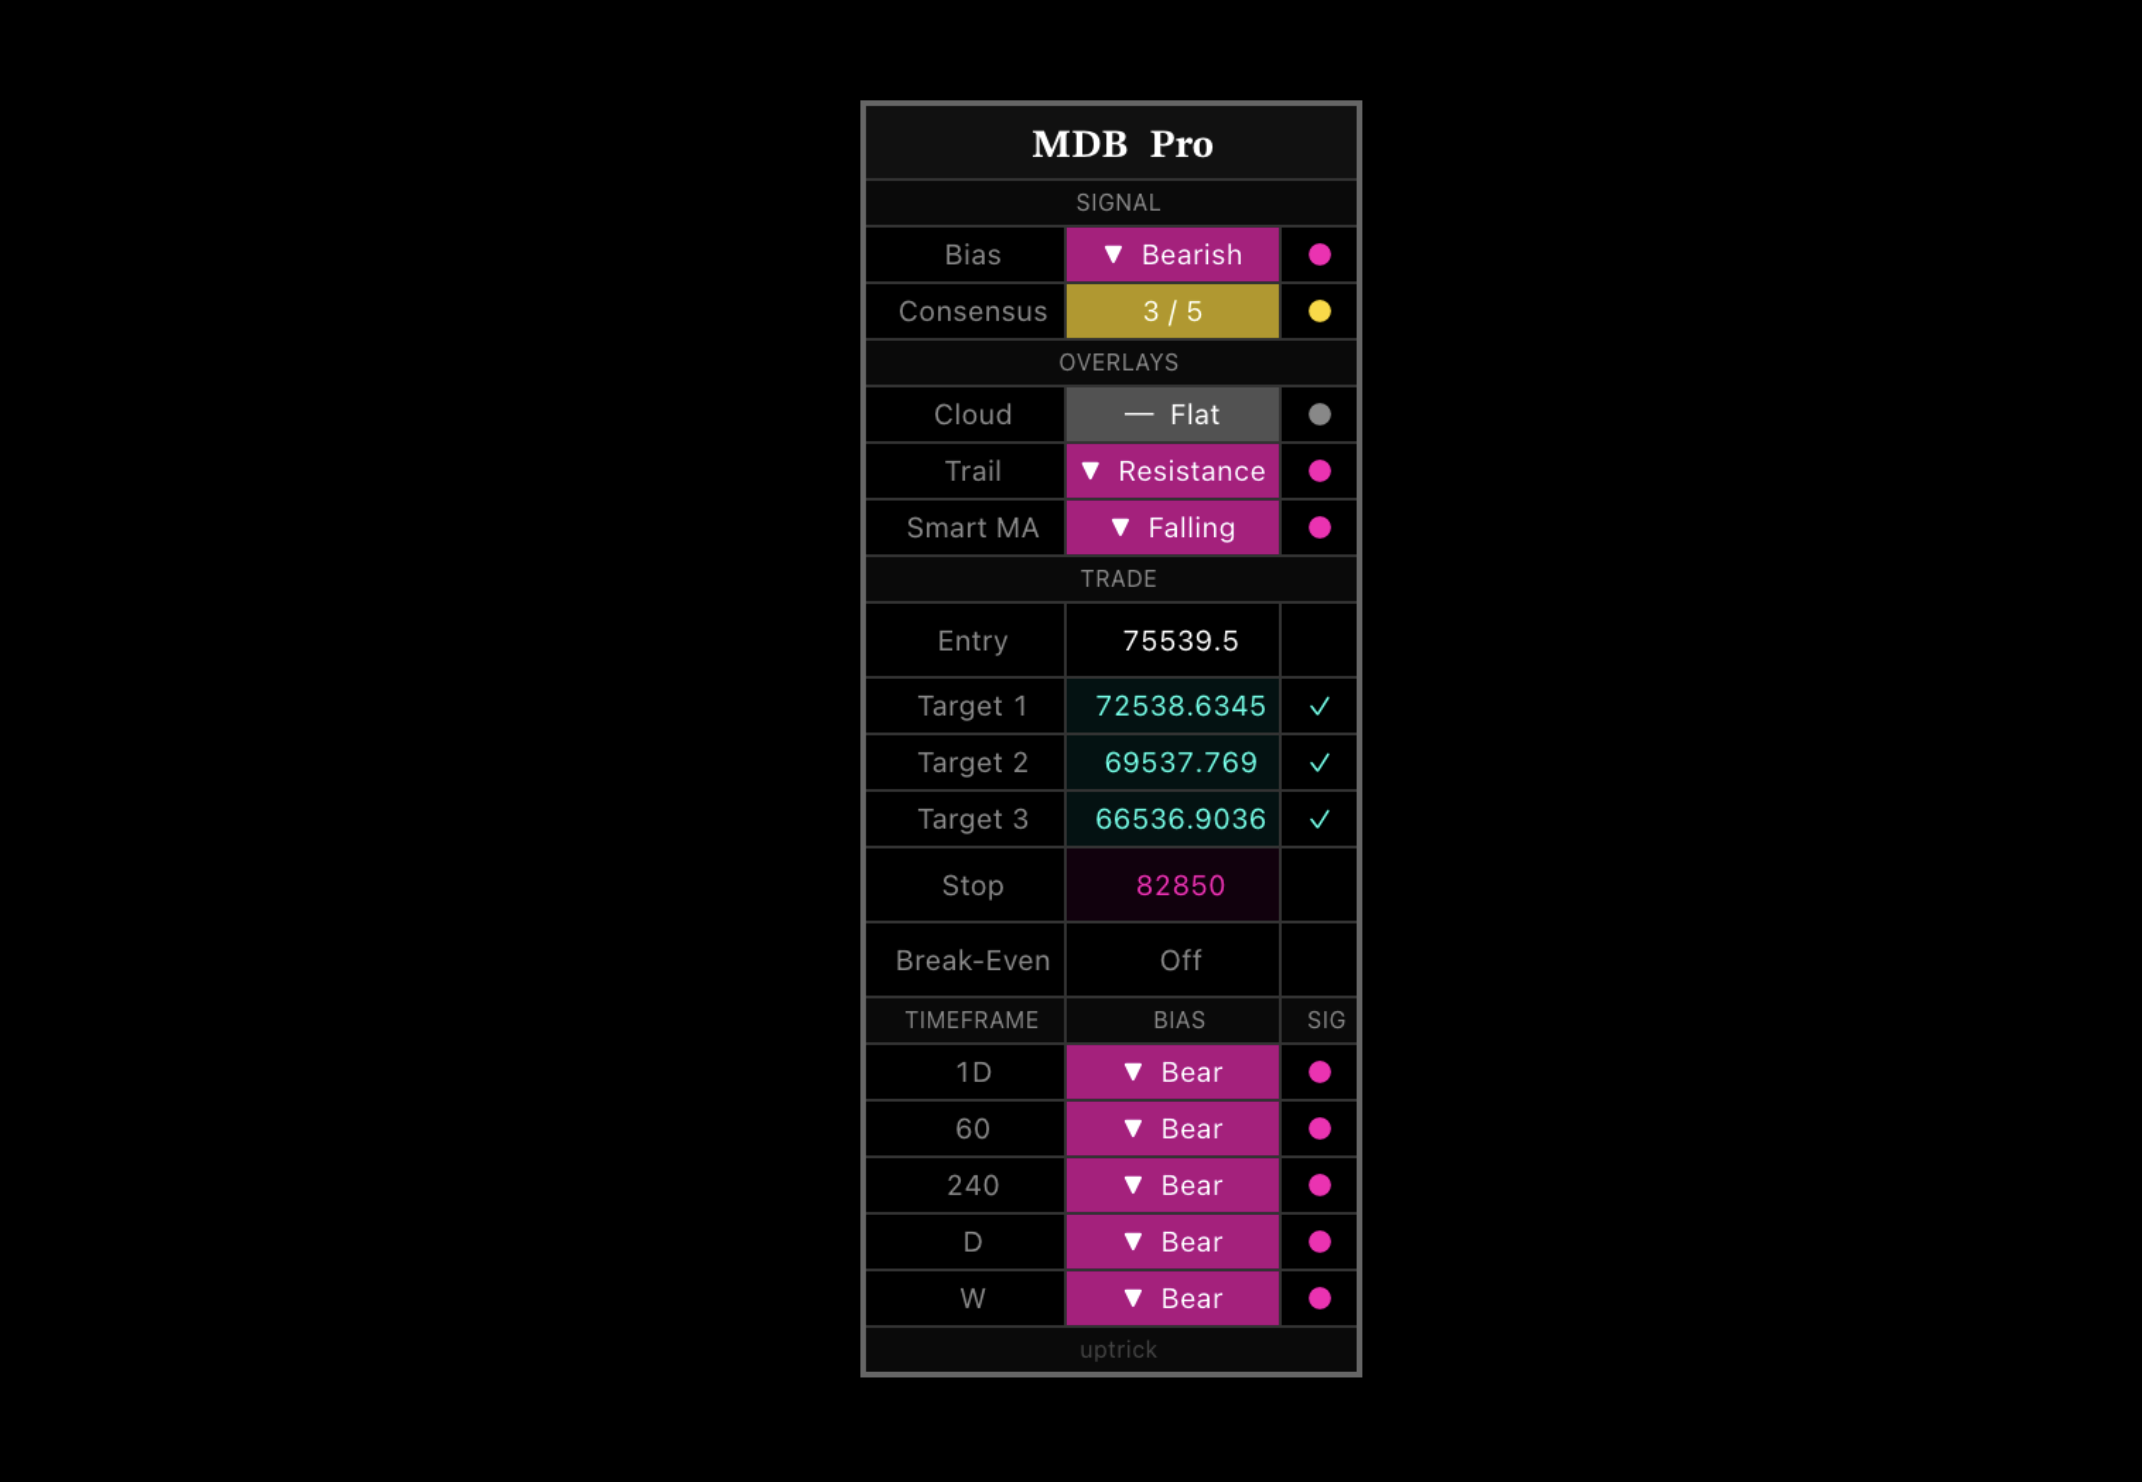
MDB turns direction into a complete trade plan. The signal is the trigger; overlays help with confirmation, stops, and targets.
How to Use
1
Match mode to timeframe. Classic for Daily or higher; Precision or Conviction for lower timeframes.
2
Follow the confirmed Long or Short. Use the dashboard or one overlay to reject weak disagreement.
3
Choose one stop reference. Trade Levels, Dynamic Trail, or the opposite Smooth Wave.
4
Take TP1–TP3 and Outer-Band profits. Slower modes can exit late, so do not wait only for the opposite signal.
5
Protect the remainder. Move to break-even after TP1 when enabled and use Dynamic Exit after TP3.
Signal Modes
Classic
Use on Daily or higher for larger directional moves.
Precision
Use on lower timeframes when adjustable filtering and reasonable frequency are needed.
Conviction
Use on lower timeframes when the strictest, latest confirmation is preferred.
Features and Overlays
Bias Candles and Signal Labels
Use the Long and Short labels as the entry trigger. Candle color keeps the active directional state visible between signals, so a trade against the color should be treated as countertrend rather than as an equally strong setup.
Outer Bands
Use the outer zones primarily for profit-taking: reduce Longs near the upper zone and Shorts near the lower zone. A touch shows extension and a possible reaction area; it is not an automatic reversal entry.
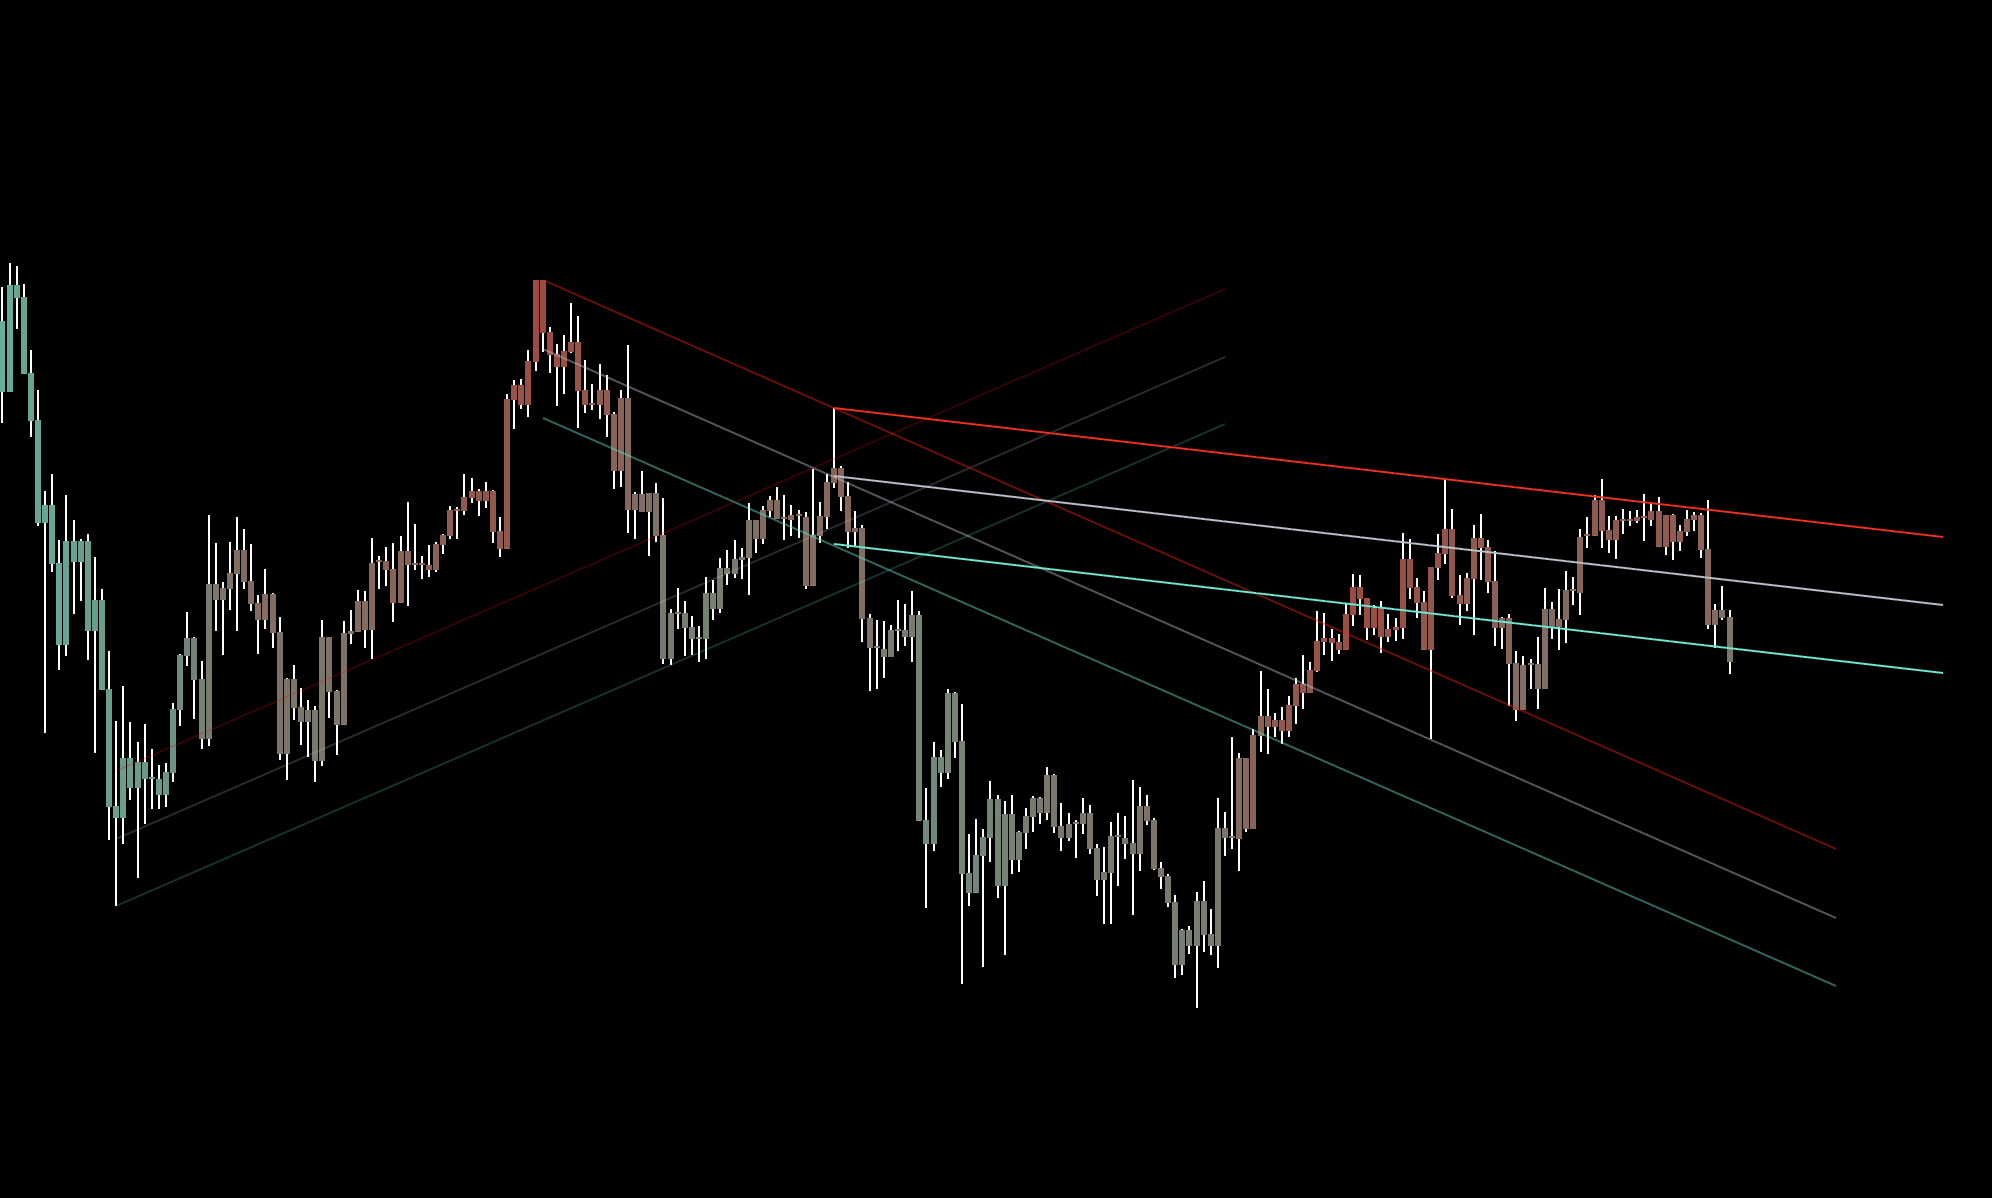
Trend Channel
Use the channel for directional confluence and market-regime identification. A clean directional channel supports trend-following signals, while a compressed or repeatedly crossed channel warns that conditions are mixed or ranging.
Dynamic Trail
In an established trend, use a pullback toward the Trail as a potential buy-in or re-entry area when direction remains intact. For risk management, keep a Long stop below the supportive Trail or a Short stop above it and trail the level as the move develops.
Composite MA
Use the MA as long-term directional confluence and as a deviation reference. Price holding above a rising MA supports Longs, while price below a falling MA supports Shorts. Large distance from the MA shows extension because the average can act as a longer-term price magnet.
Smooth Waves
Use the Waves as moving support and resistance. In a bullish move, a supportive Wave can provide a buy-in or stop reference and upper resistance can be used for profit-taking; reverse the process for Shorts. Take every displayed TP and use the next opposing Wave as an additional exit area.
Dashboard
Use Bias and Consensus for a fast direction check, then review overlay and trade status only when they affect the decision. Mixed readings mean reduce conviction or wait; the dashboard should confirm the setup rather than create a separate entry.
Multi-Timeframe Bias
Use higher-timeframe agreement to filter lower-timeframe signals. Favor trades aligned with the broader bias; if taking a countertrend setup, treat it as lower conviction and use nearer profit targets.
Enable break-even after TP1 when the remaining trade should no longer carry original risk.
Use Dynamic Exit for a runner after TP3.
Inputs and Alerts
Goal
Adjustment
Fewer lower-timeframe signals
Use Conviction or raise confirmation gradually.
More responsive Precision mode
Lower sensitivity carefully; expect more flips.
Wider stop
Increase ATR distance or Swing lookback and reduce position size.
Cleaner setup
Keep only one bias tool and one stop tool visible.
Alerts
Create the Long, Short, TP, Dynamic Exit, and SL alerts used by the selected workflow.
Recommended
Timeframe
Use Classic on the Daily chart, or Precision and Conviction for lower-timeframe trading.
Profit Management
Take every displayed TP. Also reduce or exit Longs at Smooth Wave resistance and Shorts at Smooth Wave support.
Buy-Ins
Use supportive Smooth Wave retests as potential buy-ins when the signal, market regime, and broader direction remain aligned.
Reversal
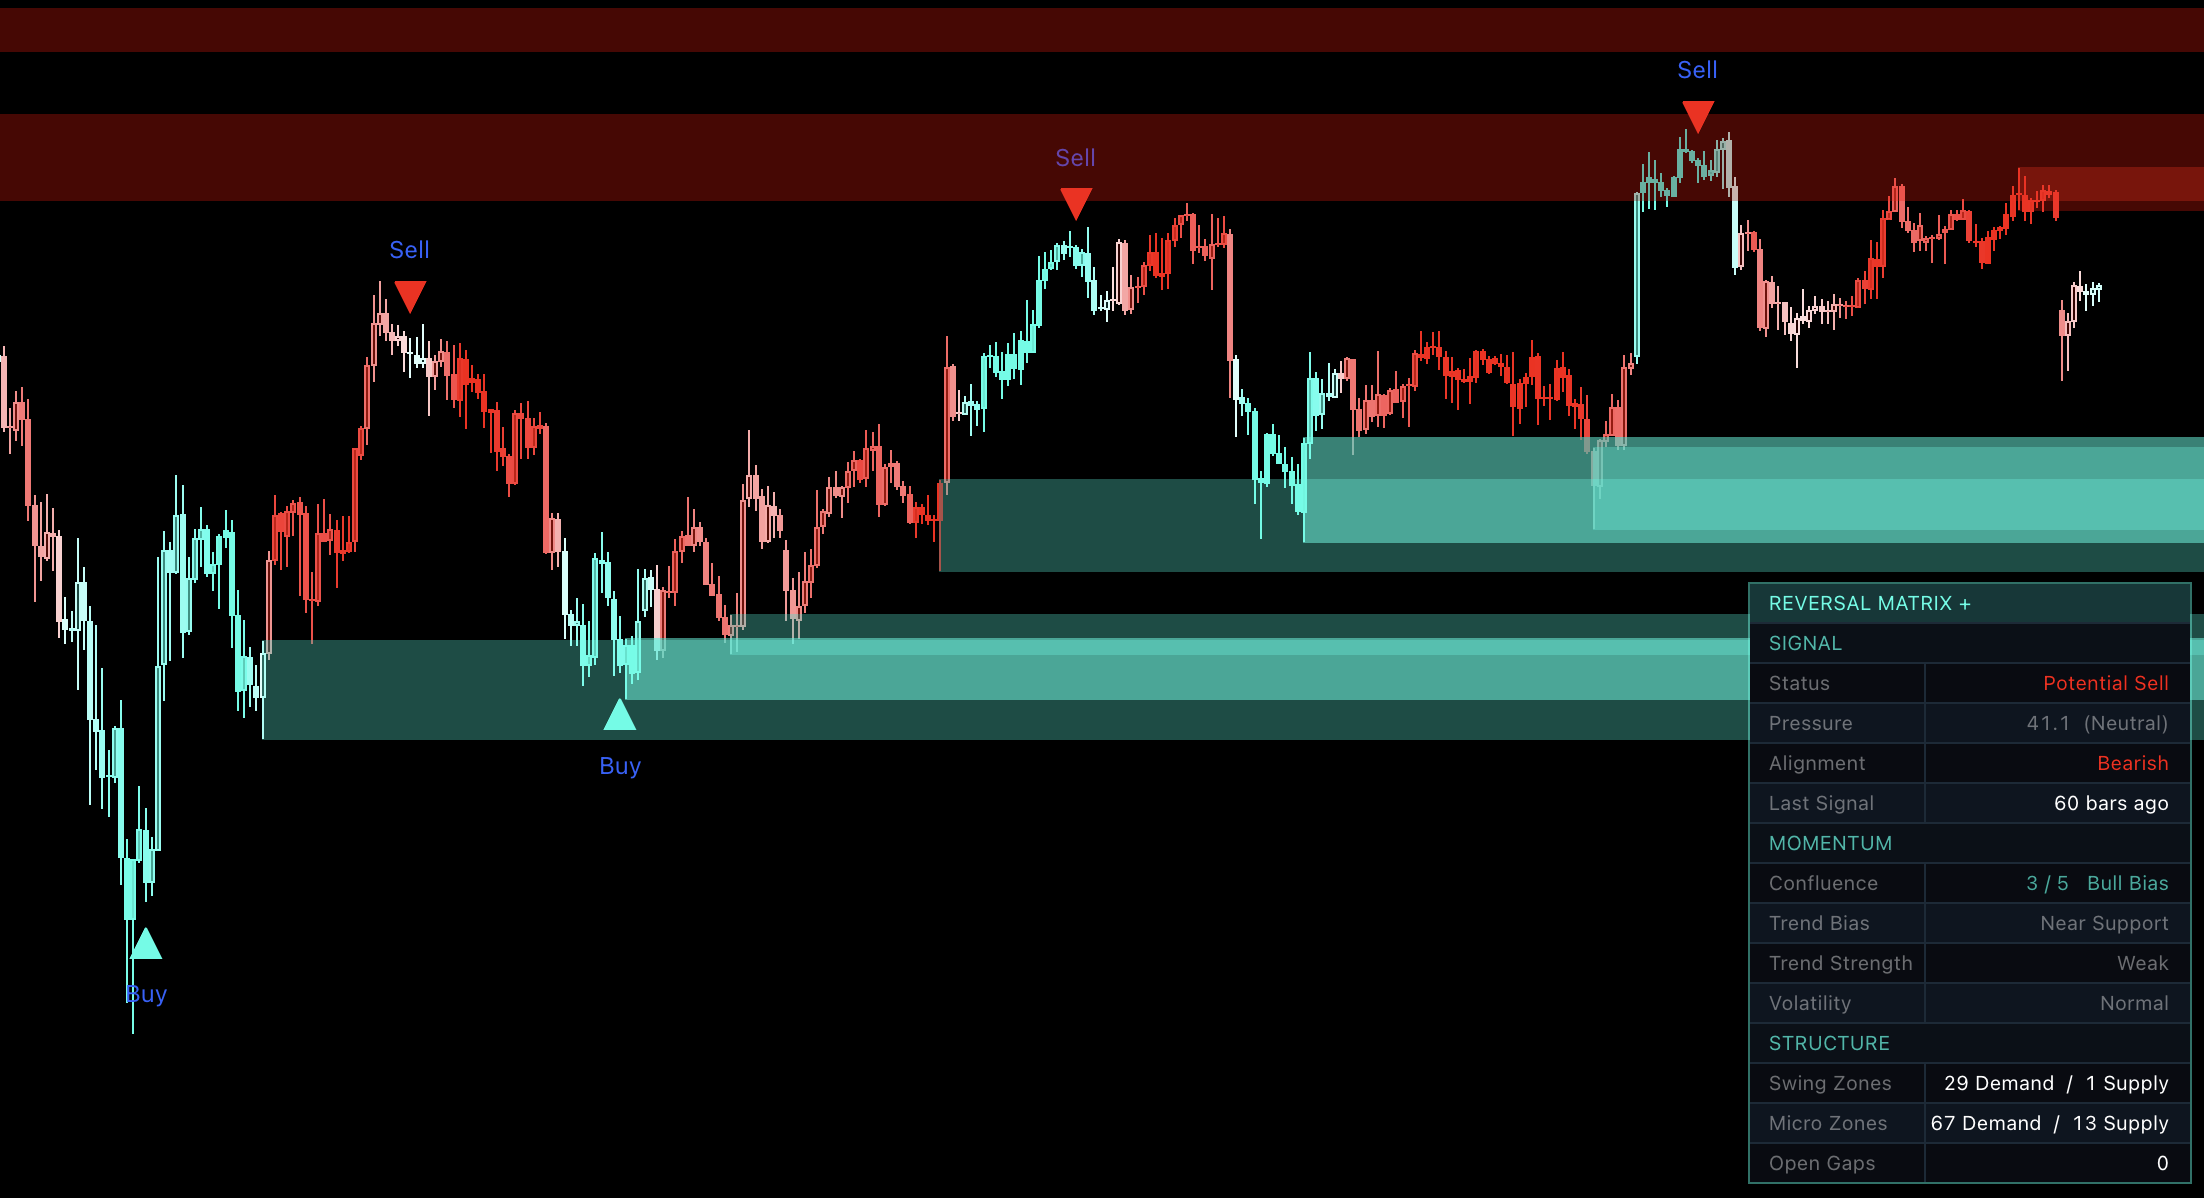
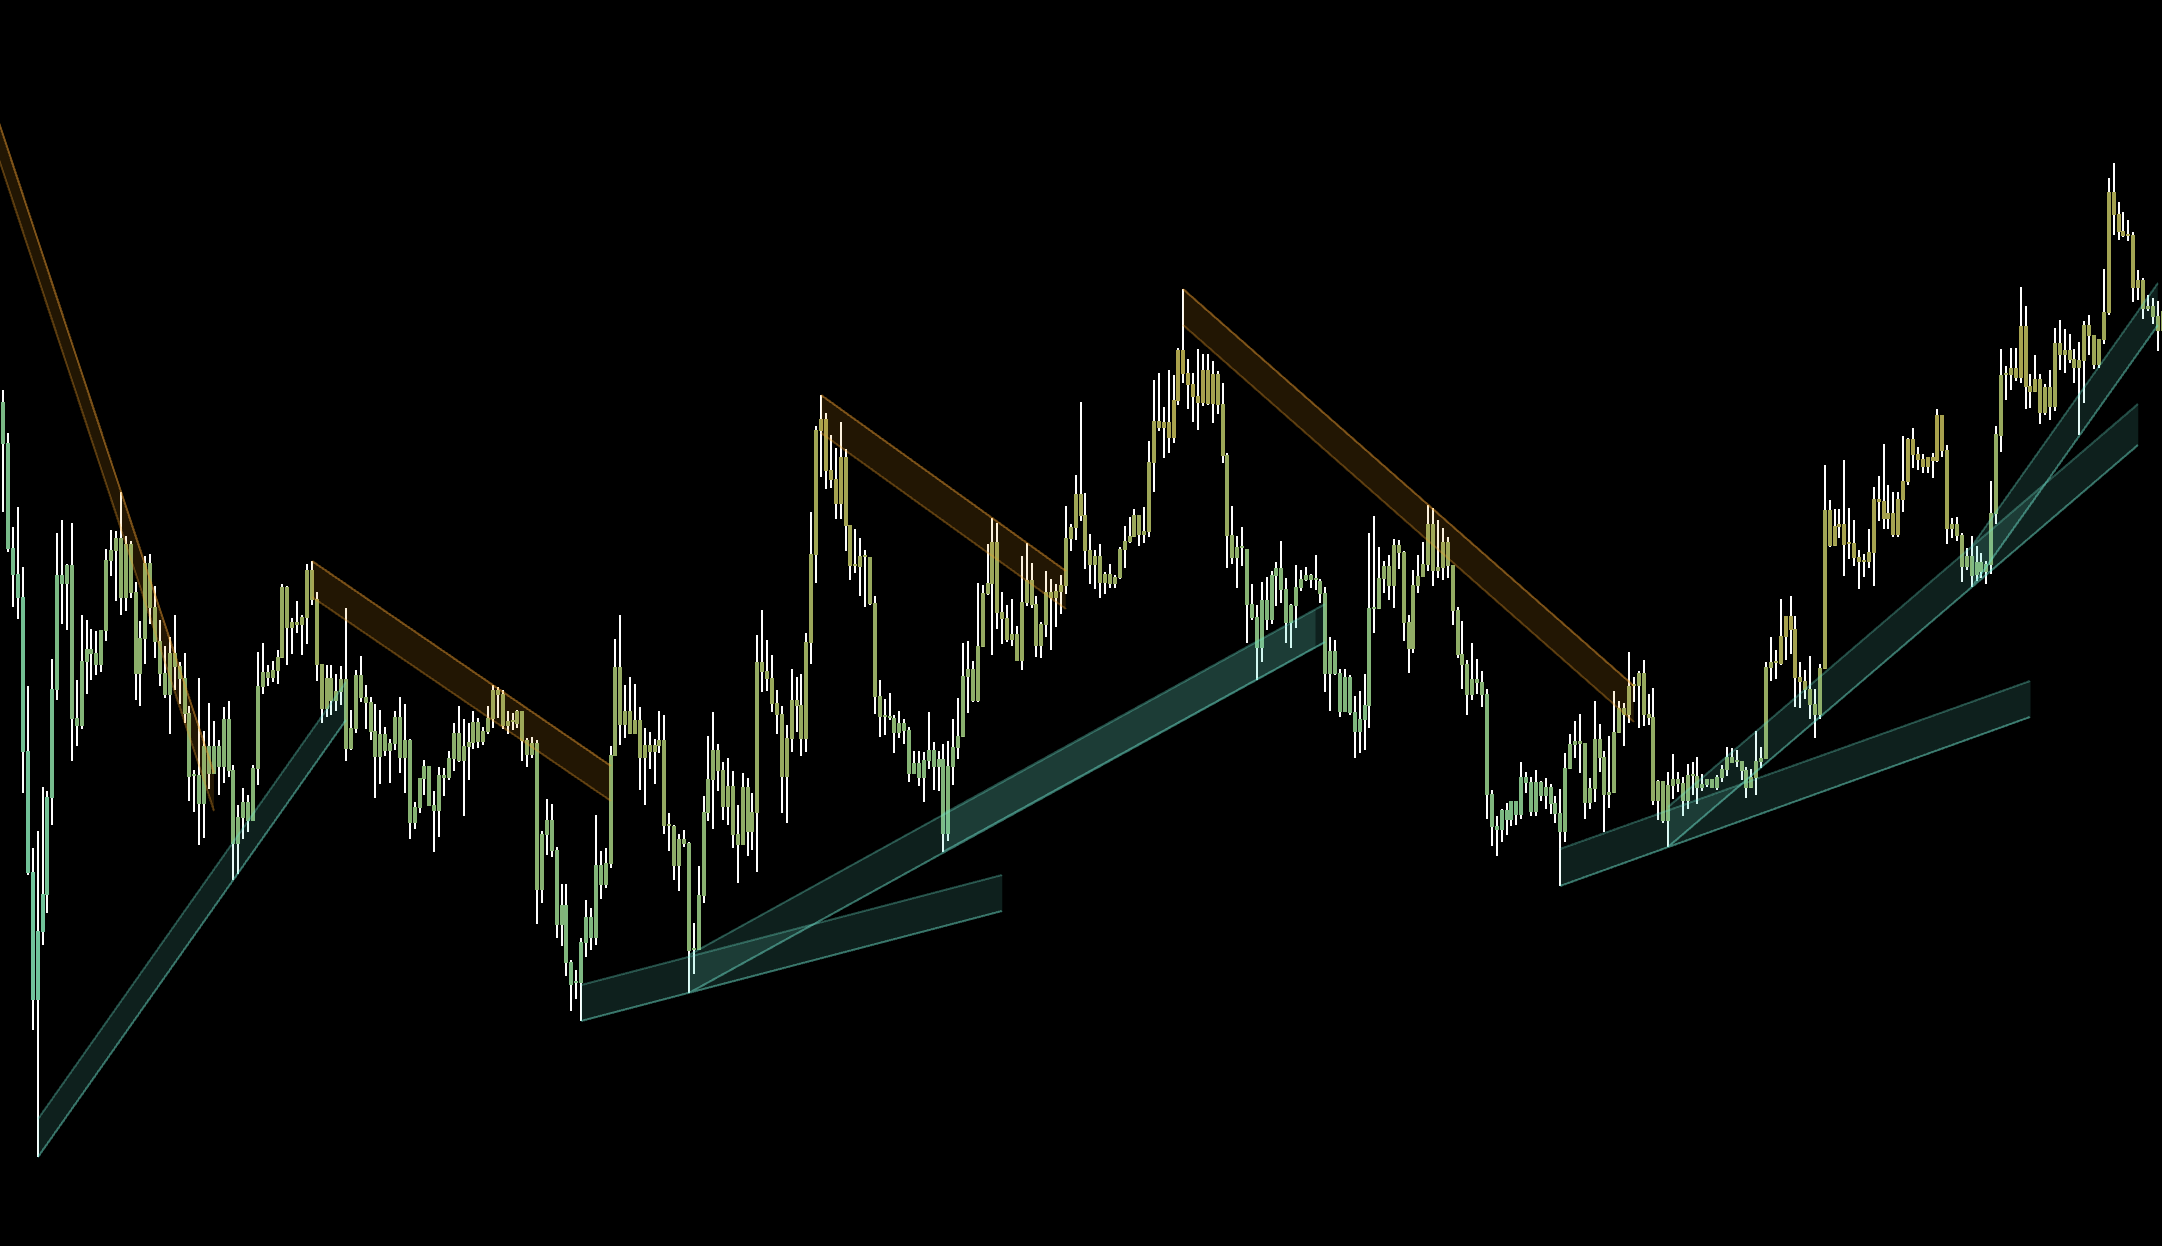
Reversal Matrix X
Build STM-focused reversals as a short sequence: location, signal, CHoCH, retest, and opposing targets.
Introduction
Reversal Matrix is mainly designed for STM trading. The complete STM methodology will be explained separately; on this page, use the indicator as a location → signal → structure-confirmation workflow. Do not enable every zone—select a small set of tools with defined jobs.
How to Use
◆Build the setup over multiple bars—not from a same-candle checklist. A recent Main signal supplies directional context, location shows where to act, and CHoCH/BOS can refine timing or continuation when available. Levels and patterns are context—not guarantees.
1. Primary Reversal Sequence
Keep the recent signal in context. For a Long setup, look for a bullish RM+ signal within roughly the latest 10–20 bars. For a Short, use a recent bearish RM+ signal. It does not need to print again at the entry.
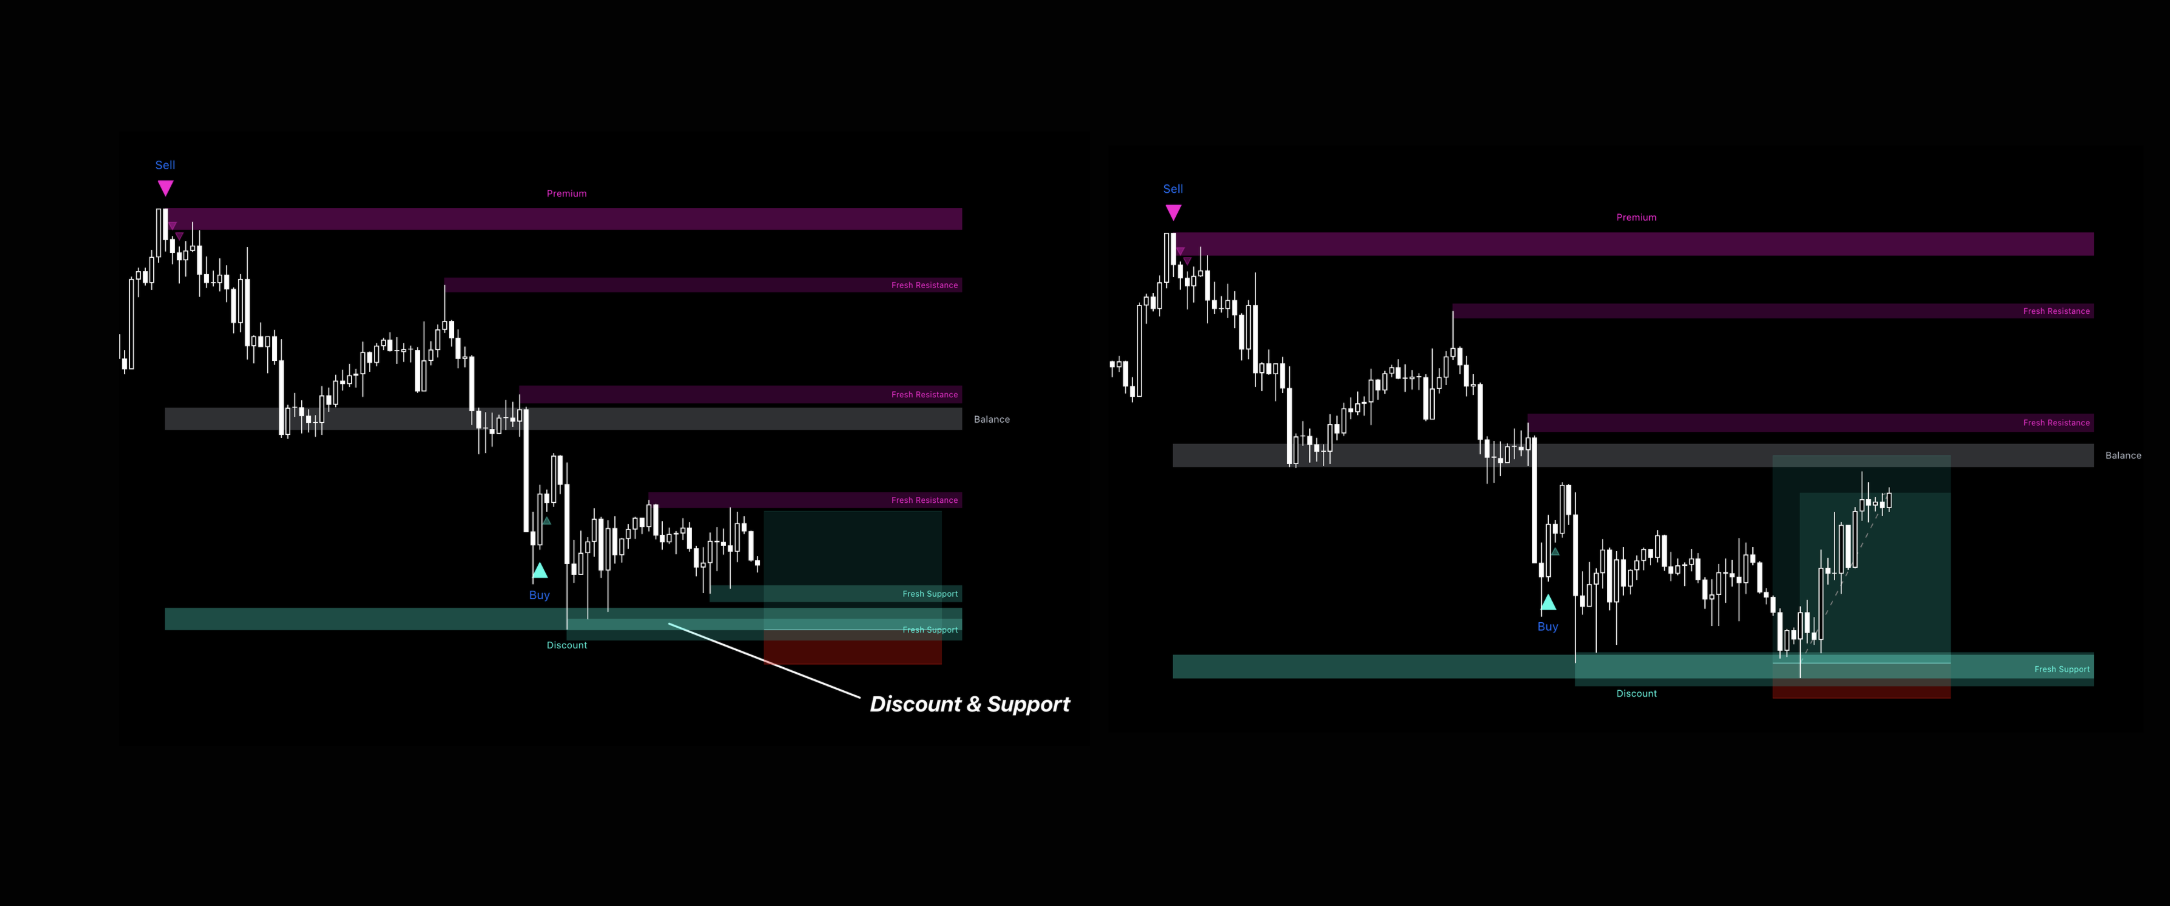
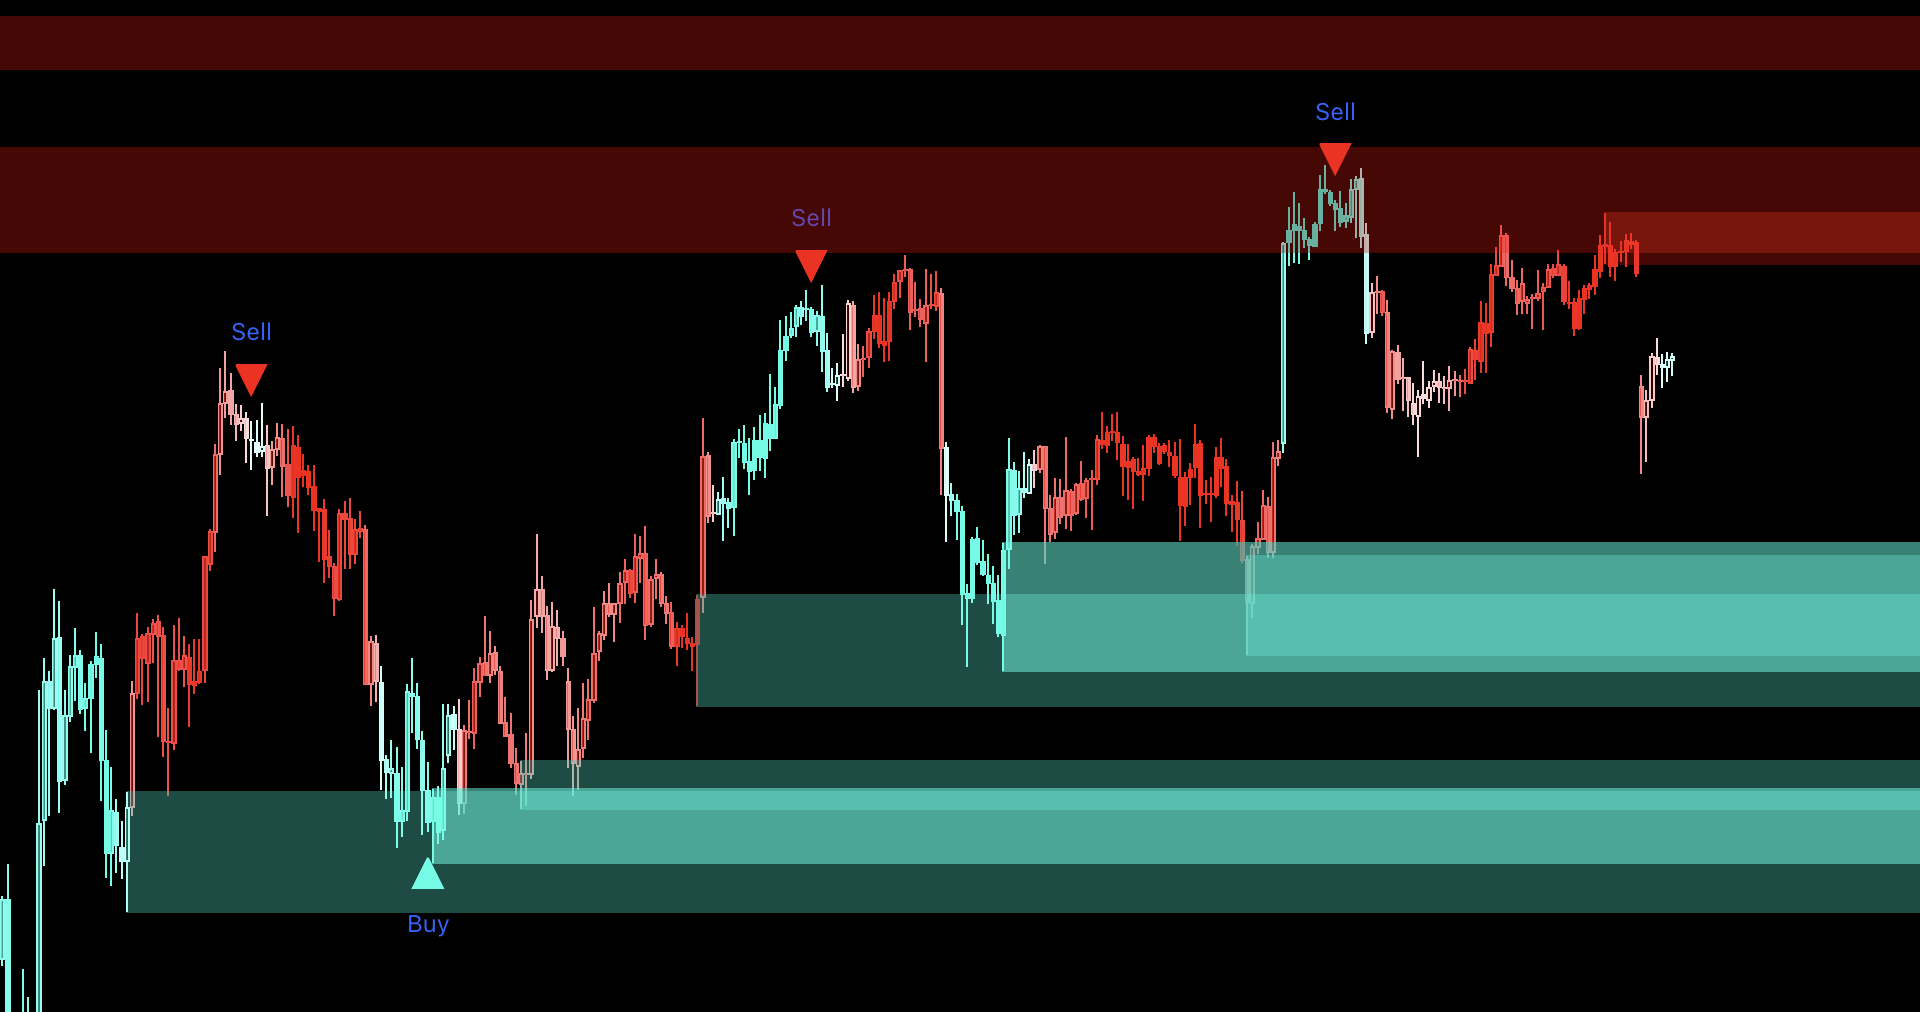
Wait for location. Favor Longs as price approaches support, Discount, a lower Reversal Zone, band edge, block, gap, or channel boundary. Reverse the logic near resistance and Premium for Shorts.
Enter on a usable reaction. CHoCH, a retest, or another structure response can improve timing, but every confirmation does not have to occur together. Avoid entering after price has already moved far away from the location.
Place invalidation beyond the setup. For Longs, put the stop below the supporting confluence and recent swing low. For Shorts, place it above the resistance confluence and recent swing high.
Take profit gradually. Scale out around 1R (1:1), 2R (1:2), and 3R (1:3) when those targets are available, or use the next resistance levels for Longs and support levels for Shorts. After TP1, consider moving the remaining position to break-even.
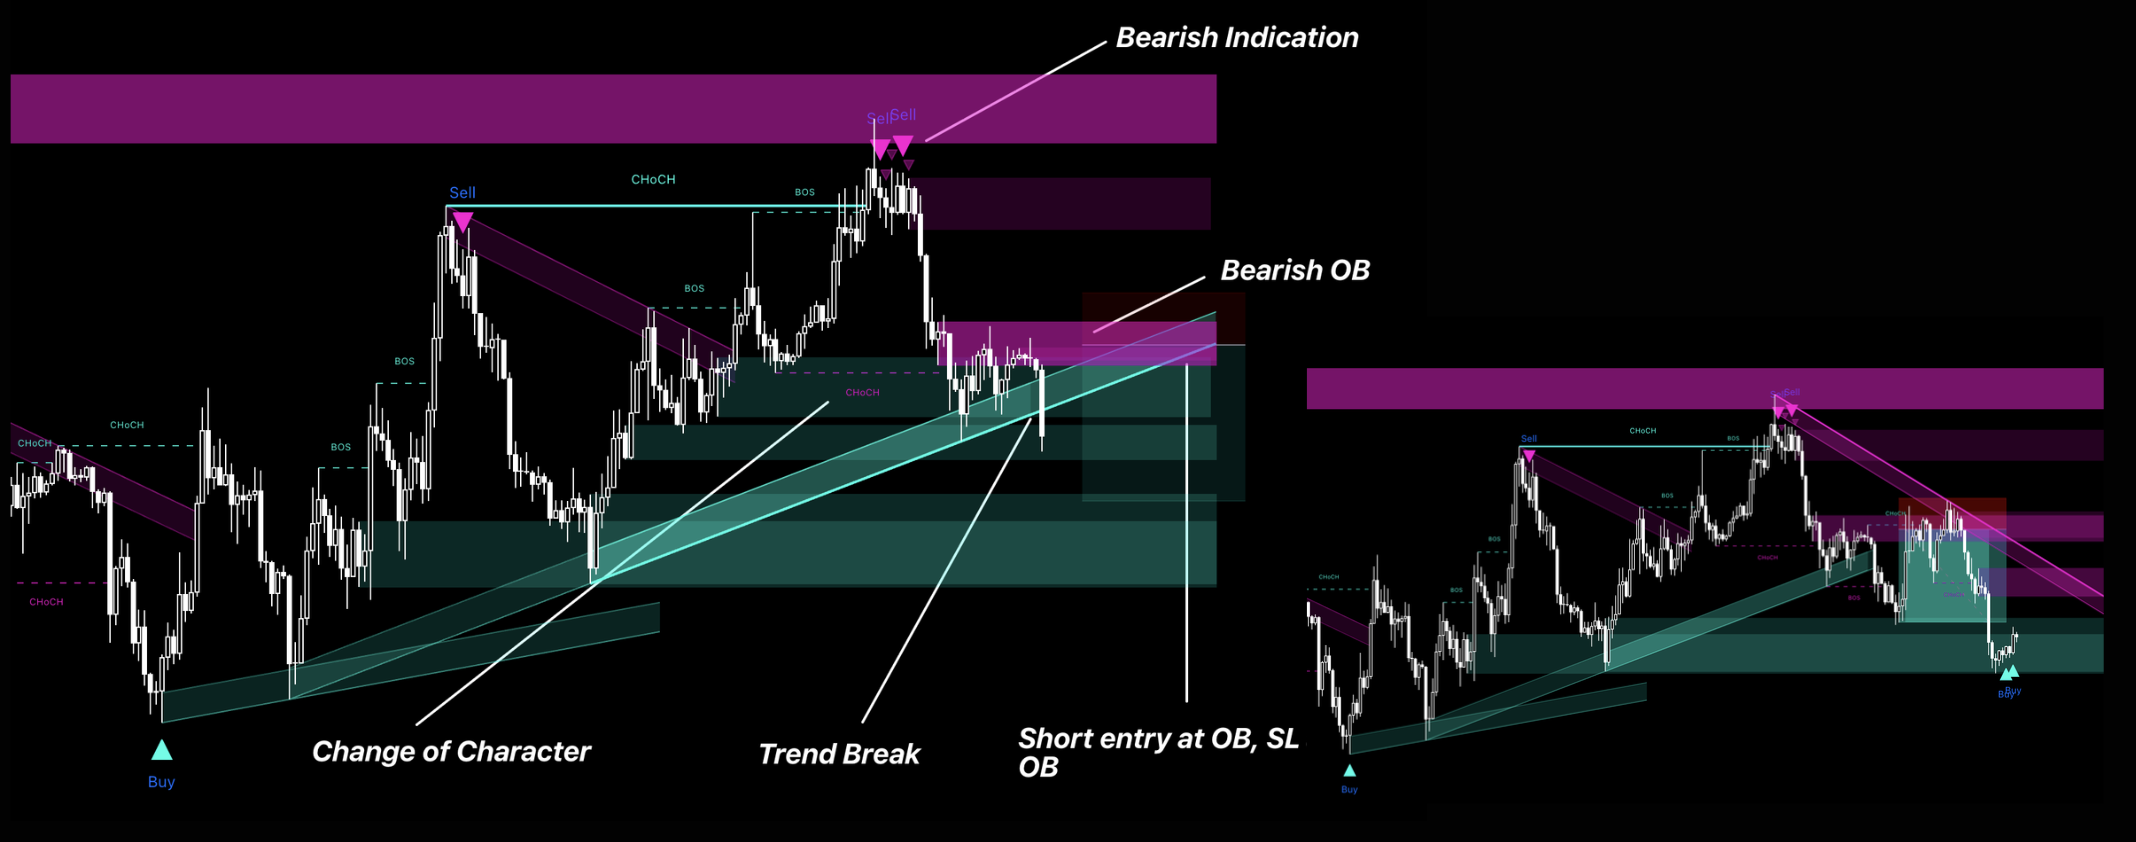
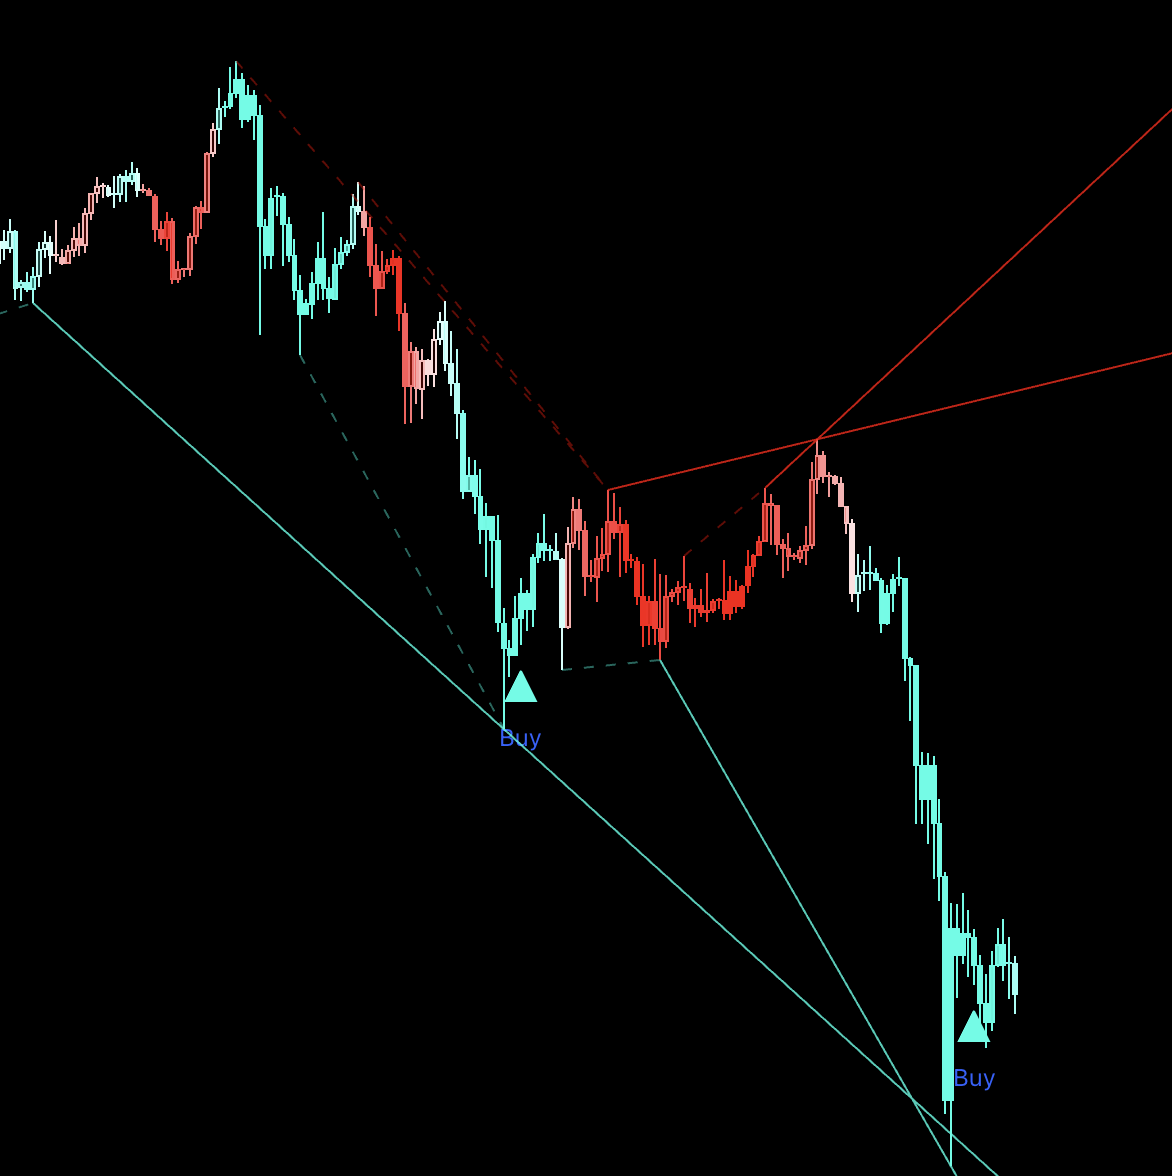
2. Break-and-Retest Structure System
Mark the active Trend Line, Price Channel, Dynamic Trendline Channel, or confirmed Support / Resistance boundary.
Wait for a Main signal and CHoCH through the old structure; do not enter from the line break alone.
Use the retest of the broken boundary, nearby Order Block, or FVG as the entry area.
Use BOS in the new direction as continuation confirmation. Keep the stop beyond the retest swing and target the next key high/low or channel boundary.
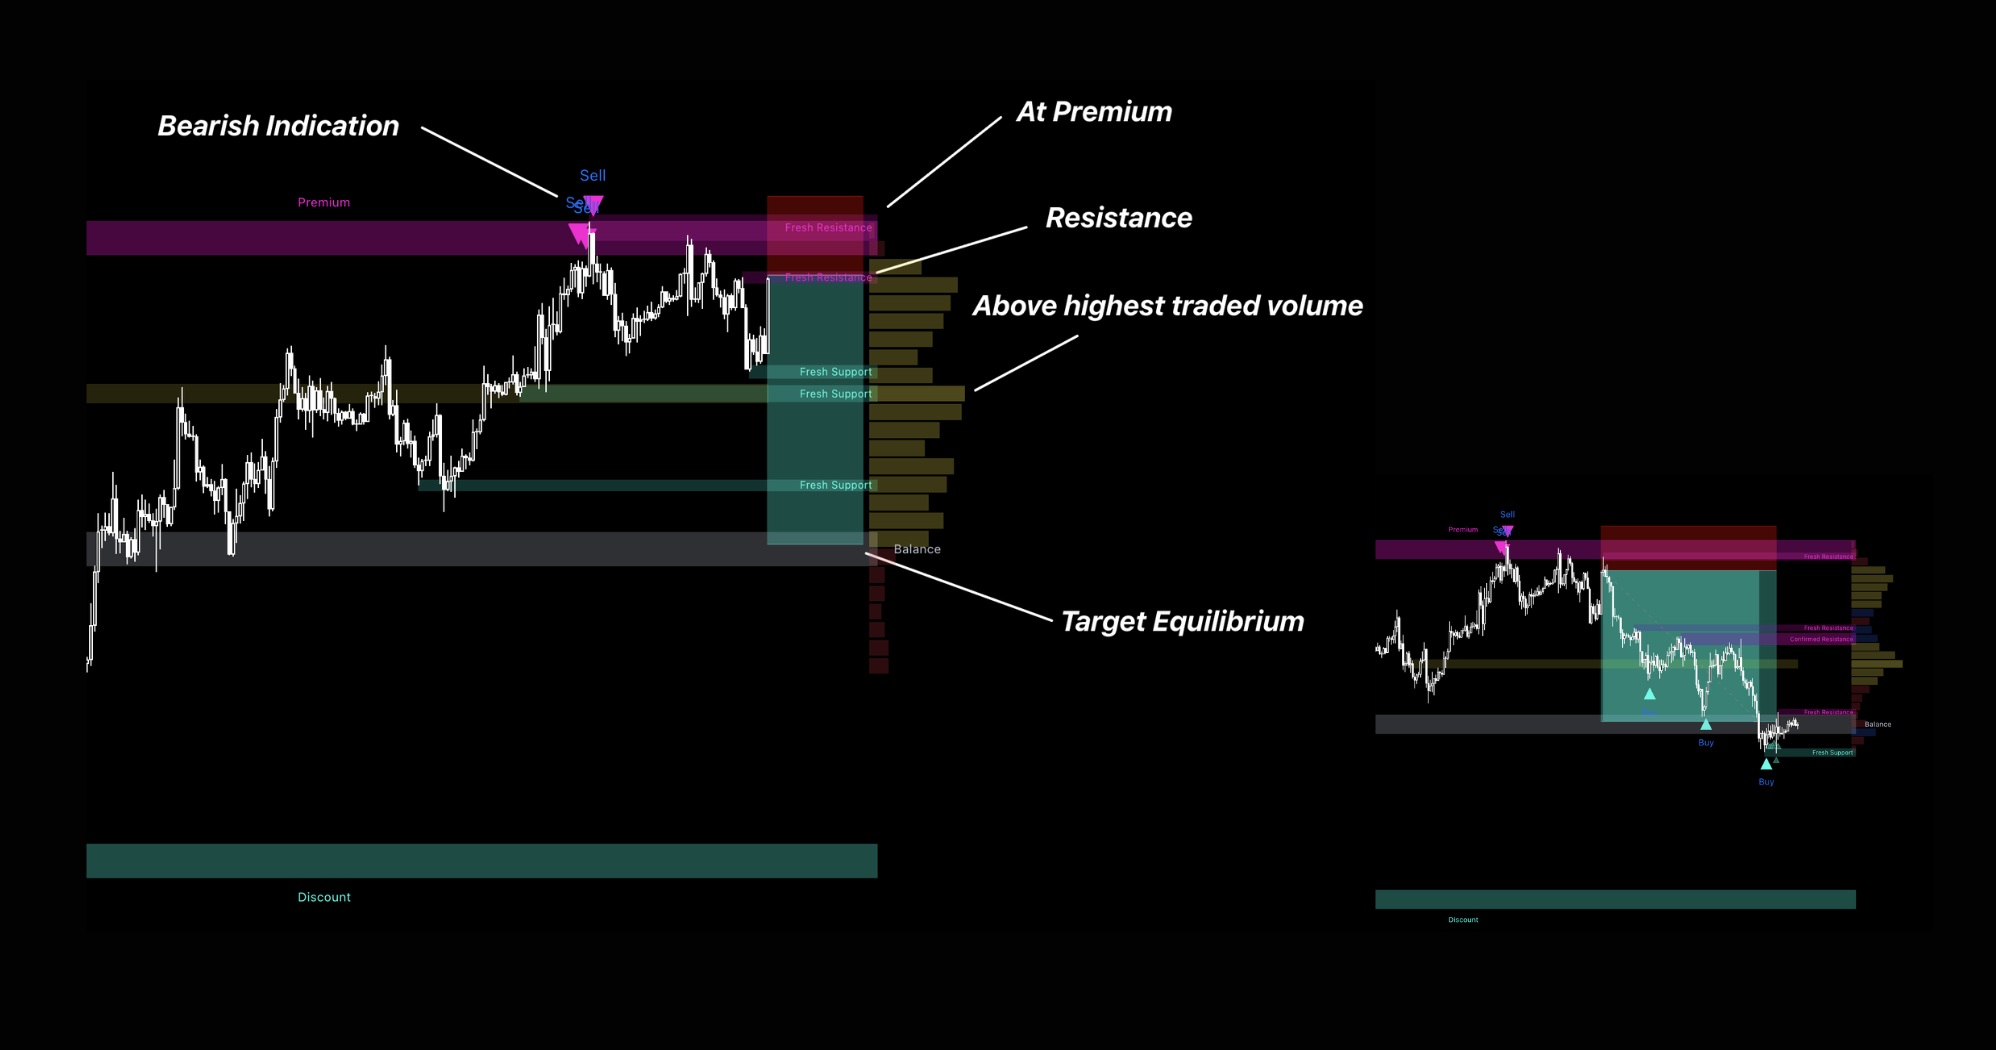
3. Value-and-Volume Reversion System
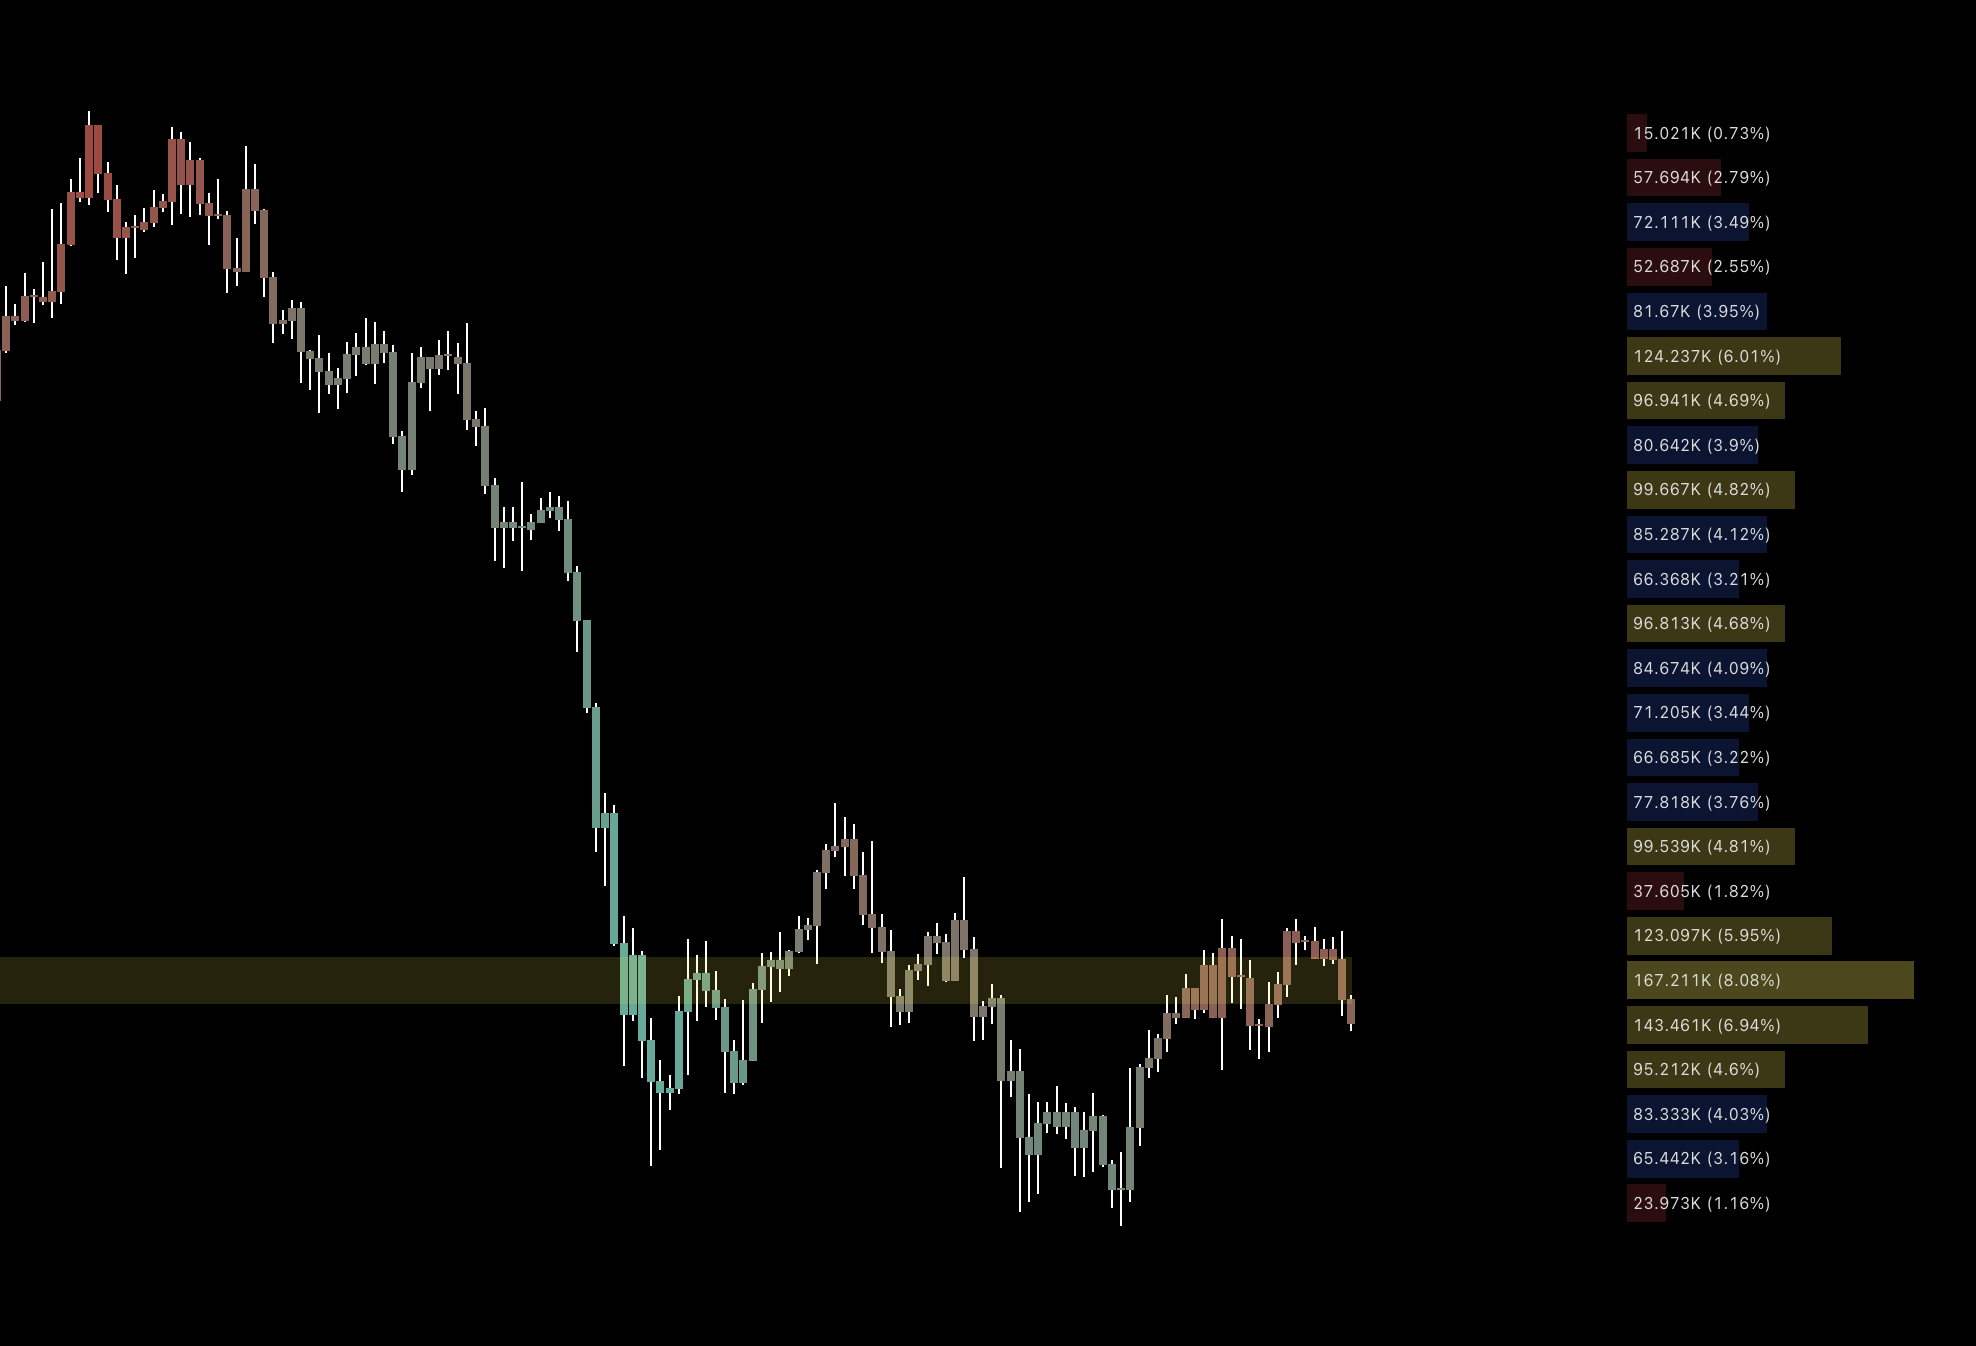
Use Discount or Premium for directional location, then check whether Volume Profile shows nearby accepted price or support/resistance context.
Require a Main signal and CHoCH before entering; profile levels alone are reactive context, not an entry.
For Longs, place the stop beyond the Discount-side structure; reverse this for Shorts.
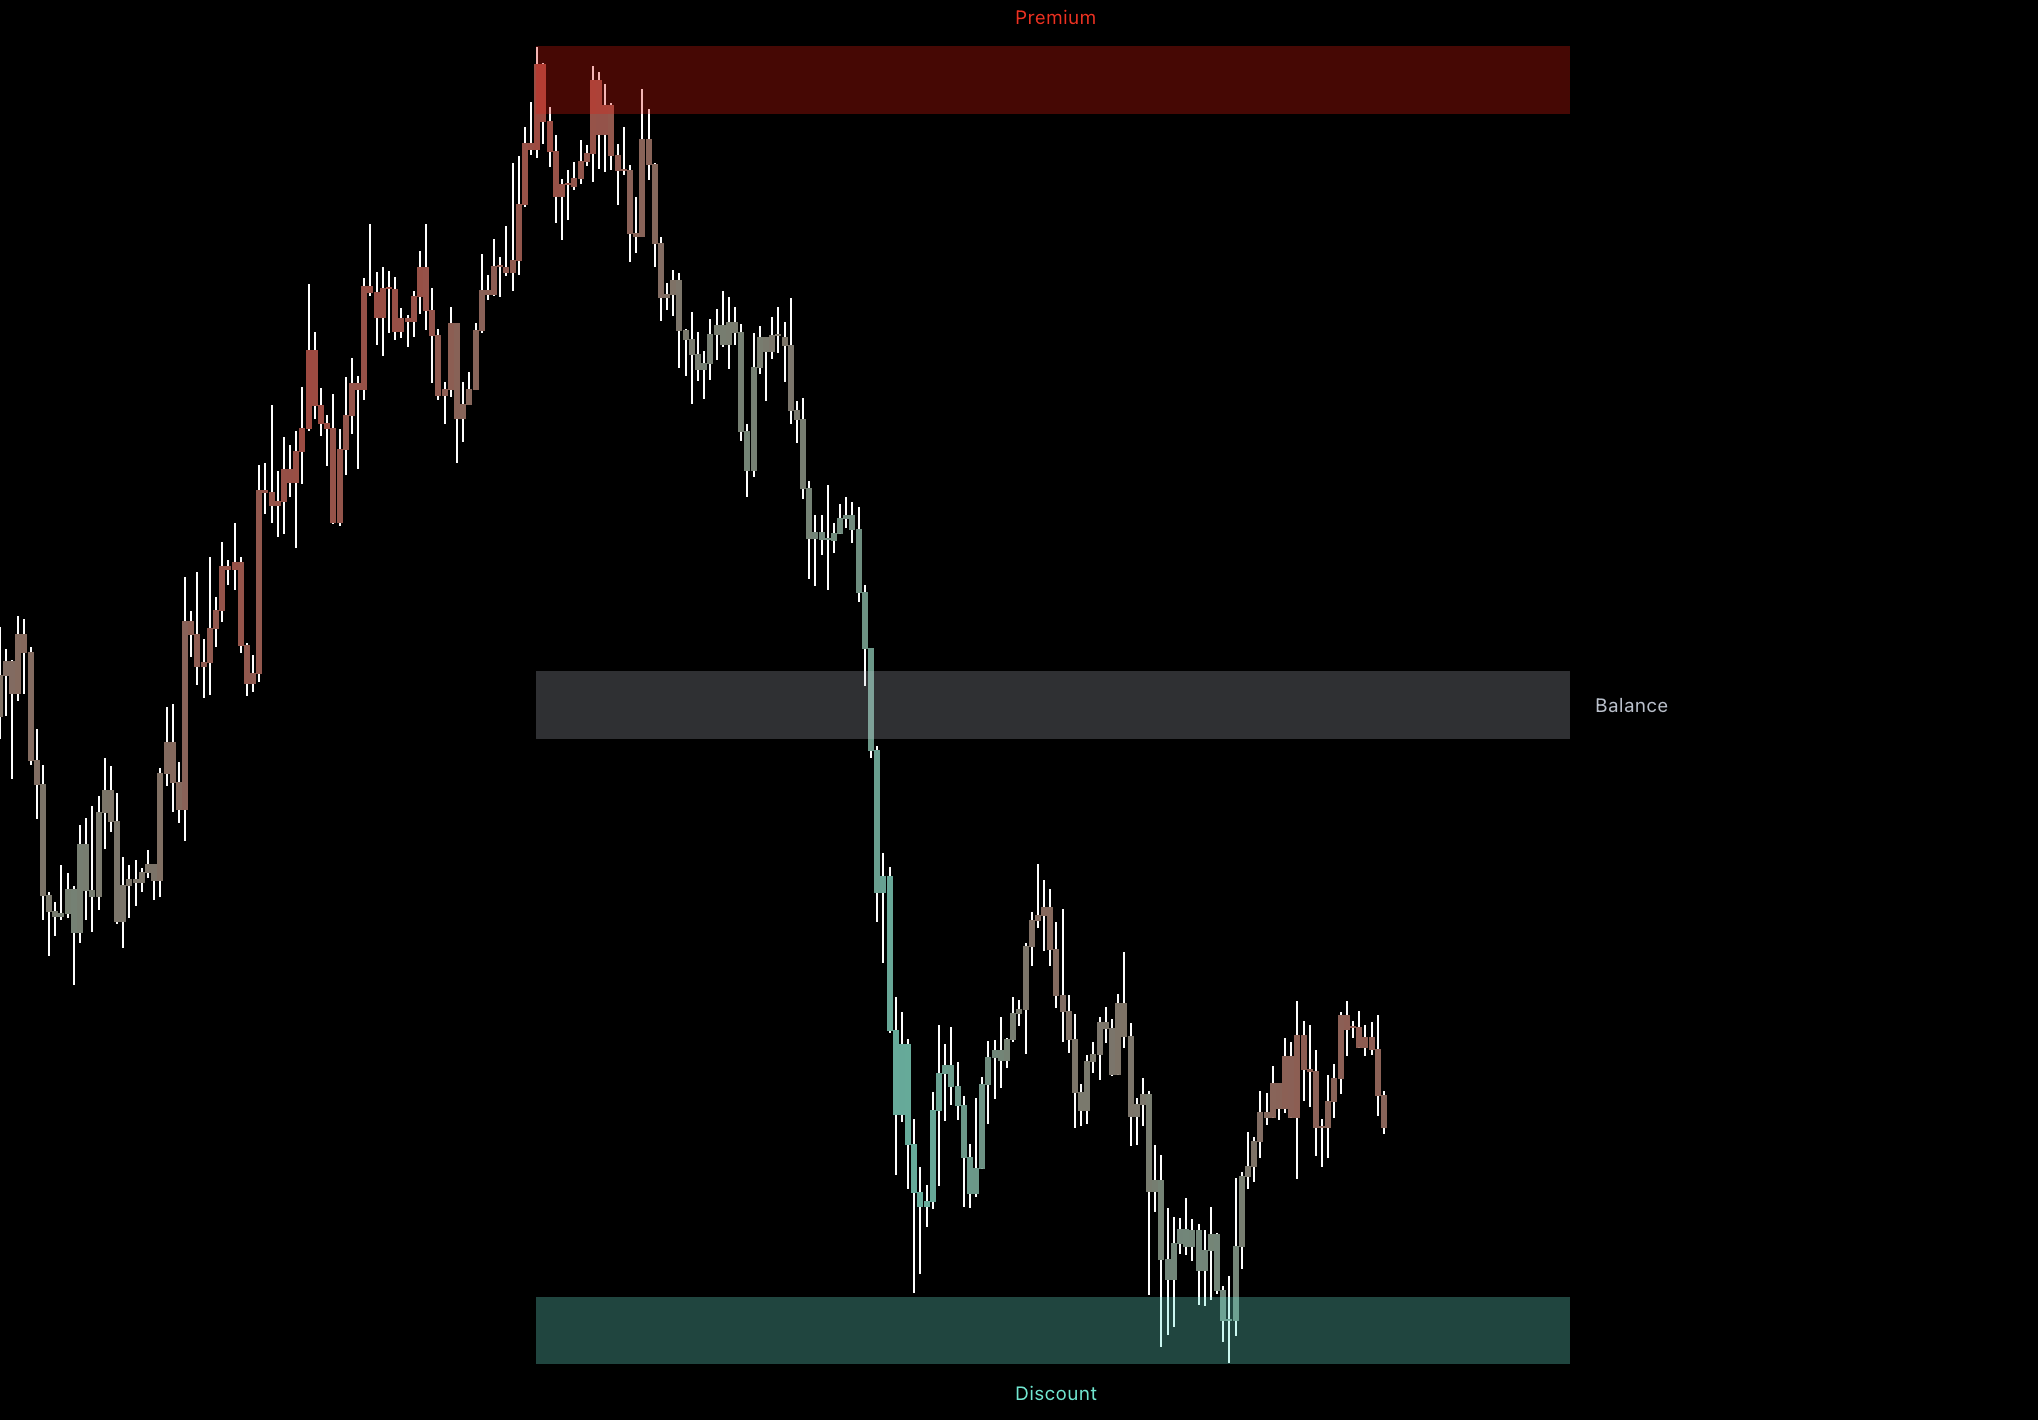
Take the first profit near Balance or the profile's accepted-price area, then target the opposite side of Value Range.
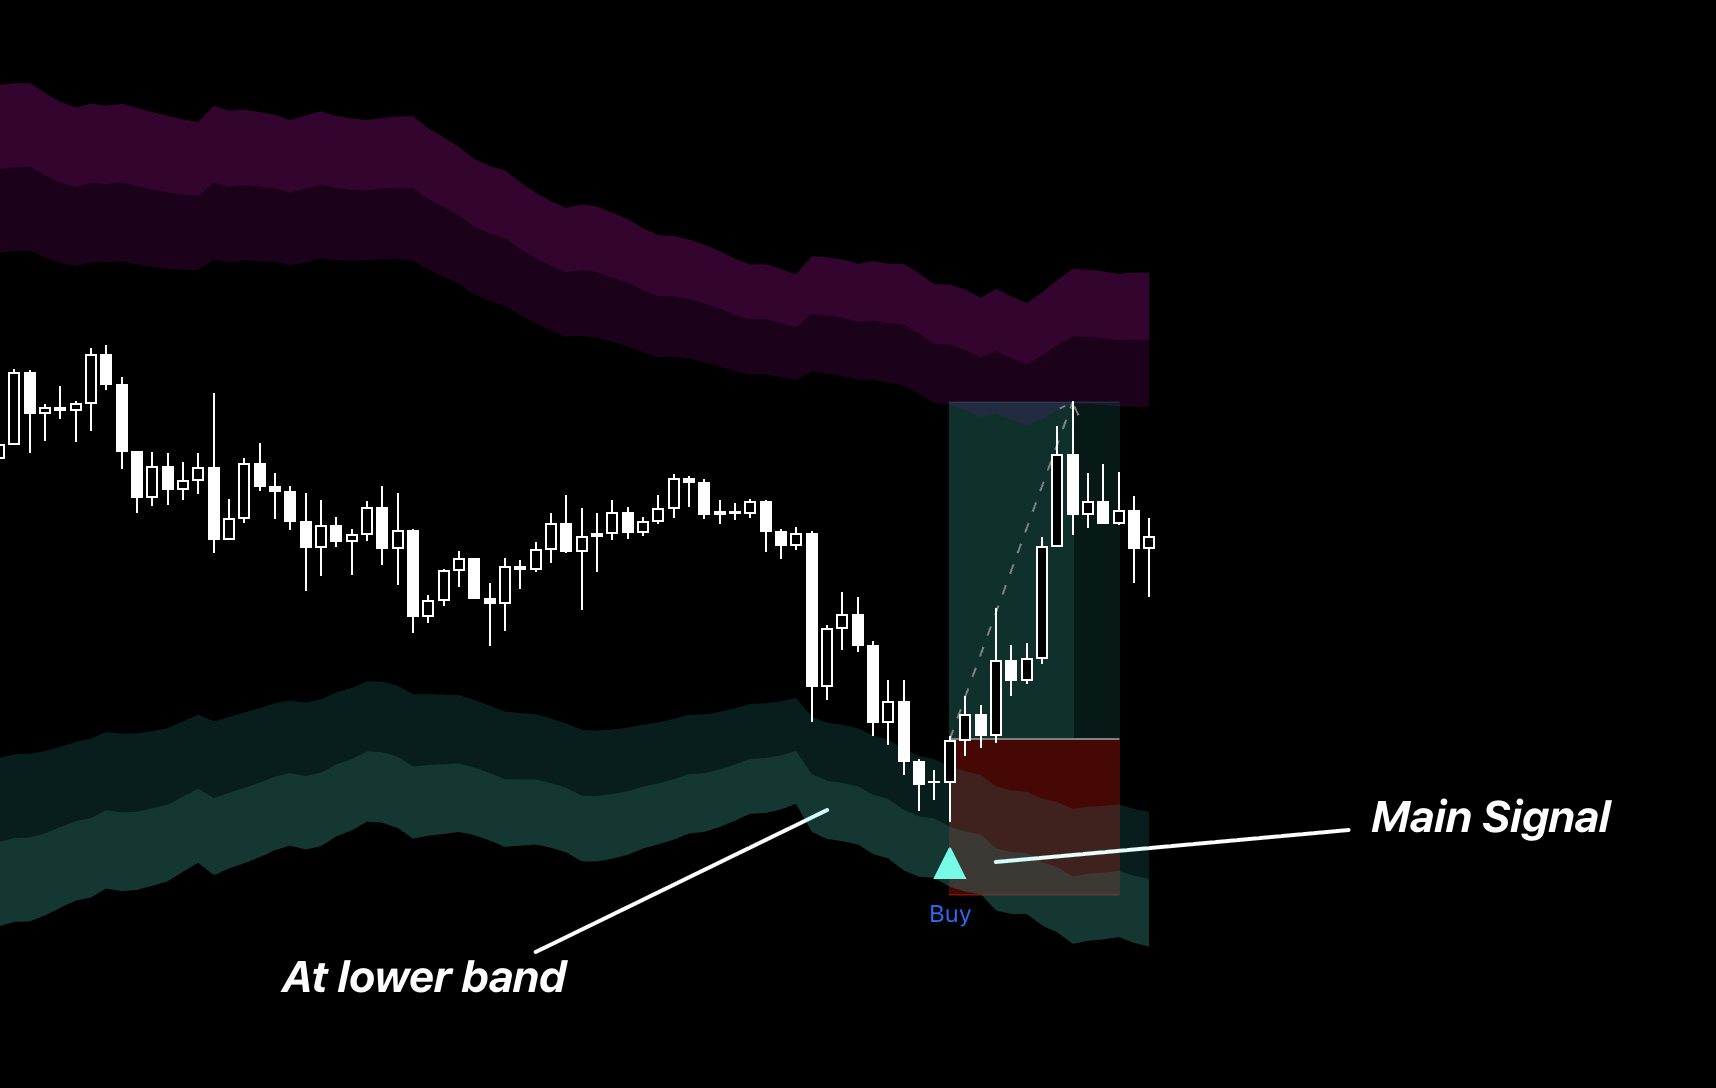
4. Channel-Extreme Reversal System
Use the outer Smooth Band, Price Channel, or Regression Channel boundary as the reversal-search location.
Use the Main signal at the boundary as the entry trigger. Take a Main Buy near the lower extreme or a Main Sell near the upper extreme; do not wait for CHoCH at the bands.
Place the stop beyond the extreme that invalidates the setup.
Take partial profit at the channel midline and use the opposite boundary as the larger target. A sustained move outside the channel invalidates the mean-reversion idea.
Signals and Structure
Presets
Start with Normal while learning the workflow. Conservative is useful when you want fewer candidate setups; Aggressive produces more candidates and therefore needs stronger manual location and structure filtering. Compare presets over the same market sample rather than changing after one trade.
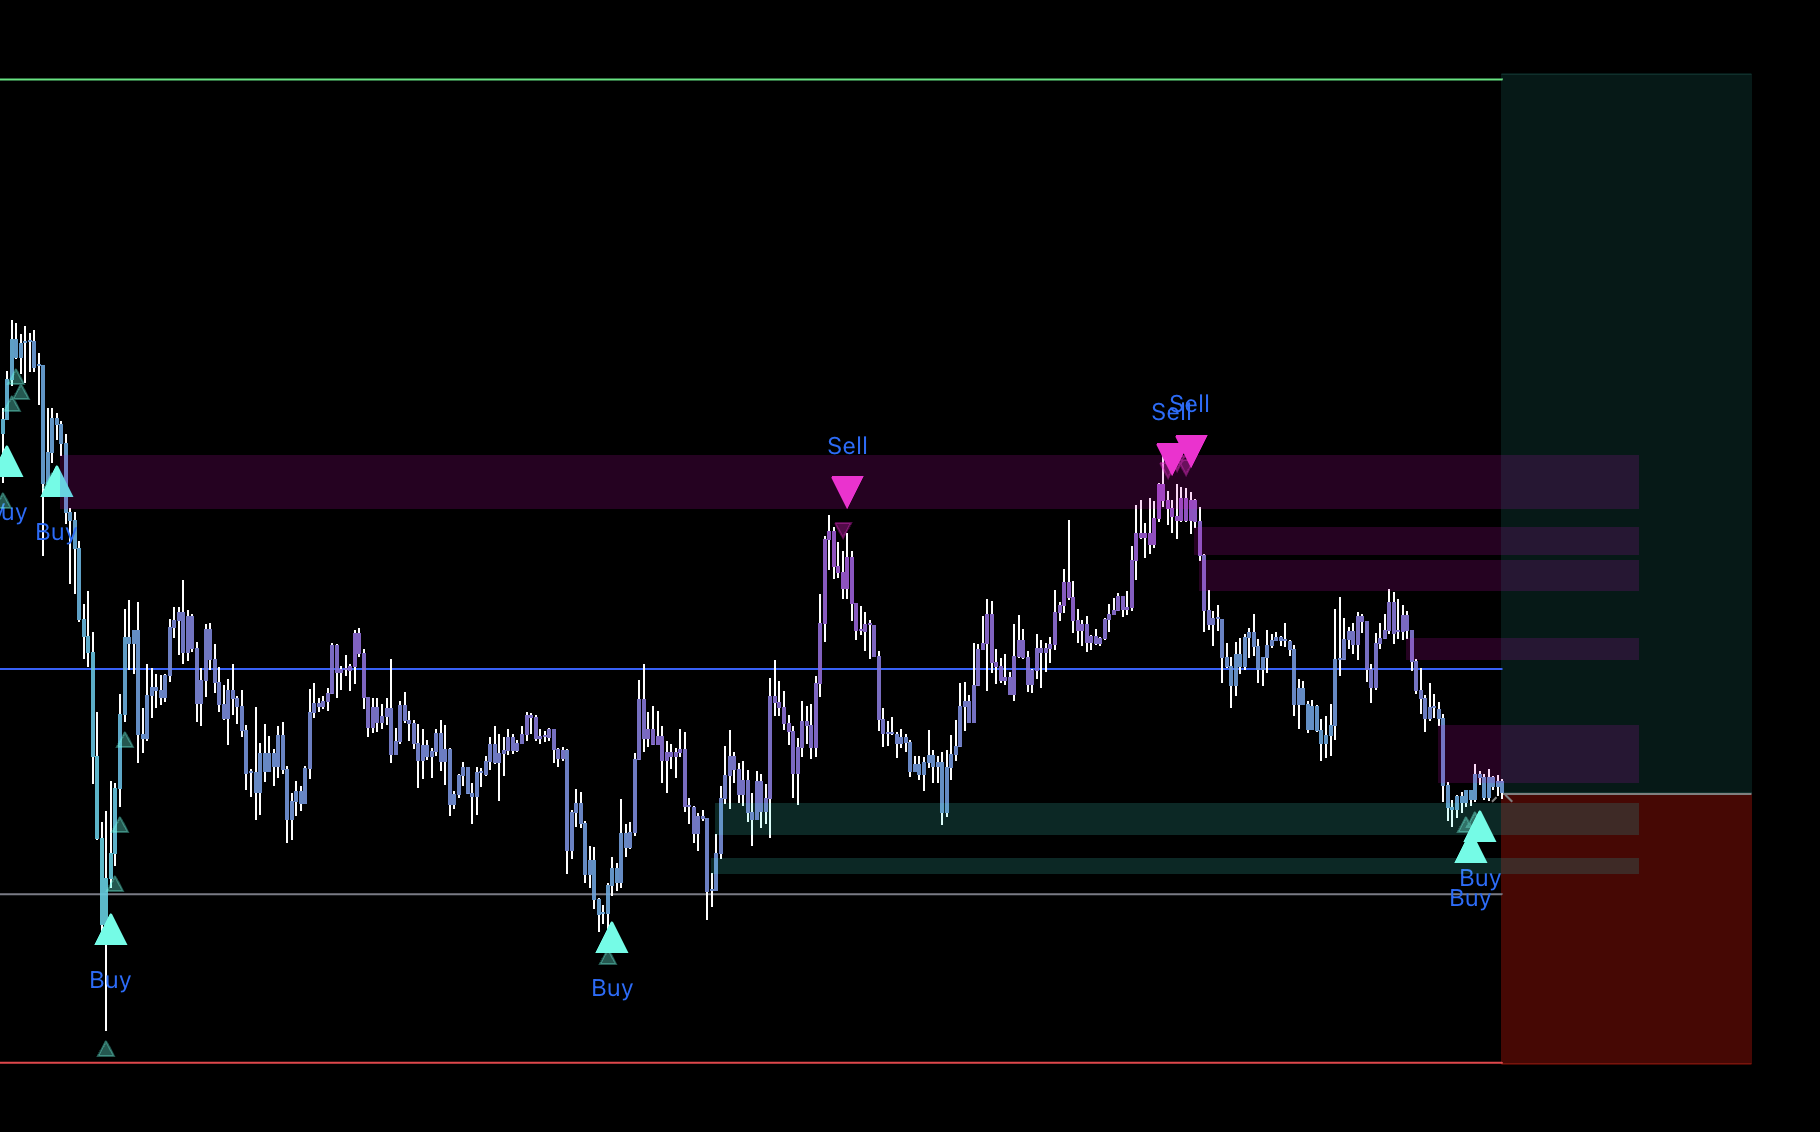
Main Signals
Use Main Buy/Sell as the actual trigger only after price reaches a planned location. A Main signal in the middle of a range has less contextual value; wait for CHoCH when the setup is intended to capture a reversal.
Soft Signals
Use Soft signals as an early warning that pressure may be changing. They are useful for preparing levels, reducing an opposing position, or waiting for the Main signal; they are not standalone entries.
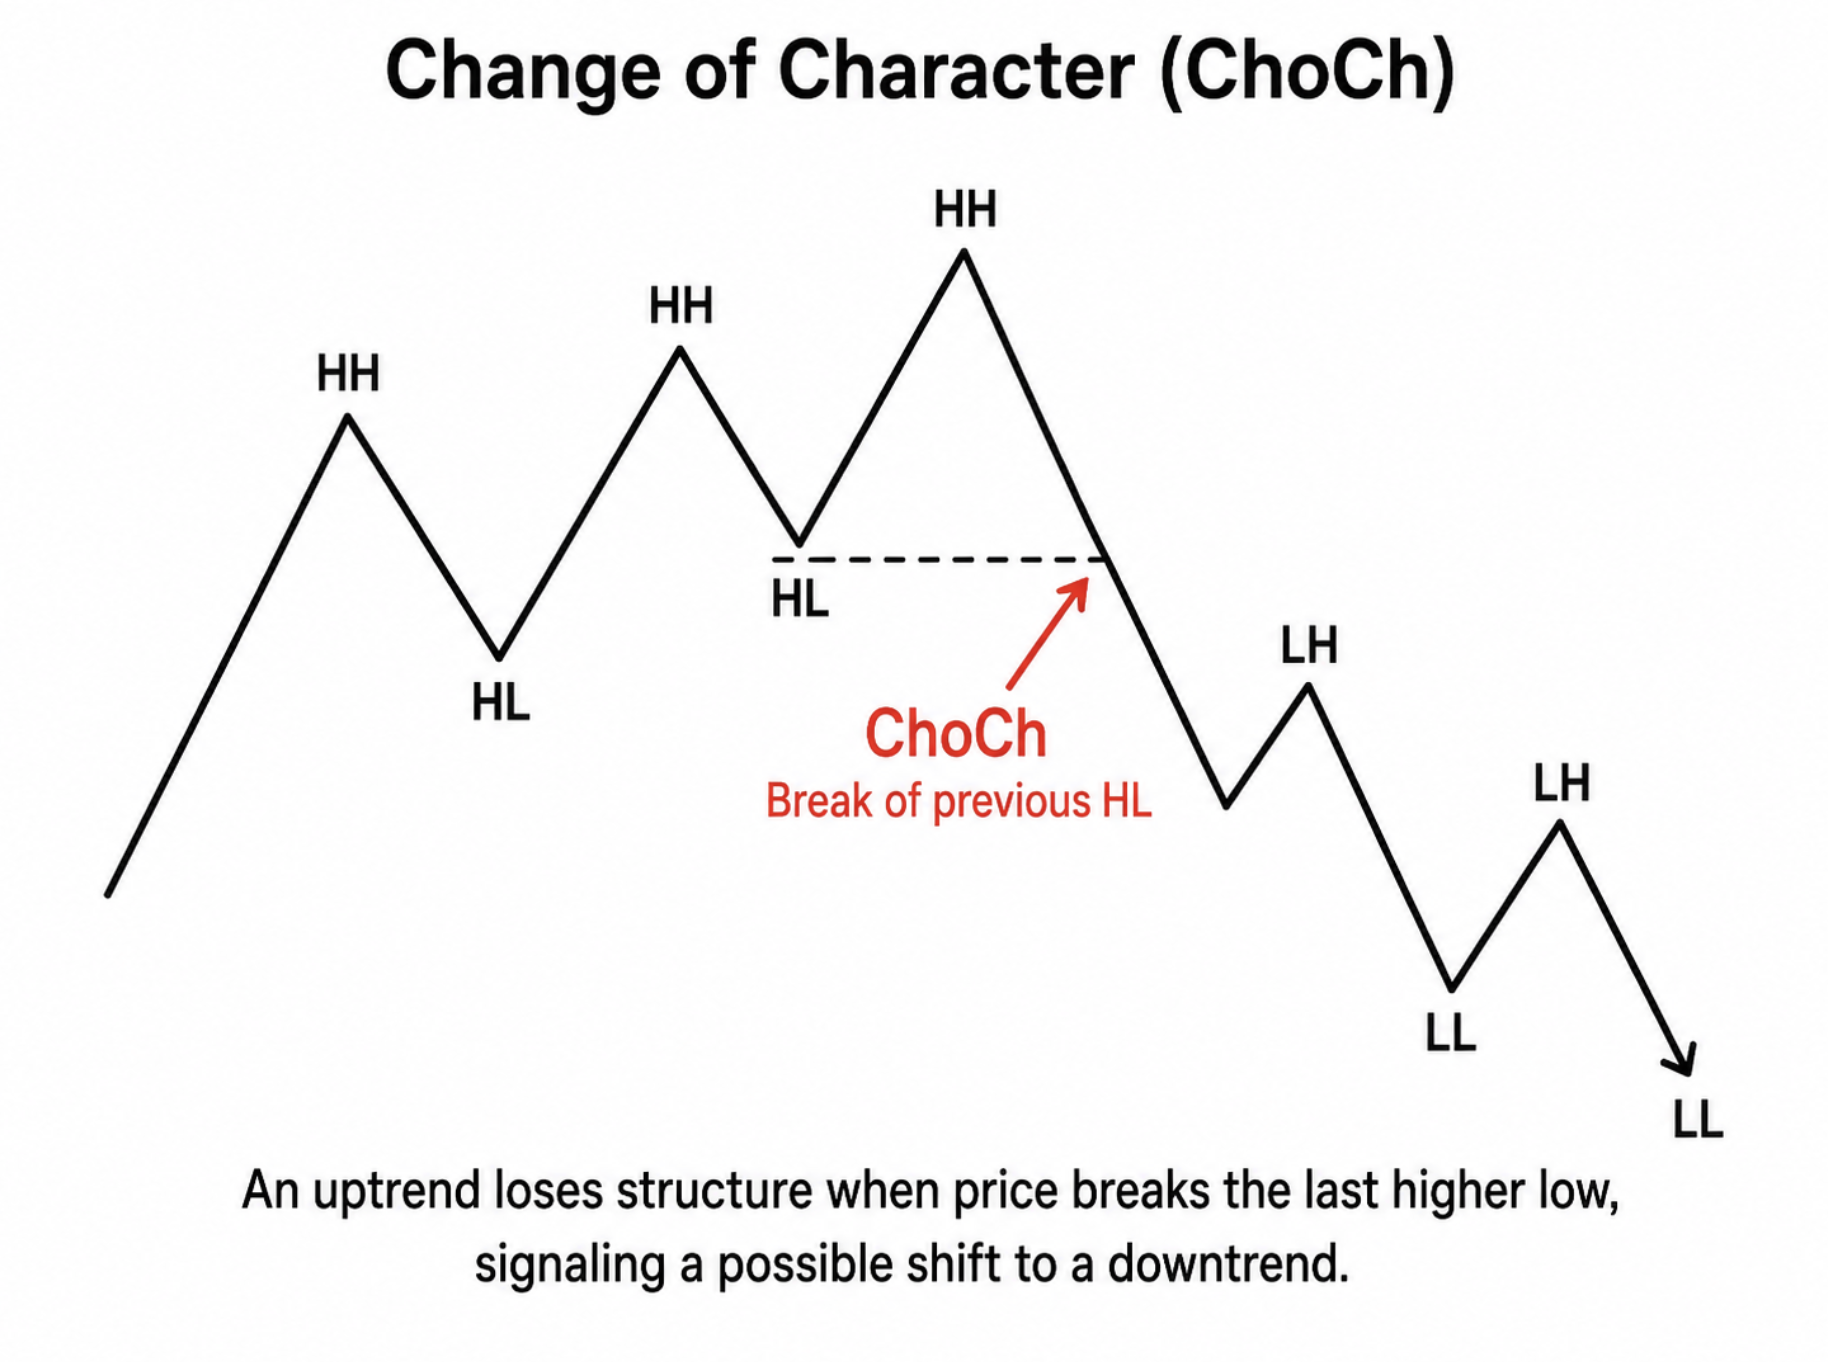
CHoCH
Use Change of Character as the first structural evidence that the old sequence may be failing. Prefer a confirmed break and, when available, a retest that provides a clear entry and invalidation point.
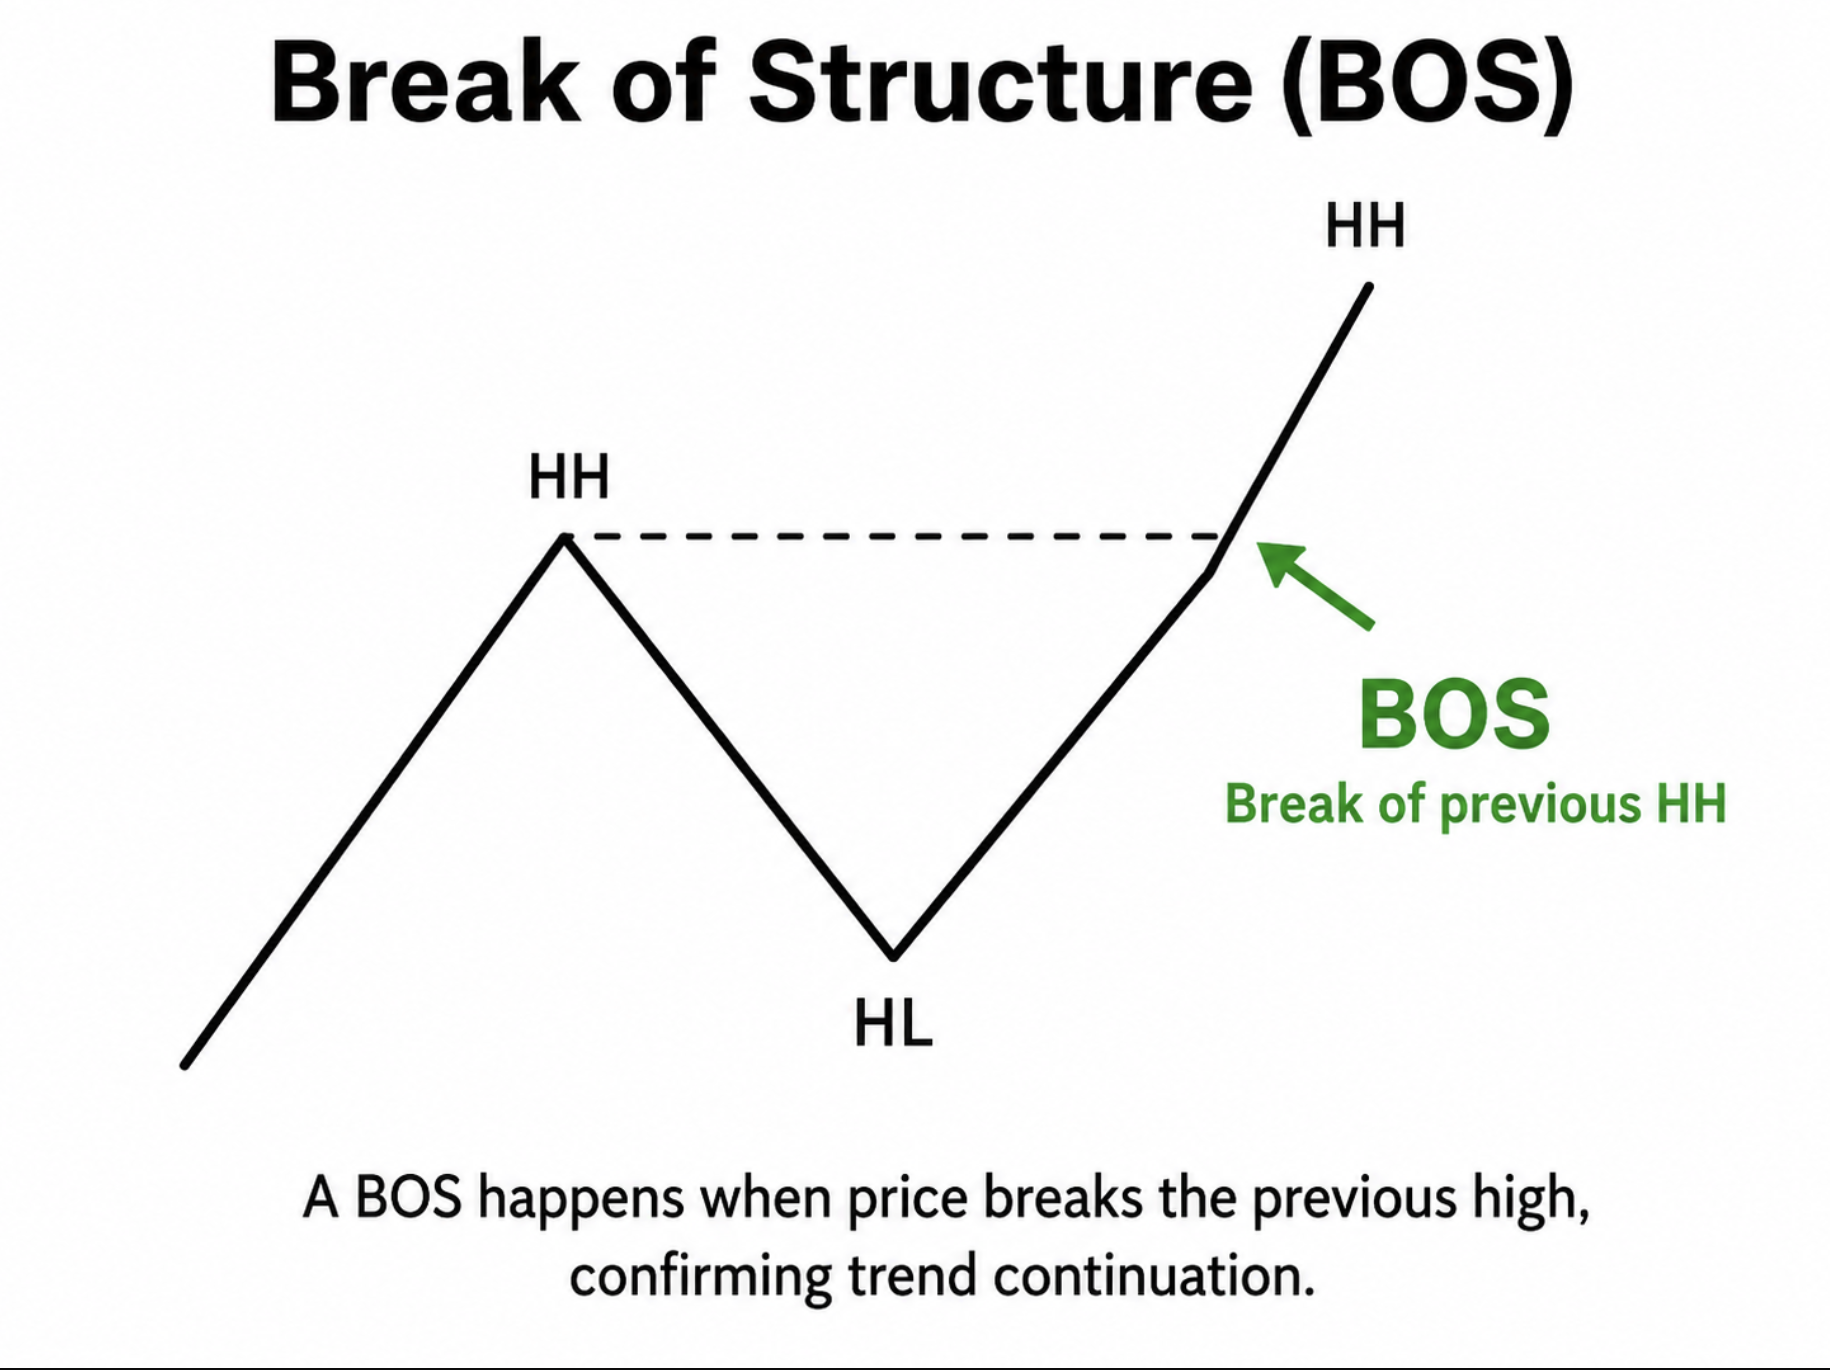
BOS
Use Break of Structure after CHoCH to confirm that price is continuing in the proposed new direction. BOS can justify holding a runner or trailing the stop behind the newly protected swing; it is not necessary to chase an entry far from location.
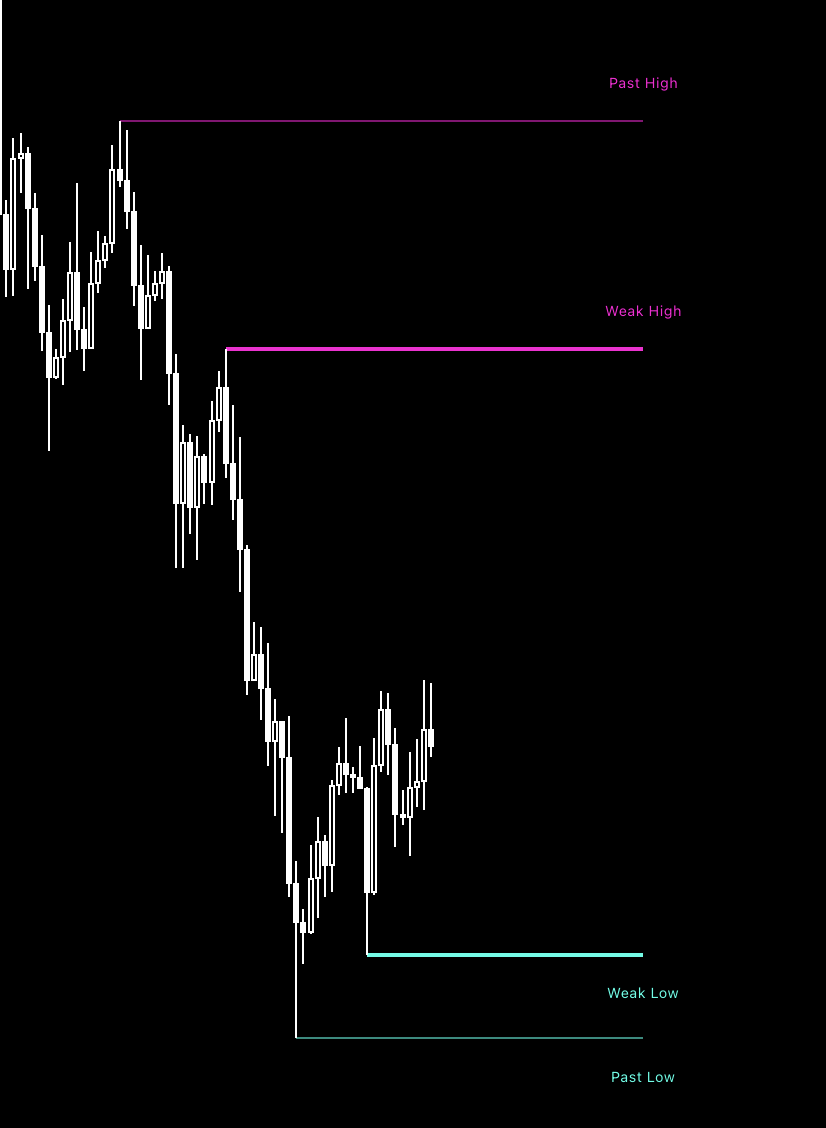
Key Highs and Lows
Use the protected reversal swing as the setup's invalidation reference and weaker opposing highs/lows as liquidity or target areas. If price breaks the protected swing, reassess the reversal rather than widening the stop without a plan.
Location and Confirmation Features
Reversal Zones
Use the outer zones to define where the search for a reversal begins. Do not enter simply because price touches a zone—require a Main signal and structure response, then place invalidation beyond the far side.
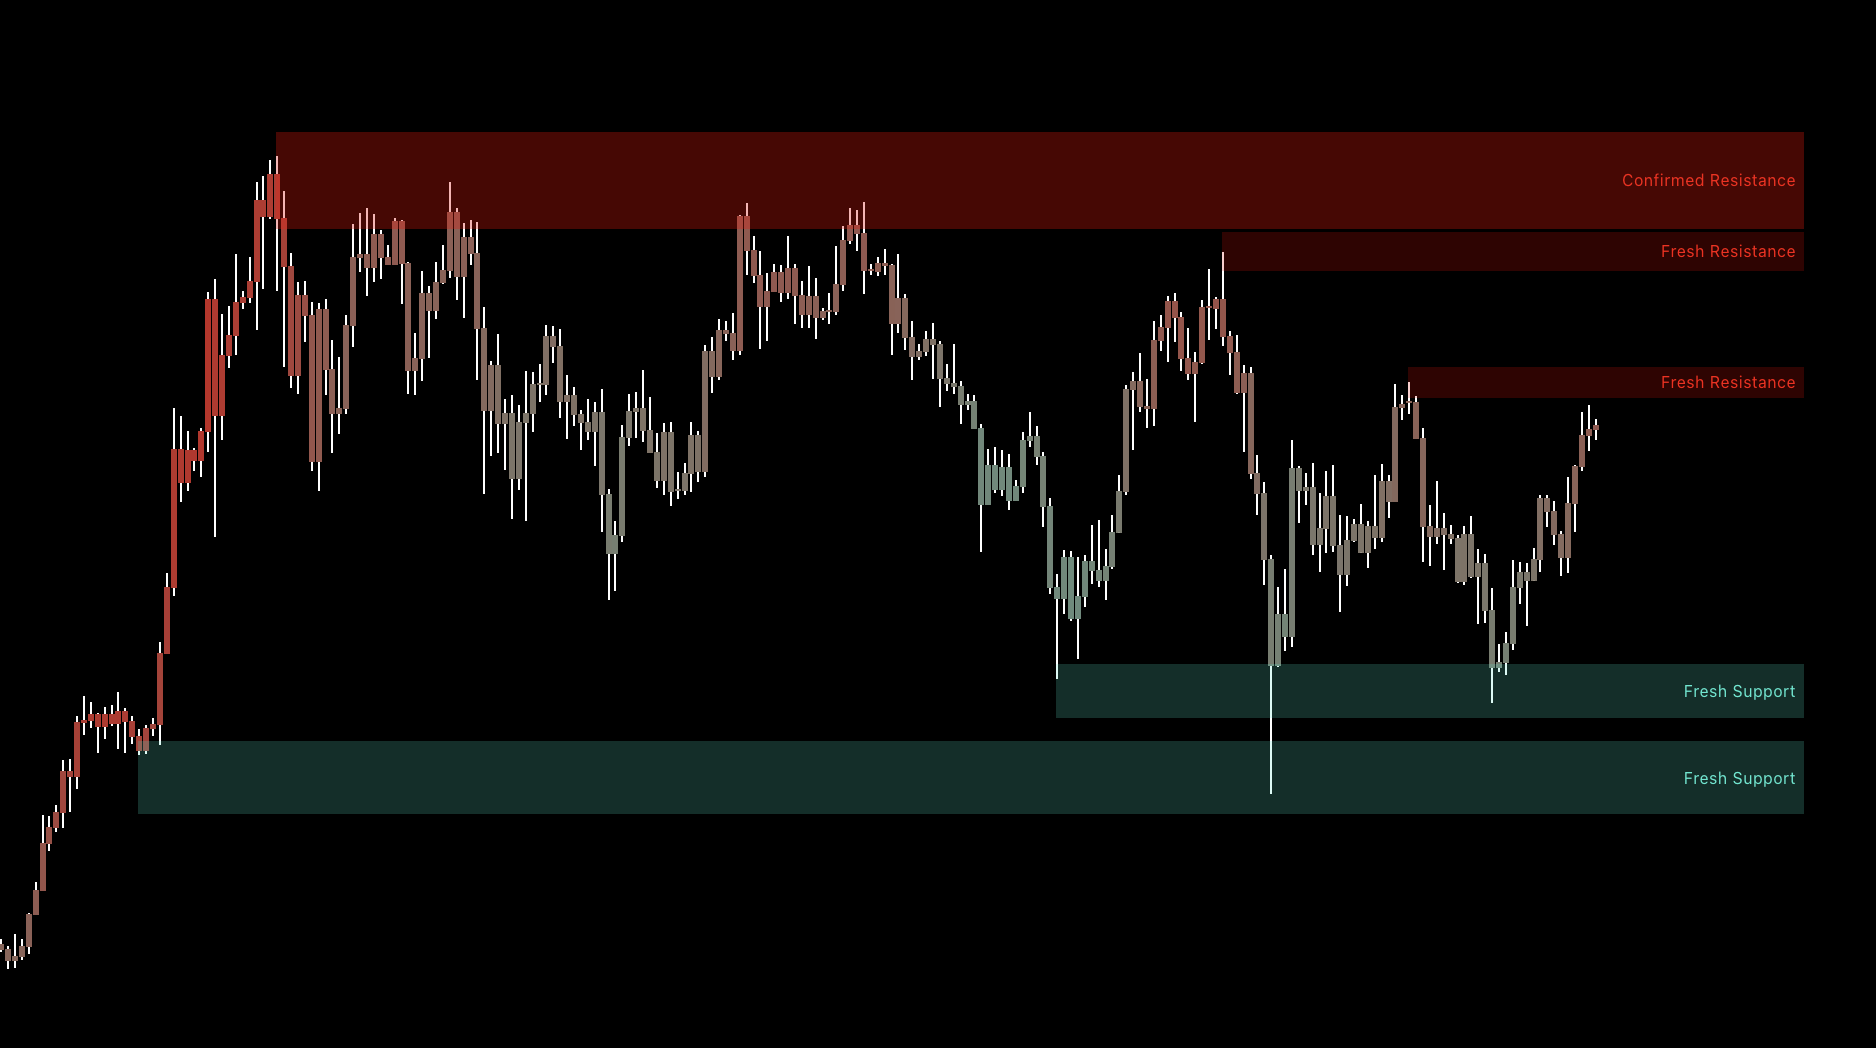
Support and Resistance
Use confirmed zones as planned reaction areas. A rejection plus Main signal/CHoCH supports a reversal setup; a clean break and retest supports continuation. Place the stop beyond the zone rather than directly on its edge.
Value Range
Use Discount to prioritize Long reversal searches and Premium to prioritize Shorts. Balance is the first mean-reversion target; reaching Premium or Discount is location only, so require the normal signal and structure sequence.
Volume Profile
Use high-activity accepted-price areas as potential magnets, targets, support, or resistance. Low-activity areas can produce faster movement or sharp rejection, so treat the profile as a reactive map and combine it with price structure. Enable profile text when exact displayed levels help the plan.
Order Blocks
Use an Order Block as a retest location after CHoCH, especially when it overlaps support, Discount/Premium, or an imbalance. Enter only after price reacts as planned and use the far side of the block as invalidation.
Fair Value Gaps
Use an unfilled FVG as a possible retracement area, continuation retest, or opposing target. It becomes more useful when aligned with structure and another location tool; do not assume every gap must fill.
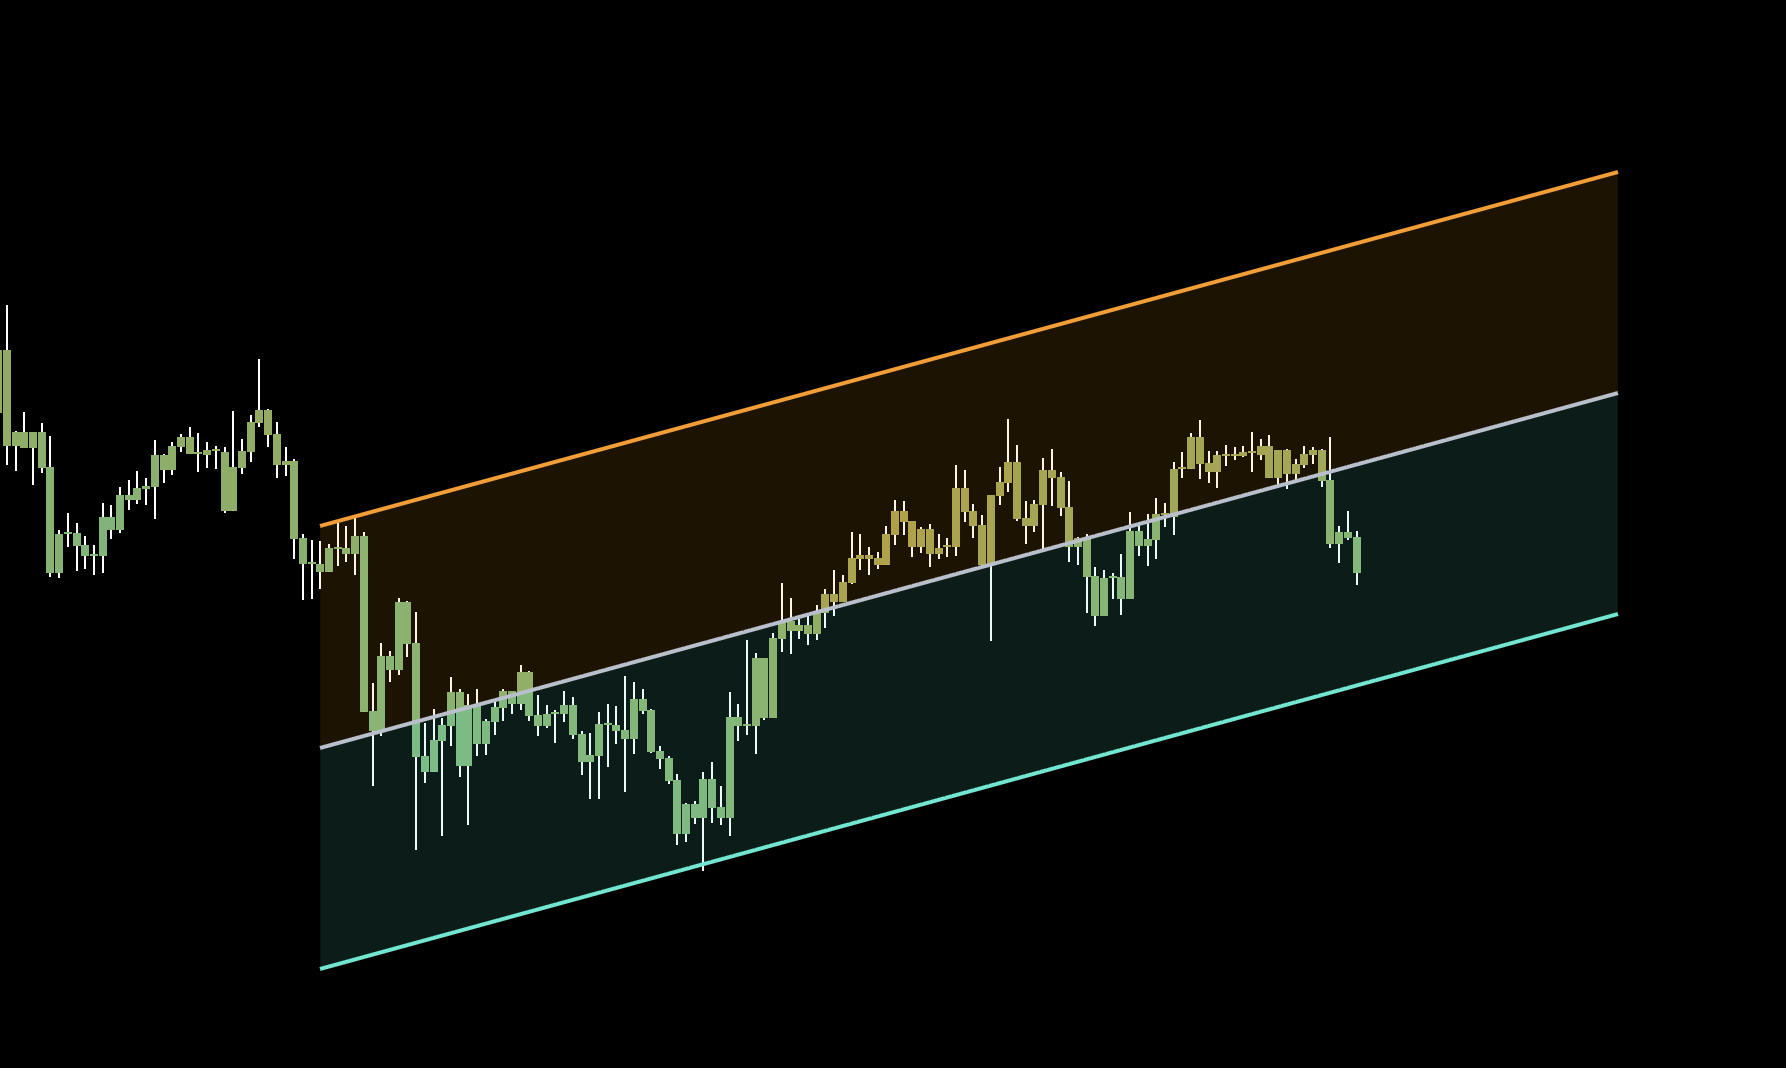
Price Channels
Use channel boundaries as dynamic support/resistance and reversal-search locations. After confirmation, use the midline as TP1 and the opposite boundary as the larger target; a confirmed break can switch the plan from mean reversion to break-and-retest.
Trend Lines
Use a trend-line break as evidence that the old move is weakening, then wait for CHoCH or a retest before entering. The line is a timing aid, not a standalone reversal signal.
Regression Channel
Use the center line as a baseline and the outer deviations as extended-price locations. An outer-boundary reversal can target the midline first, but a persistent move outside the channel warns against forcing mean reversion.
Dynamic Trendline Channel
Use the active paired trendlines to track changing structure. A channel break combined with Main signal and CHoCH is stronger evidence that the old direction is failing; the broken boundary can then become a retest area.
Bar Coloring
Use Latest Signal to keep directional memory visible between signals. Use Heat to visualize increasing reversal pressure near a planned location. Bar color is context and should not replace the Main signal or structure confirmation.
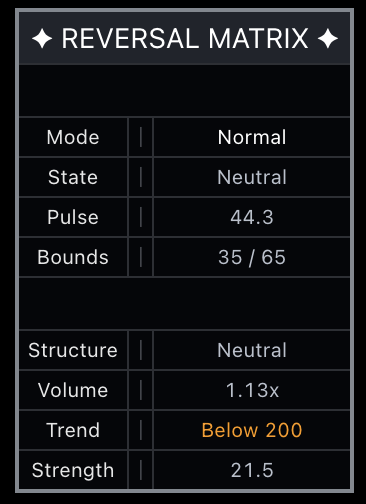
Dashboard
Use State, Structure, Volume, Trend, and Strength for one fast context check. Agreement can support normal conviction; mixed readings suggest waiting or reducing size. The Main signal and CHoCH remain the trigger.
Entry, Stop, and Targets
Trade Part
Long
Short
Entry
Recent Main Buy plus a reaction near support or Discount; CHoCH or a retest can improve timing.
Recent Main Sell plus a reaction near resistance or Premium; CHoCH or a retest can improve timing.
Stop
Below the supporting confluence or recent swing low—whichever defines invalidation.
Above the resistance confluence or recent swing high—whichever defines invalidation.
First target
1R (1:1) or the nearest resistance.
1R (1:1) or the nearest support.
Final targets
Scale at 2R and 3R, or at the next resistance levels.
Scale at 2R and 3R, or at the next support levels.
Inputs and Alerts
Keep Main signals and Market Structure visible.
Enable Soft signals only when early preparation is useful.
Choose two or three complementary location tools; hide the rest.
Use one channel or trend-line tool for timing instead of stacking all of them.
Create alerts for your sequence—for example Lower Zone → Main Buy → CHoCH—rather than enabling every alert.
Recommended
Best For
STM trading, lower-timeframe reversals, pullbacks, and day-trading opportunities.
Recommended Setup
Use the Primary Reversal Sequence: keep an RM+ signal from roughly the latest 10–20 bars in context, then act near support / Discount or resistance / Premium. Use CHoCH and retests when available.
Why
The setup can develop naturally across several bars instead of requiring every tool to trigger at once. The complete STM method will be explained separately.
Reversal
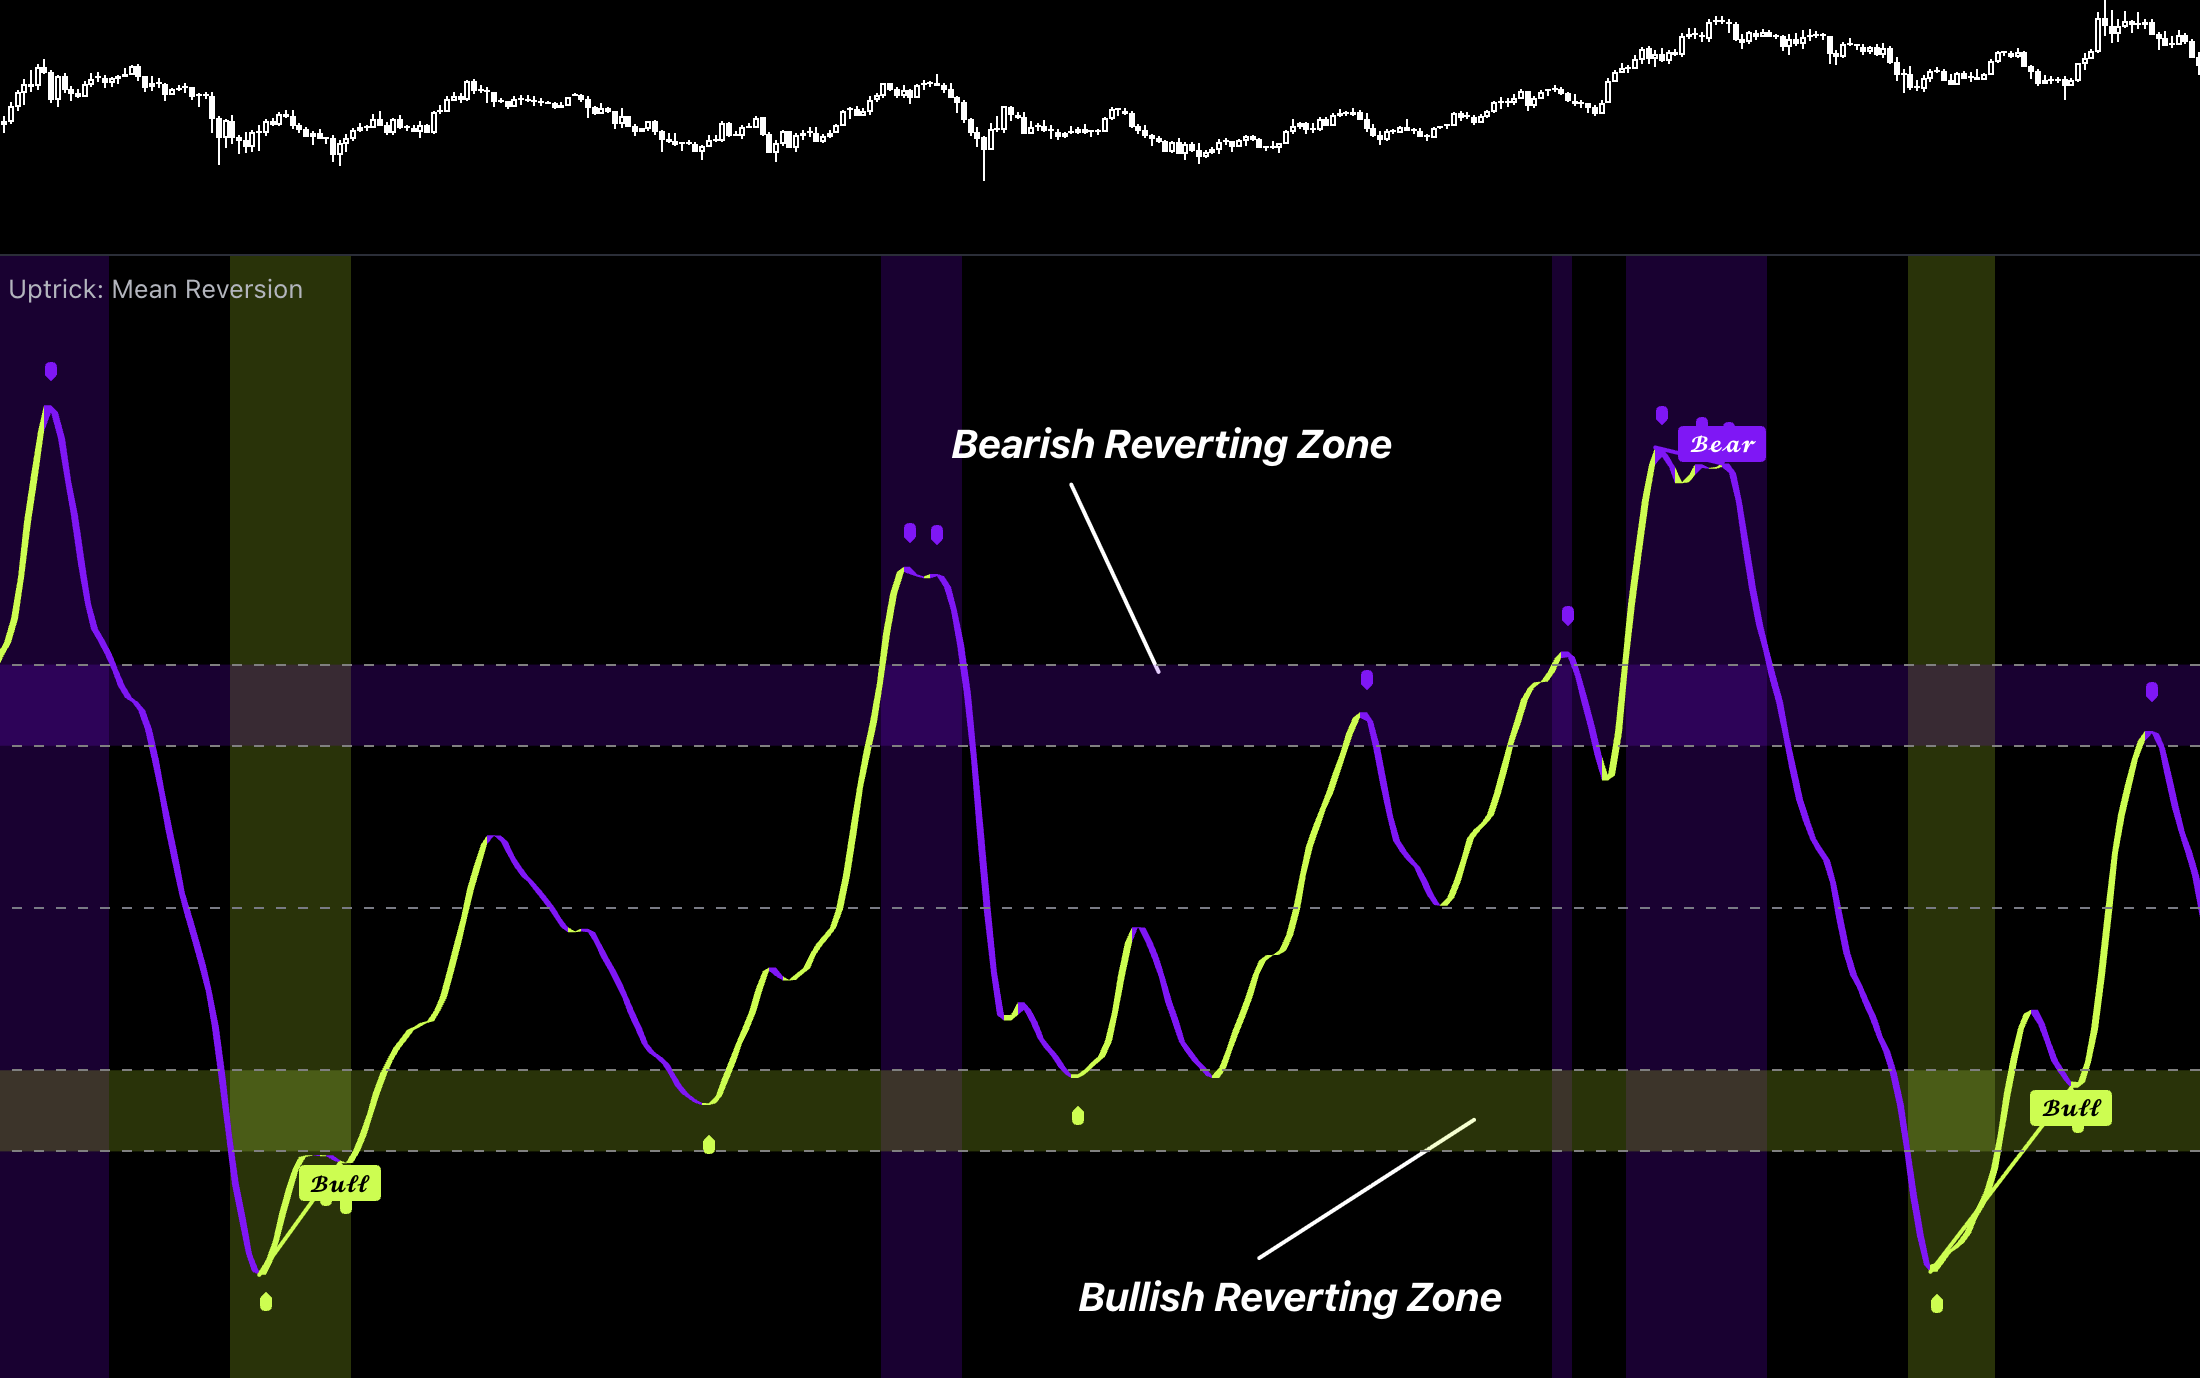
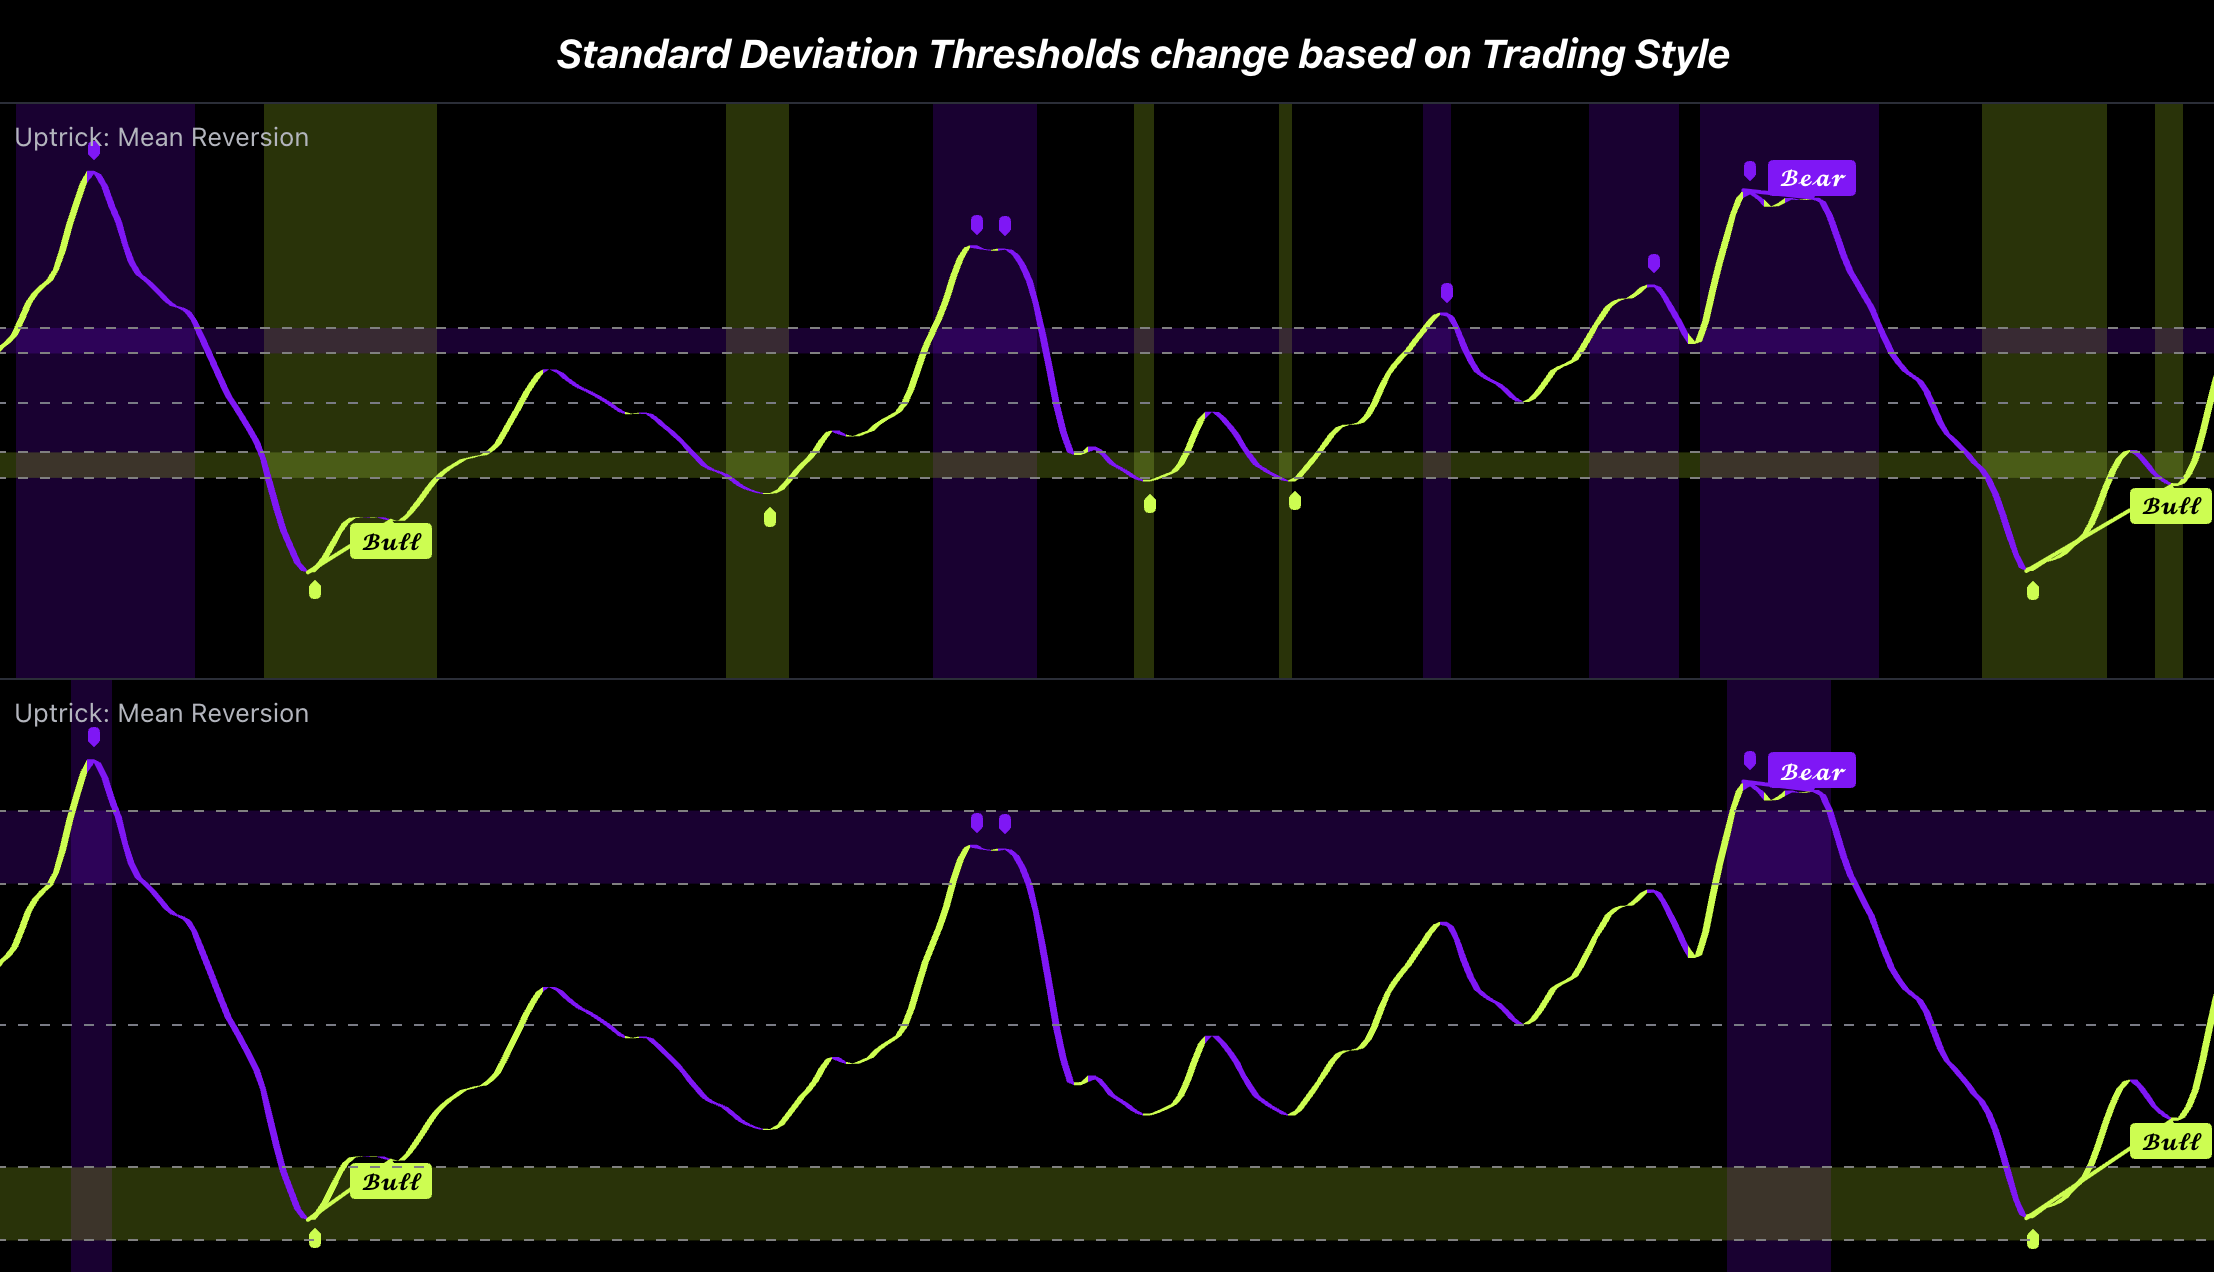
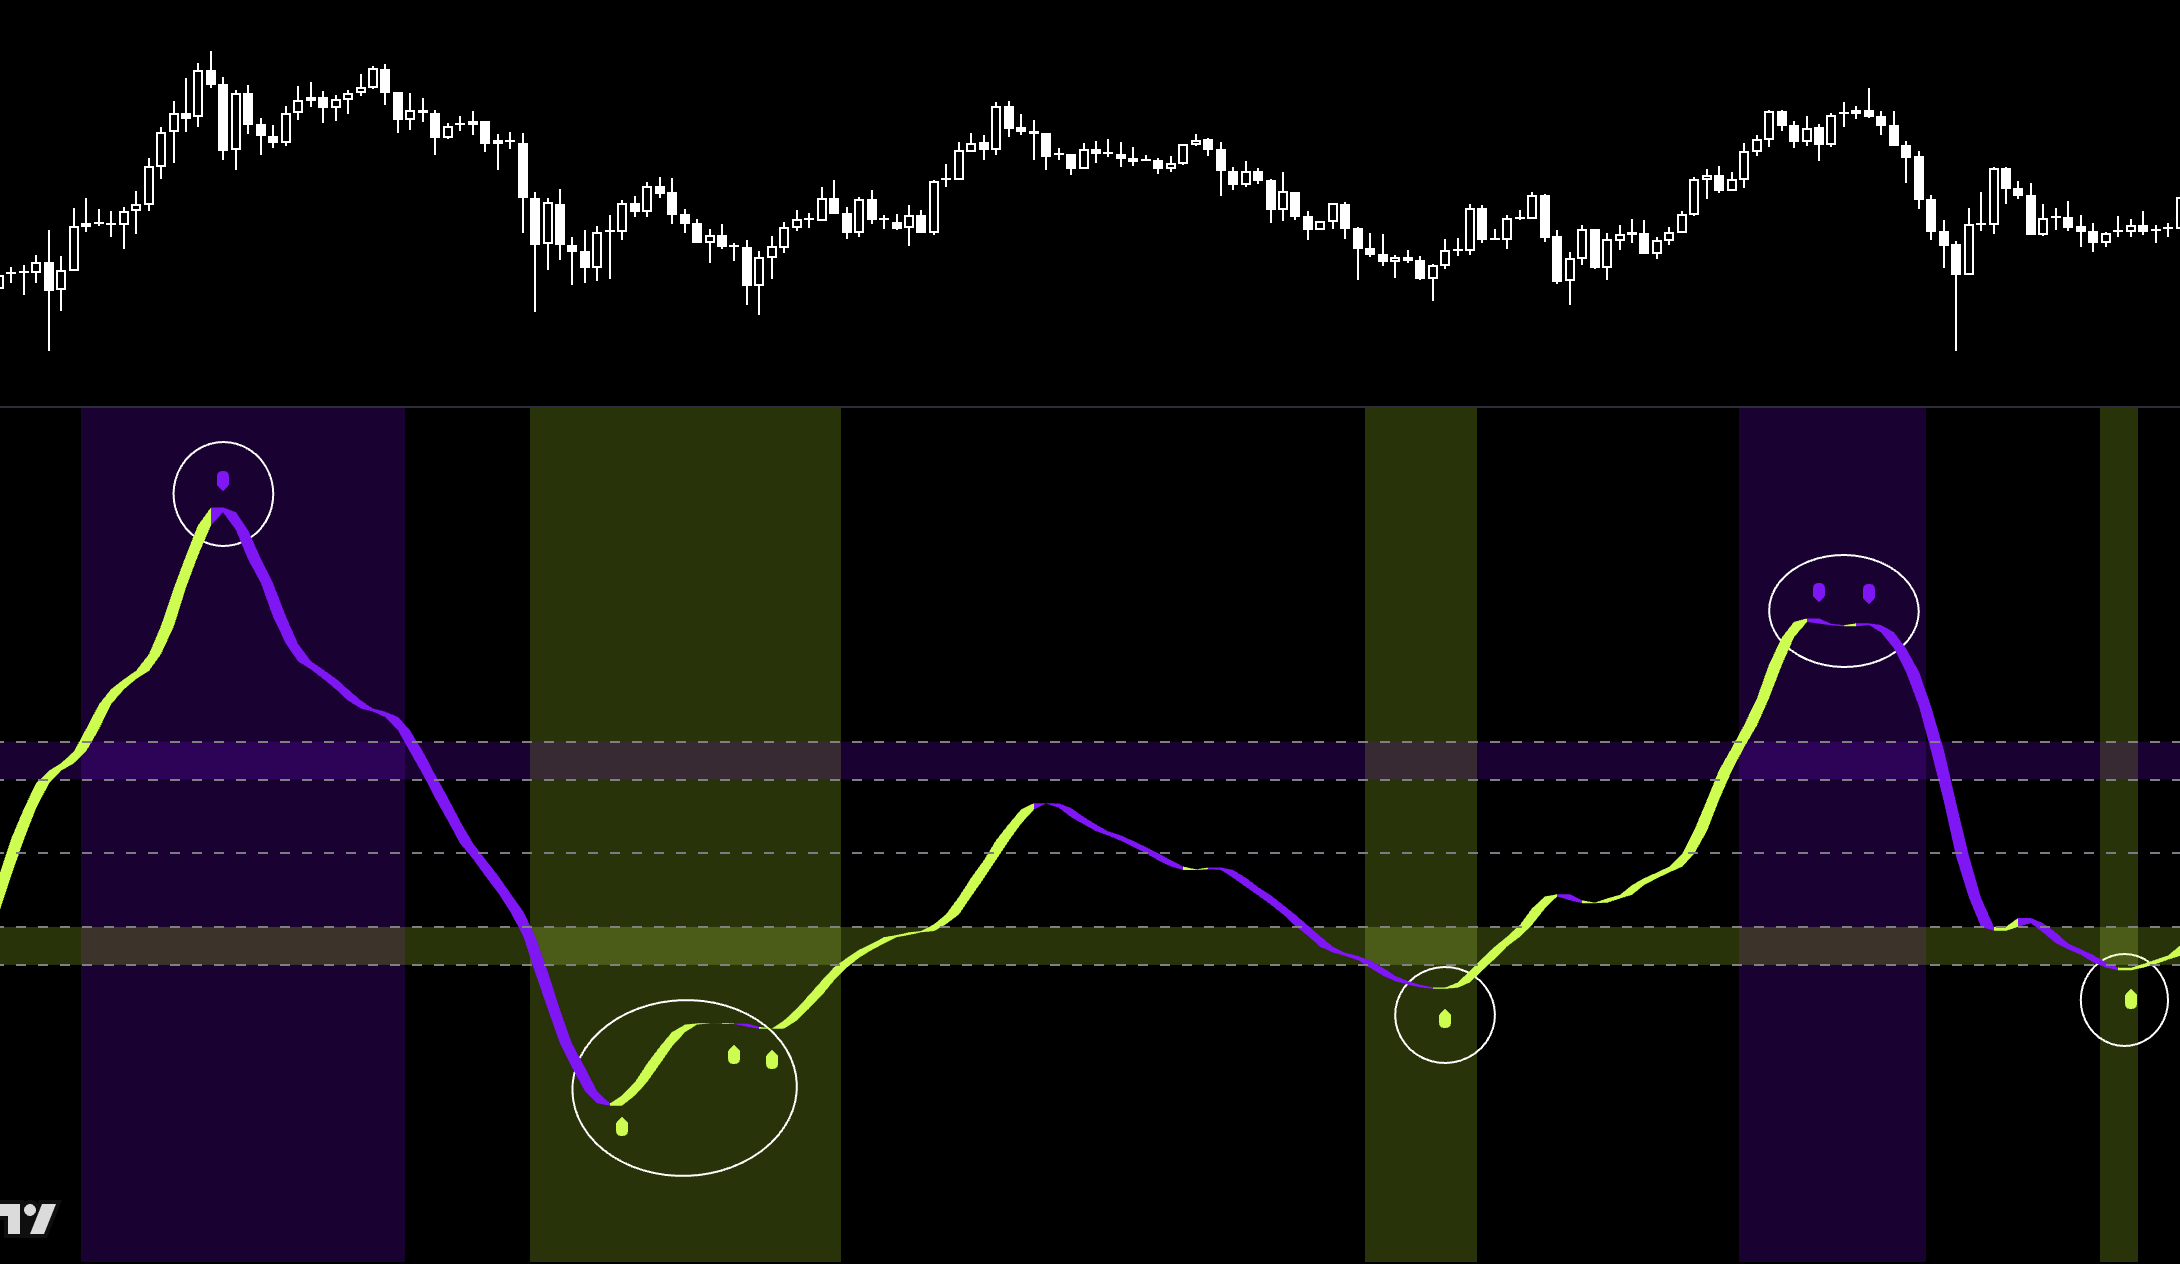
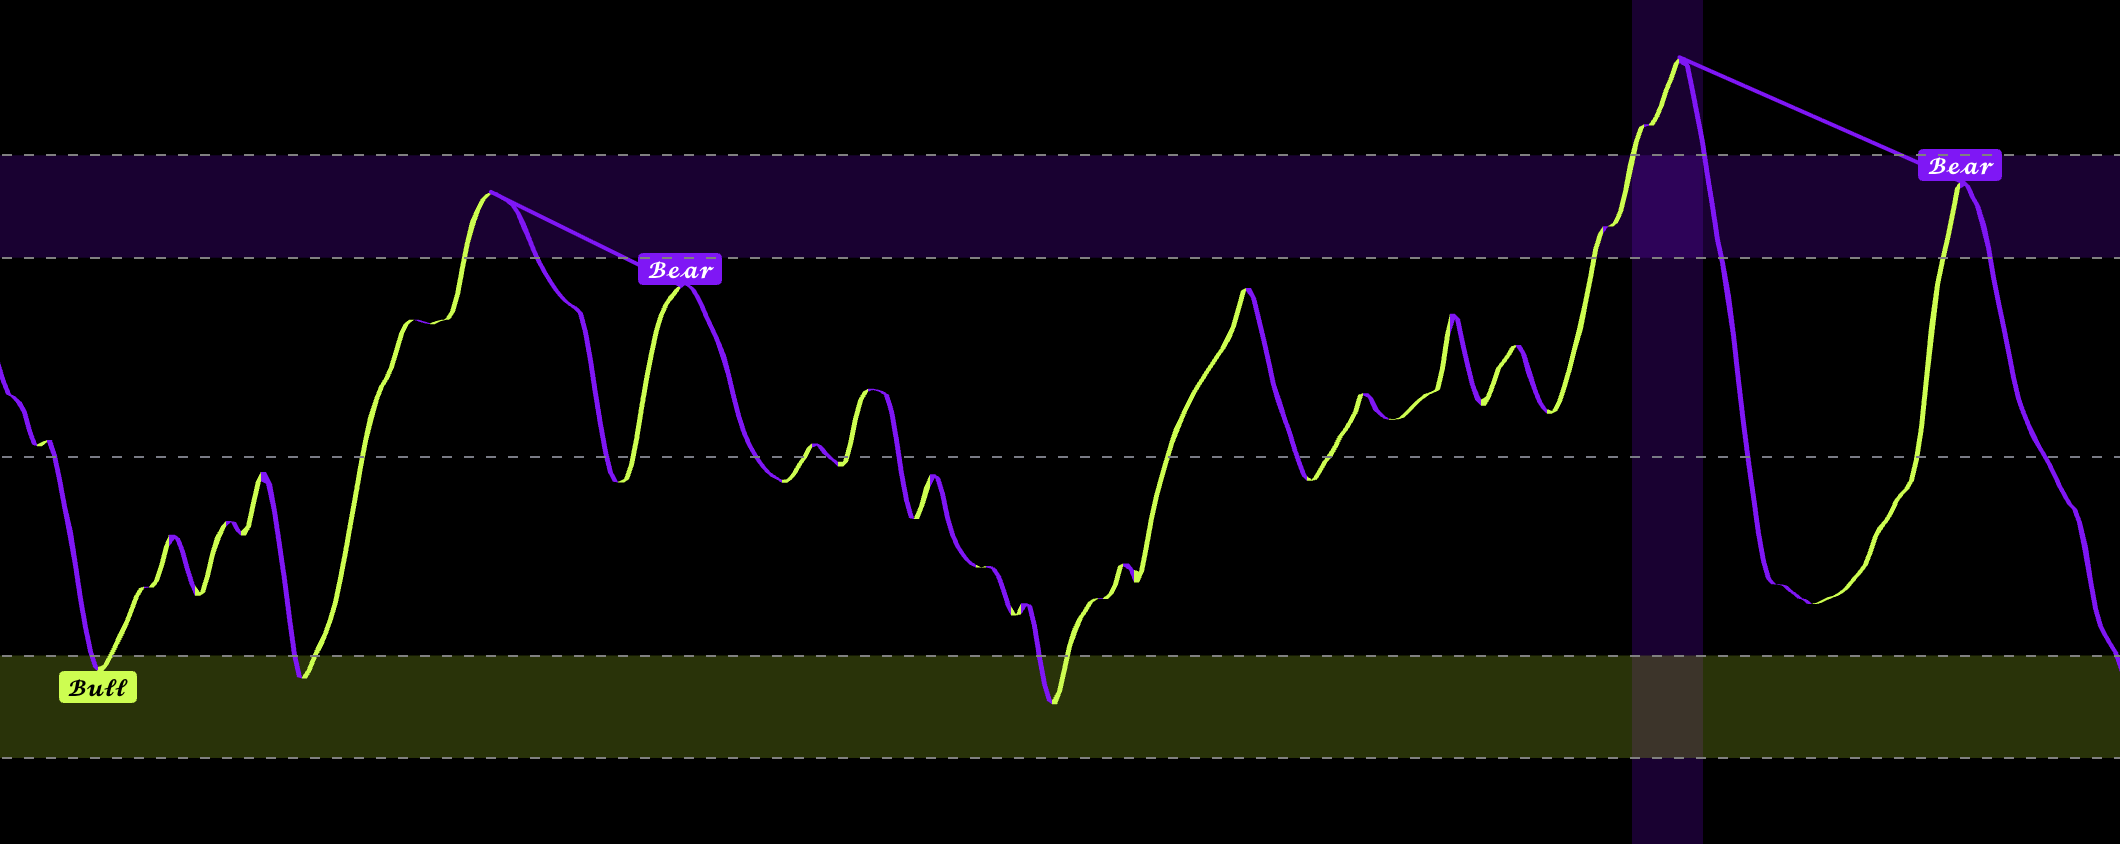
Mean Reversion
Identify local reversion points and profit-taking opportunities without trying to predict the final top or bottom.
Introduction
Mean Reversion measures how extended price is and highlights possible short-term moves back toward the mean. It is designed to find local reversion points and profit-taking opportunities—not the absolute top or bottom of a trend.
◆An oversold or lower-extreme signal can appear while a downtrend continues much lower. An overbought or upper-extreme signal can also appear while an uptrend continues higher. Treat the reading as an opportunity to protect profit or prepare for a local snapback, not as proof that the entire trend has ended.
How to Use
Start with Neutral style and wait for price to reach an upper or lower extreme.
When holding a Long, use an upper extreme or Sell signal as a potential partial-profit or exit opportunity. When holding a Short, use a lower extreme or Buy signal the same way.
Do not automatically reverse direction. The existing trend can continue after the signal, especially when the broader bias remains strong.
For a separate local reversion trade, wait for a matching reversal signal and supportive price reaction. Place the stop beyond the recent extreme.
Target normalization toward the center first. Use the opposite side only when the local reversion develops into a larger move.
Features and Inputs
Extreme Zones
Use the lower extreme as a Short profit-taking or local Long-reversion area, and the upper extreme as a Long profit-taking or local Short-reversion area. An extreme is not a confirmed trend top or bottom.
Trading Styles
Neutral is the starting point; Conservative gives fewer deeper setups and Aggressive gives earlier noisier warnings.
Reversal Signals
Use Buy/Sell primarily as a profit-taking warning for an opposing position. For a new countertrend trade, act only after the correct extreme and a supportive price reaction appear.
Divergence
Use as confirmation that pressure is weakening, never as a standalone entry.
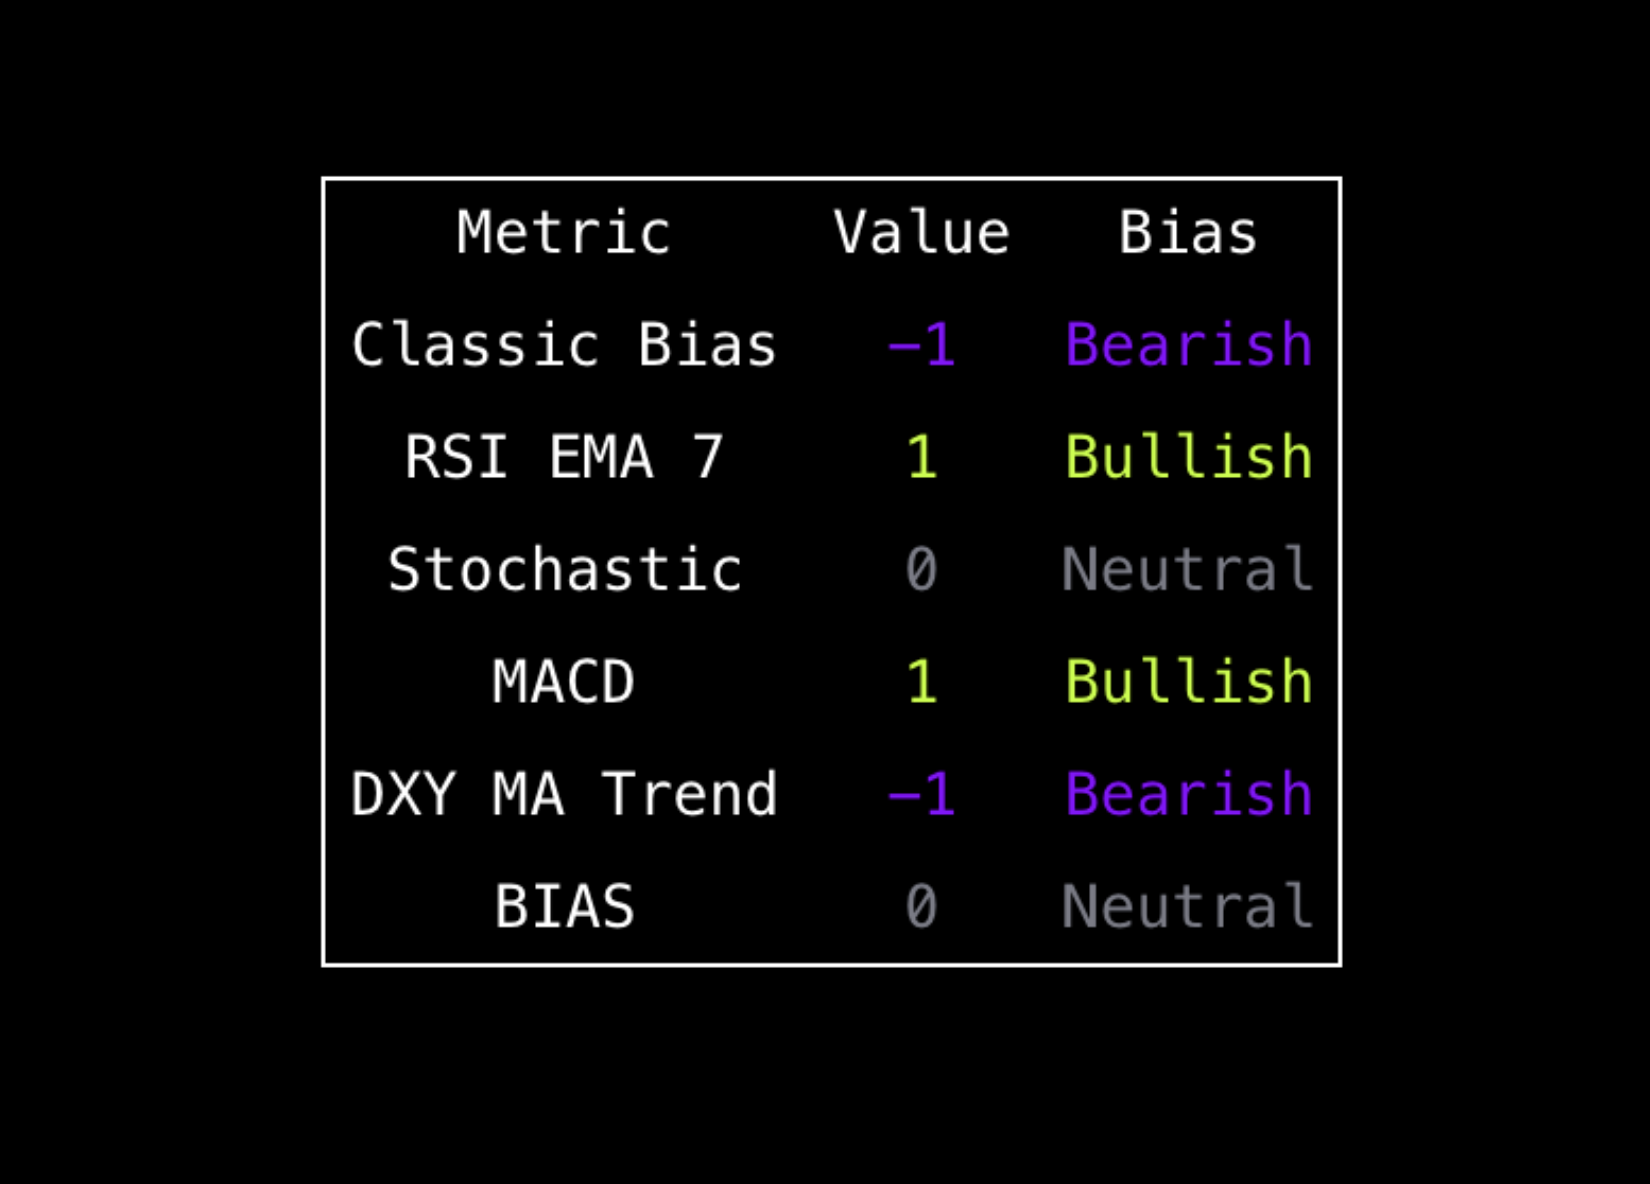
Bias Table
Supportive bias allows normal conviction; strong disagreement means reduce size or skip.
Recommended
Best For
Finding profit-taking opportunities and short-term reversion points on any timeframe.
Recommended Setup
Use an opposing extreme or reversal signal to reduce an existing winner. Open a countertrend trade only when price also begins reacting toward the mean.
Why
It identifies statistically stretched price, but stretched price can become even more extended before the broader trend ends.
Oscillator
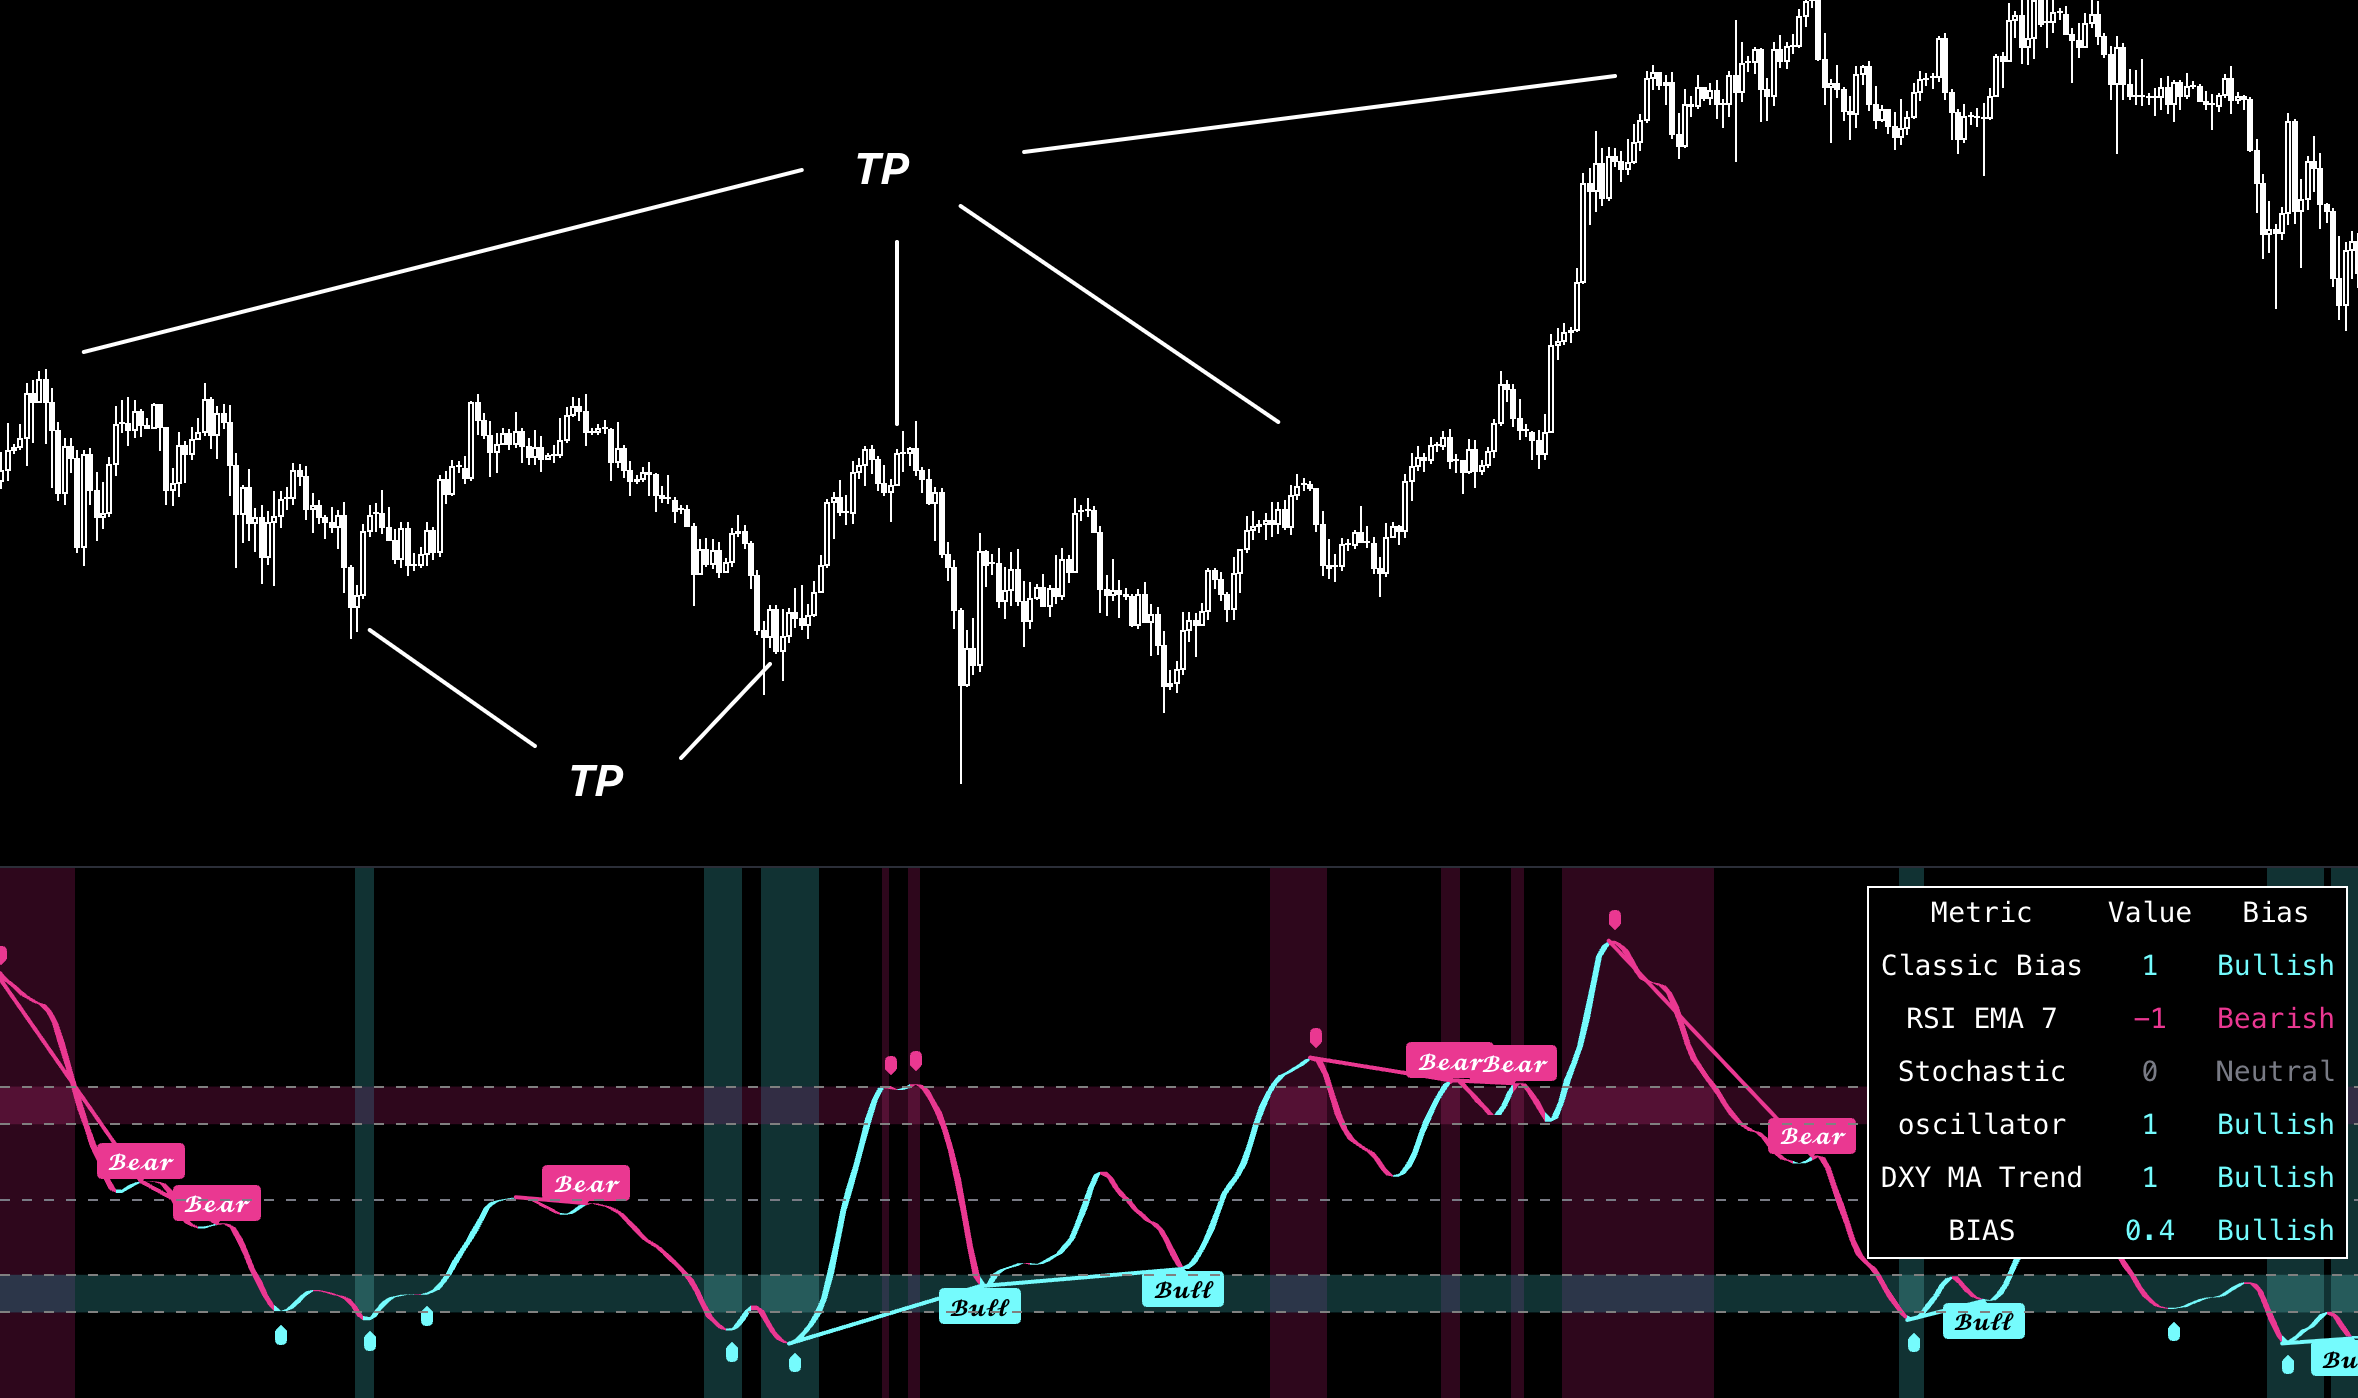
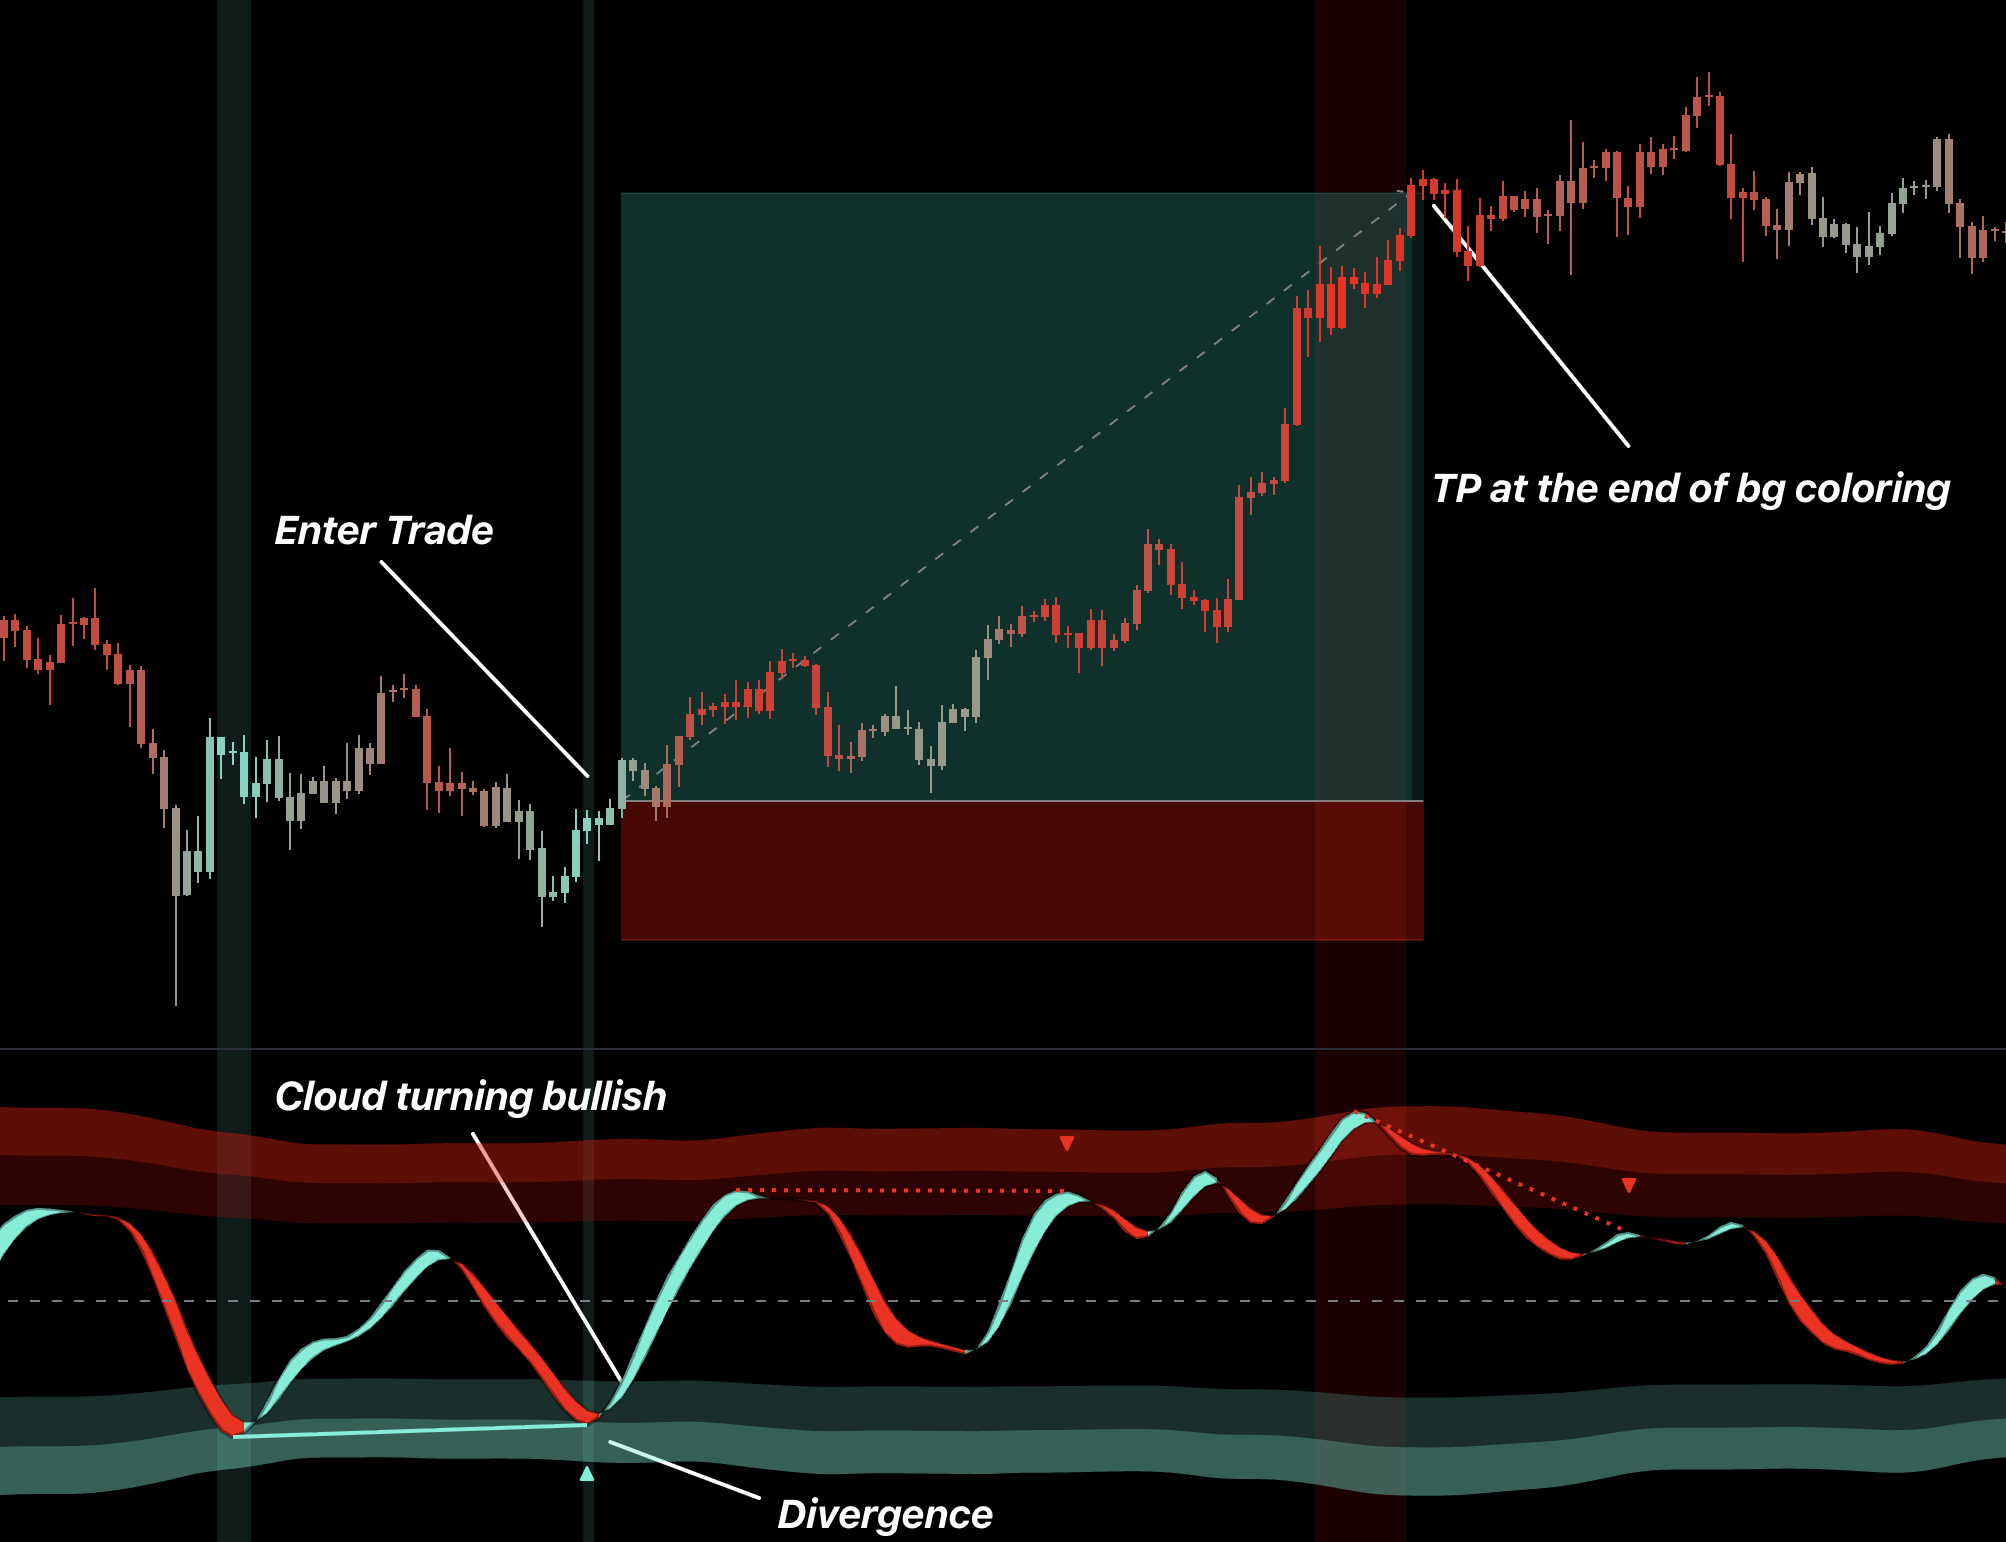
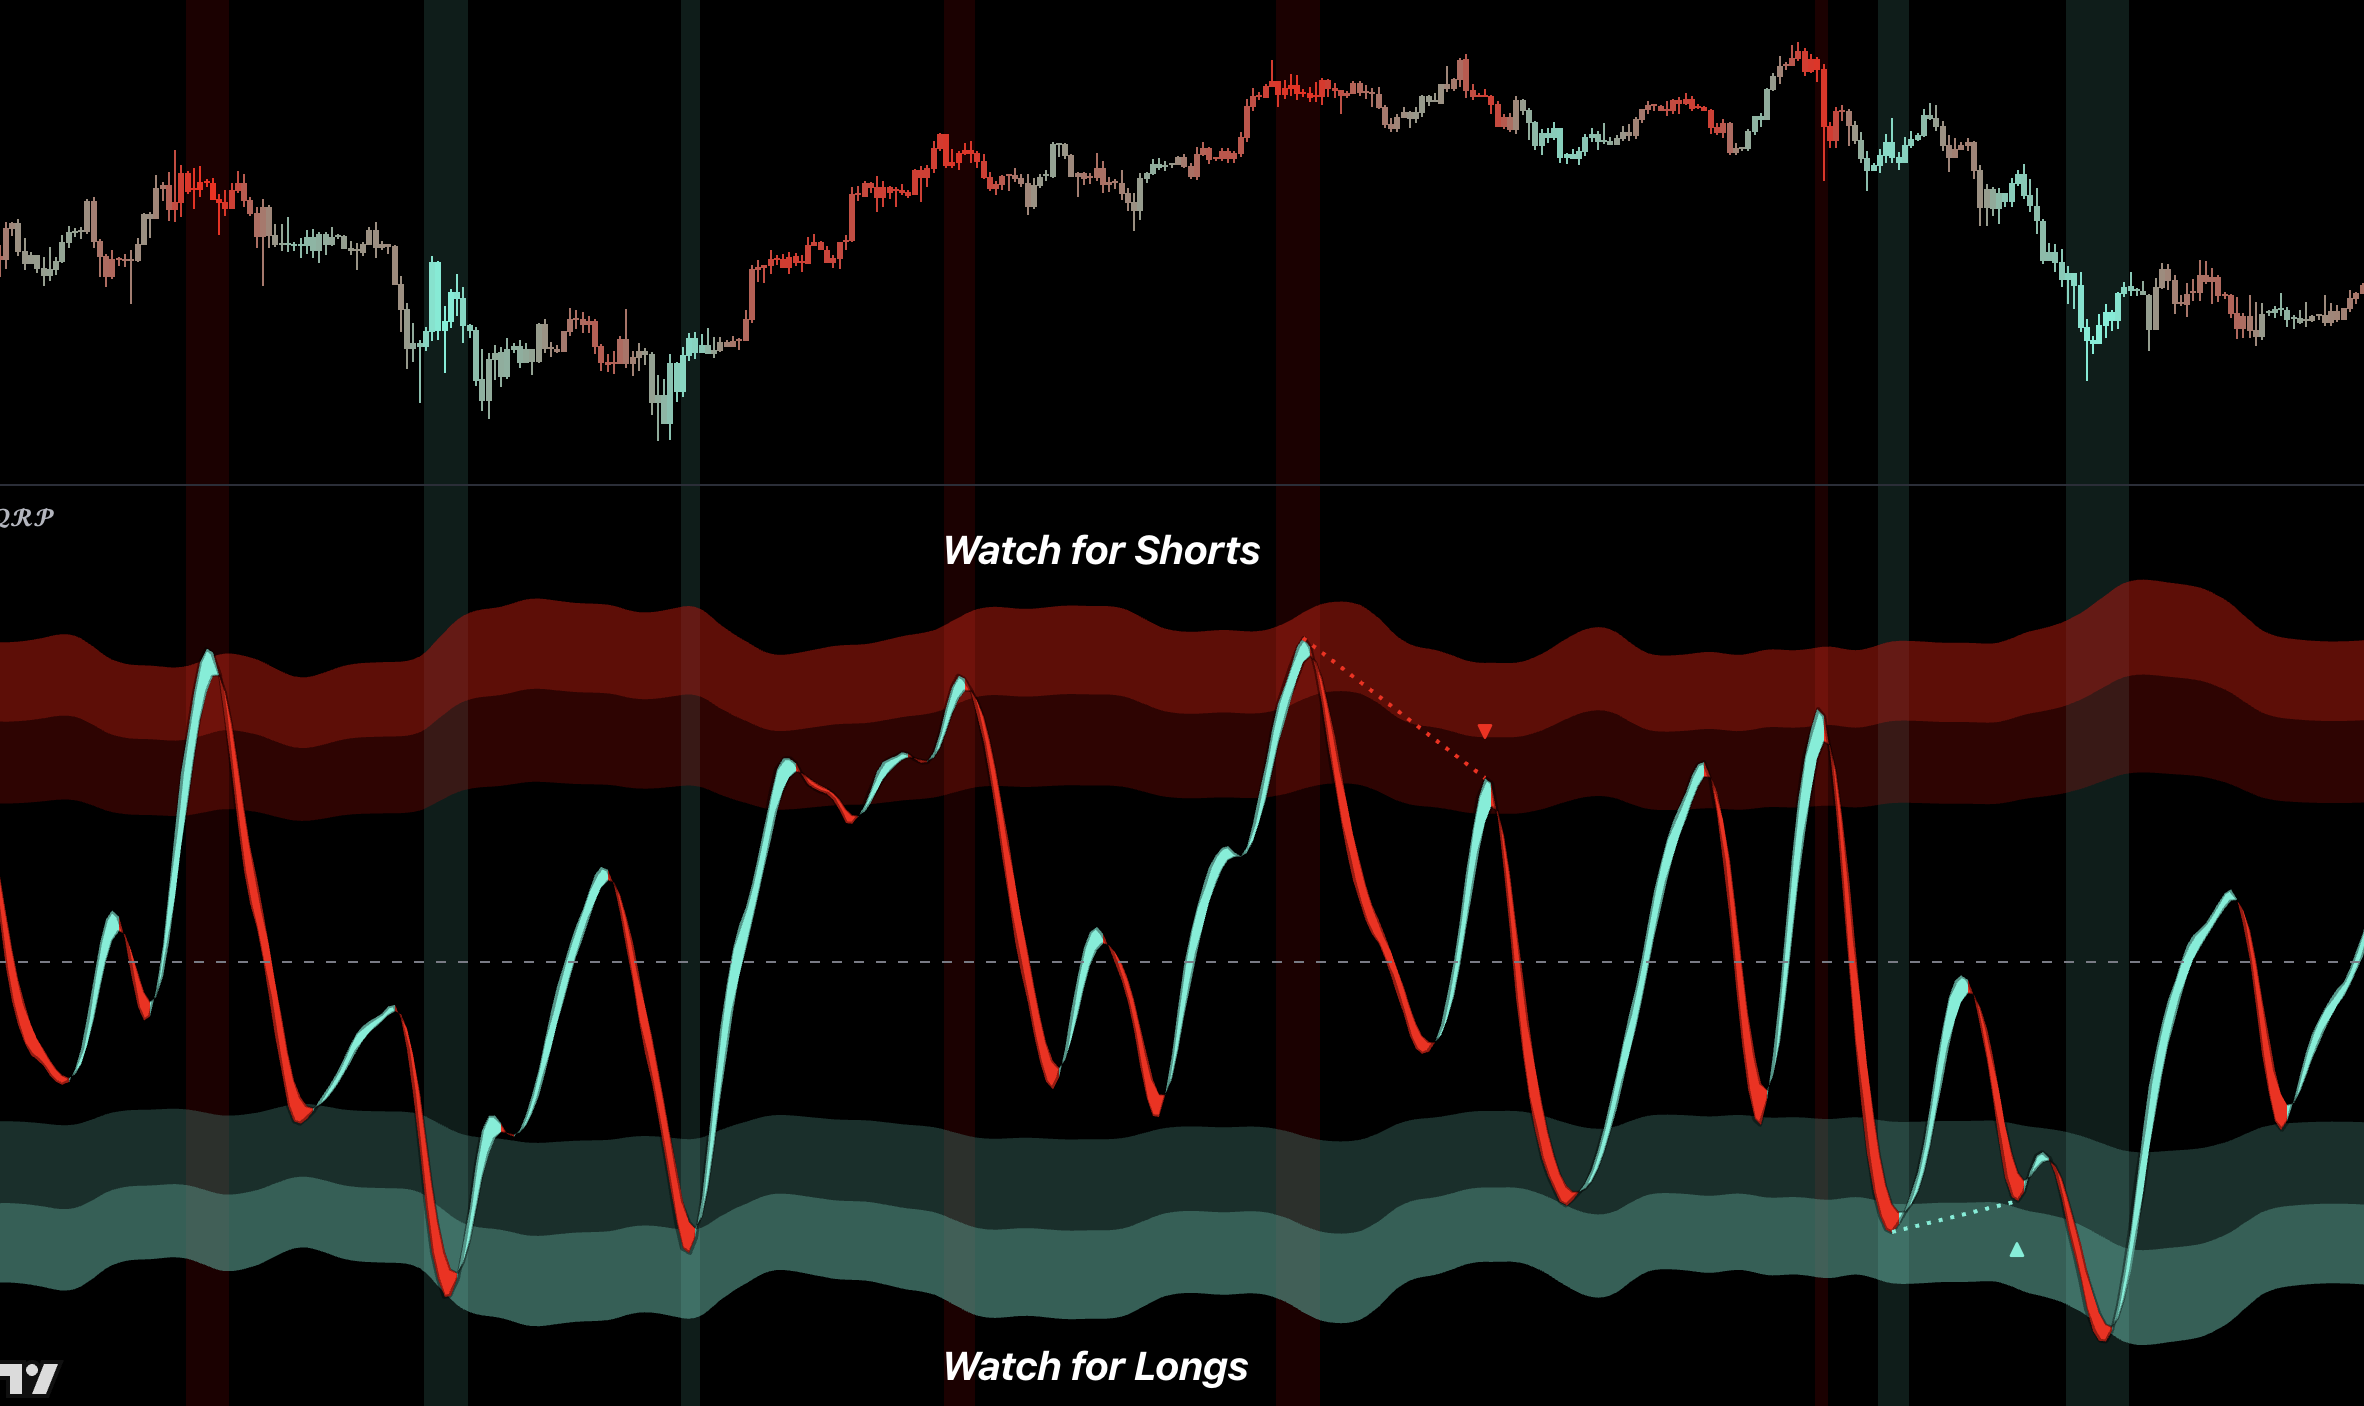
Quantum RSI +
Confirm trend-following trades, identify local exhaustion, and manage profits before momentum fully reverses.
Introduction
Keep the default settings and use Classic mode. Quantum RSI is primarily a confirmation and exit-management indicator used alongside a trend-following system. Its extremes help identify local tops and bottoms where an existing position can be reduced or closed. It can also be used for standalone local reversal setups, but not every band touch should become a trade.
How to Use
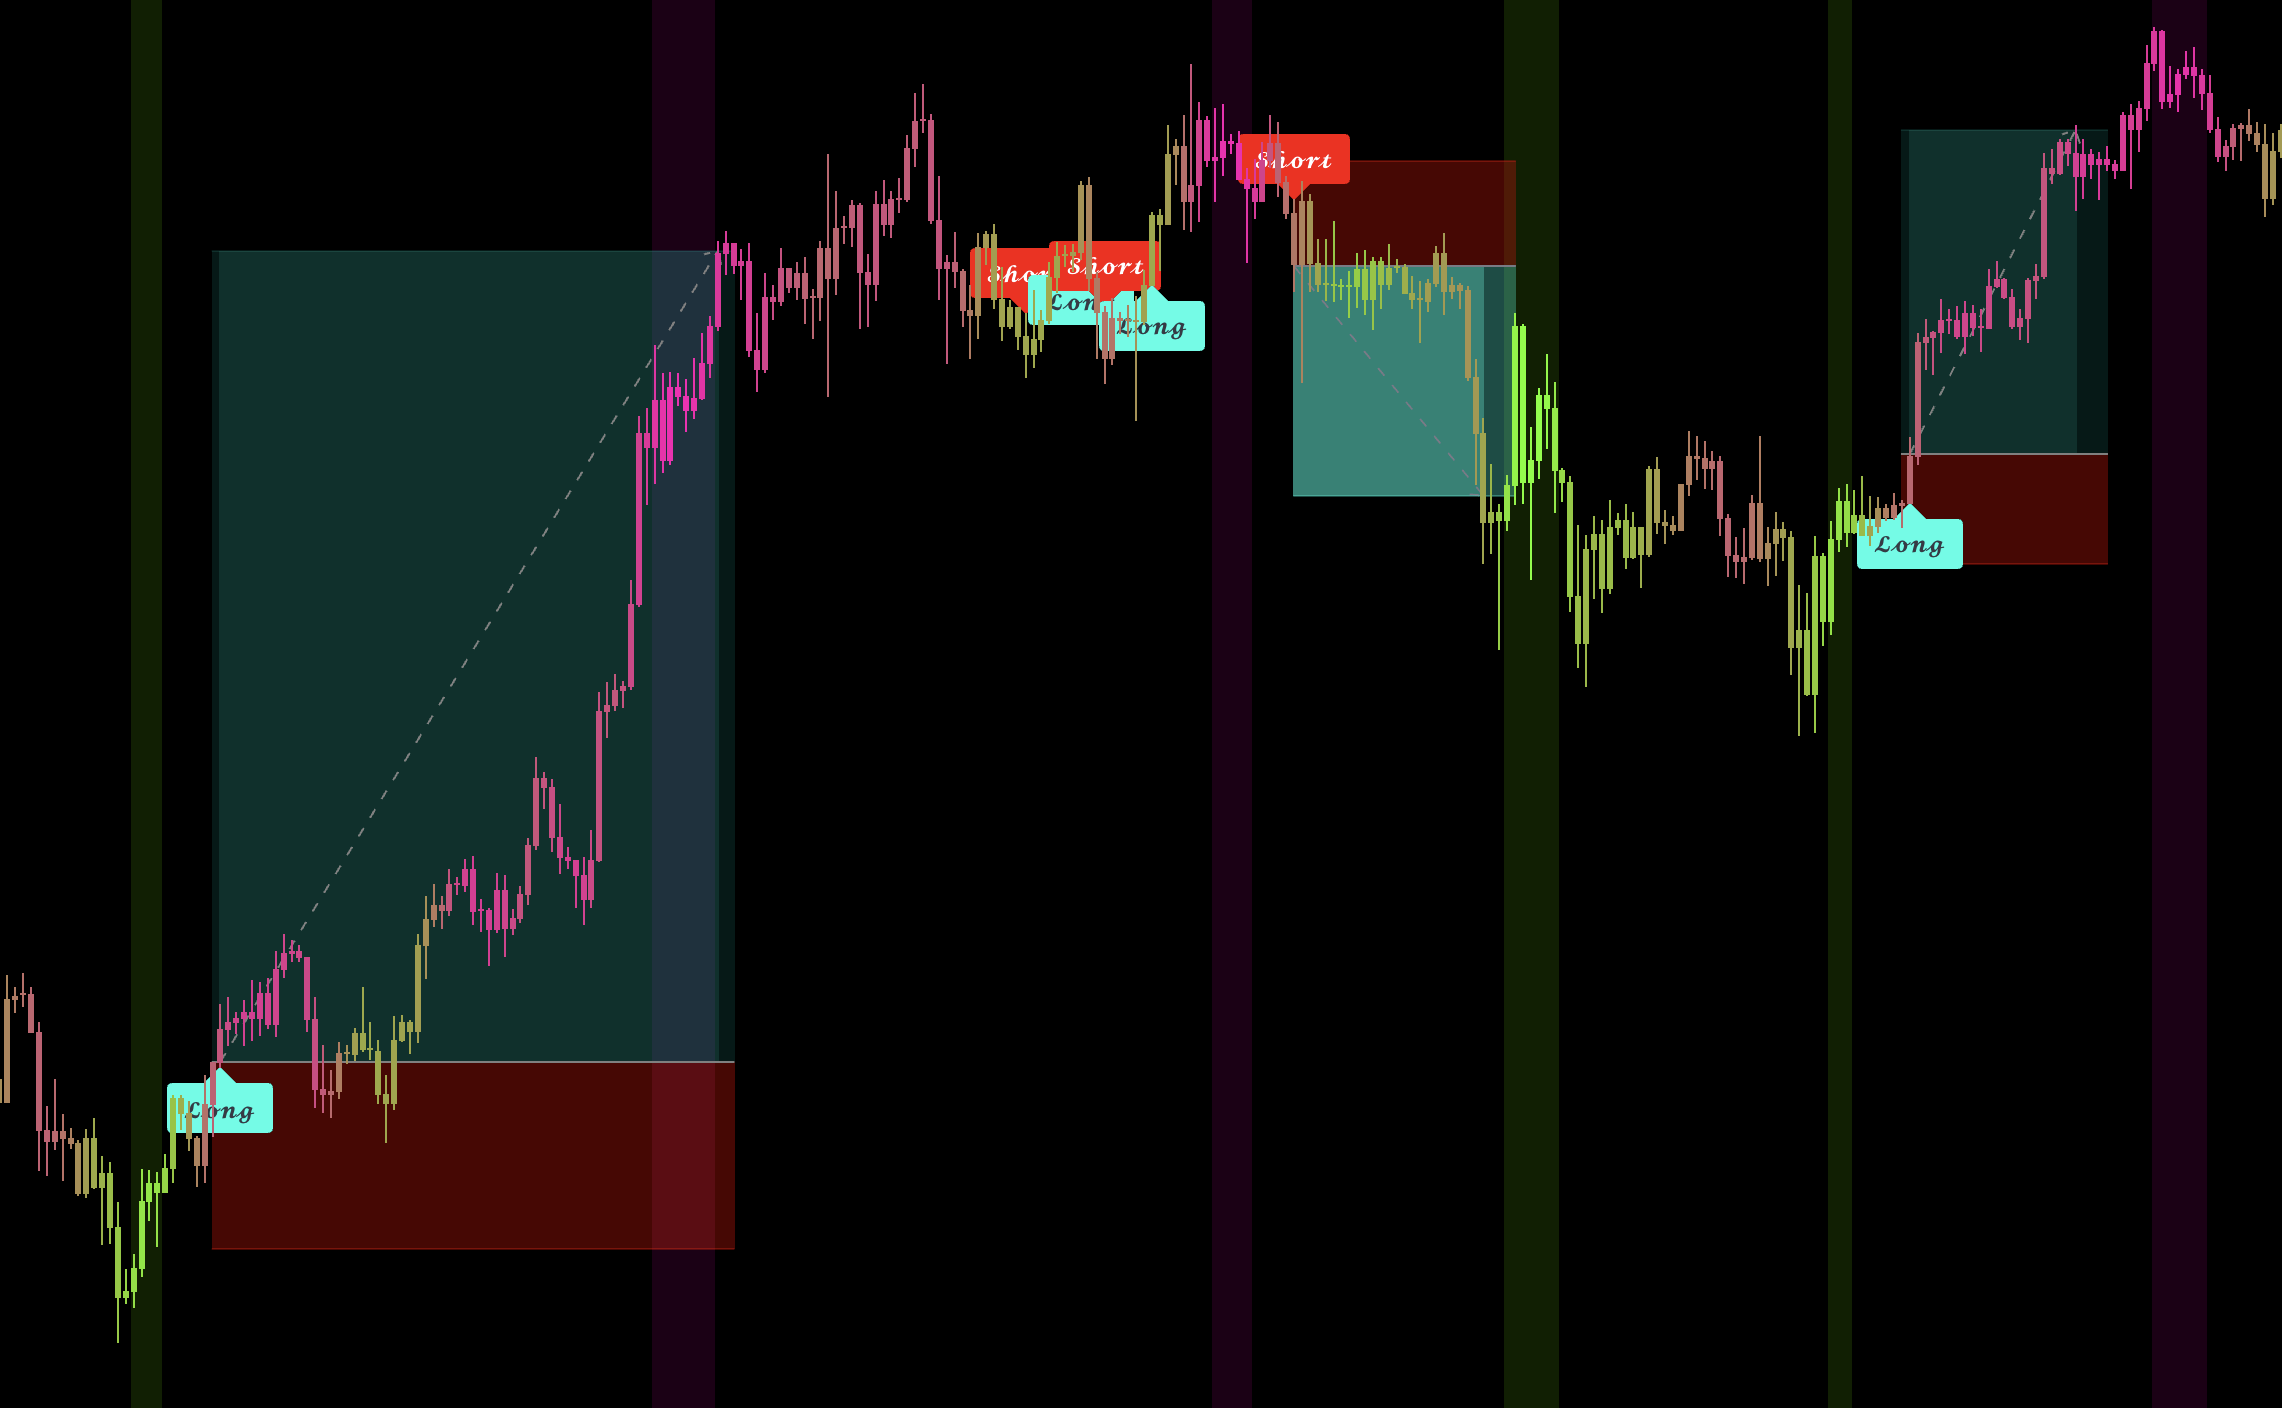
1. Primary Use: Trend Confirmation and Exits
Take trade direction from the trend-following indicator. Quantum RSI should manage the position rather than replace the original trend signal.
For a Long position, watch the upper bands for a potential local top. For a Short position, watch the lower bands for a potential local bottom.
Use weakening momentum, divergence, or a Signal Cloud turn to confirm that the active move may be losing strength.
Use the Main band as a partial-profit area and the Outer band as the strongest exit area. Reduce or close the position instead of automatically opening a countertrend trade.
2. Secondary Use: Local Reversal Setups
Use the zero line as context: above zero favors bullish conditions and below zero favors bearish conditions.
Look for Long reversals near the lower bands and Short reversals near the upper bands.
Wait for divergence, a Signal Cloud turn, or a matching price reaction before entering. Place the stop beyond the recent swing.
Take the first profit near the zero line. Use the opposite bands only when the reversal continues into a larger move.
Features and Overlays
Classic Mode
Use for the standard calibrated workflow.
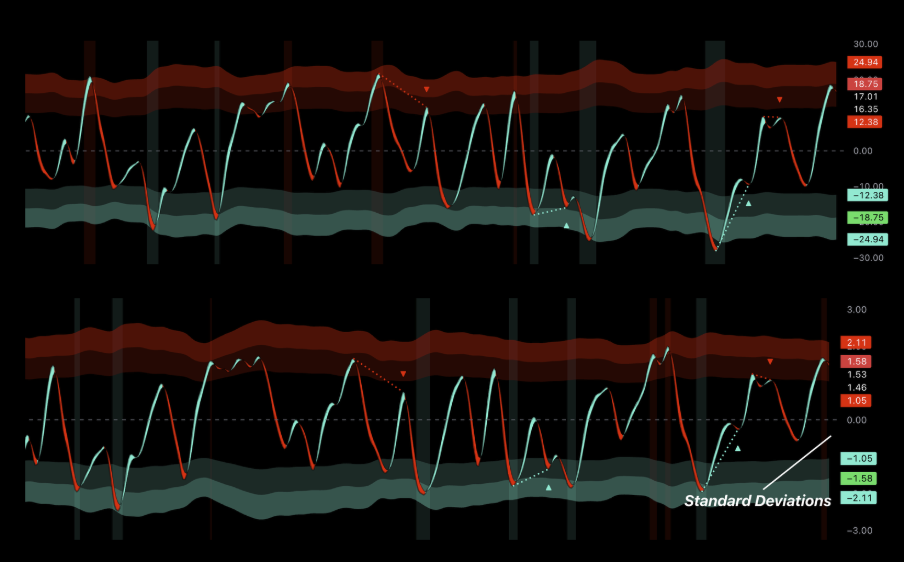
Z-Score Mode
Use only in a separately tested advanced workflow.
Inner, Main, and Outer Bands
Use them as early attention, meaningful stretch, and extreme profit-taking/reversal location.
Signal Cloud
Use a Cloud turn as the timing confirmation after an extreme.
Zero Line
Use as the direction filter and first normalization target.
Background Zones
Use the shading to spot extreme location quickly; it does not replace confirmation.
Divergence
Use as a warning that pressure is weakening, not as a standalone entry.
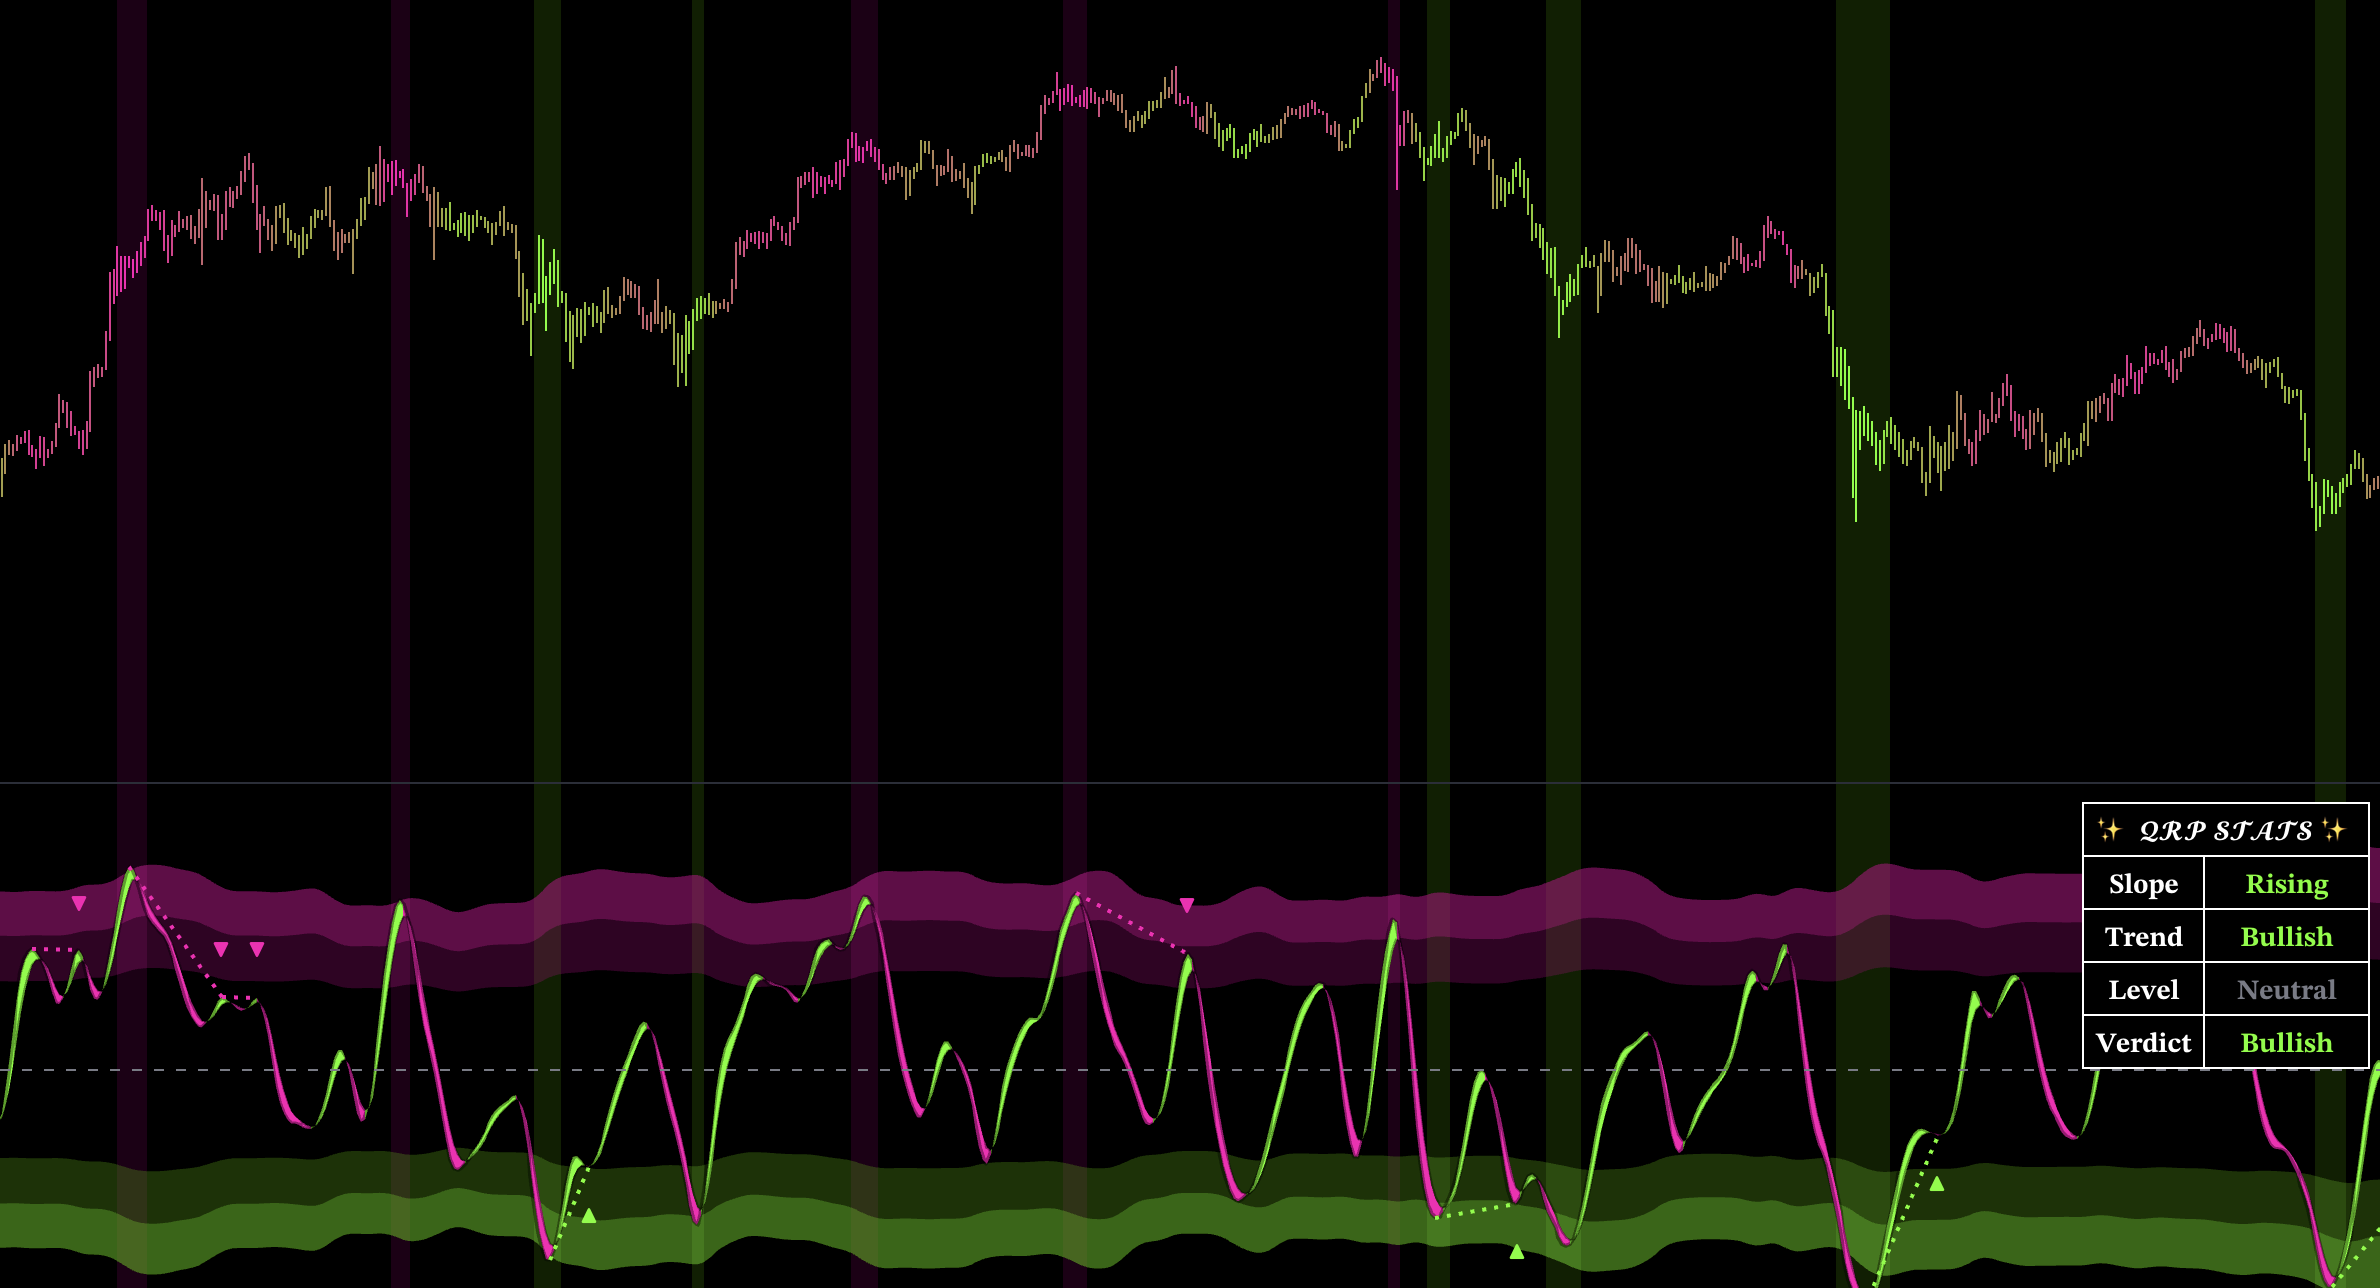
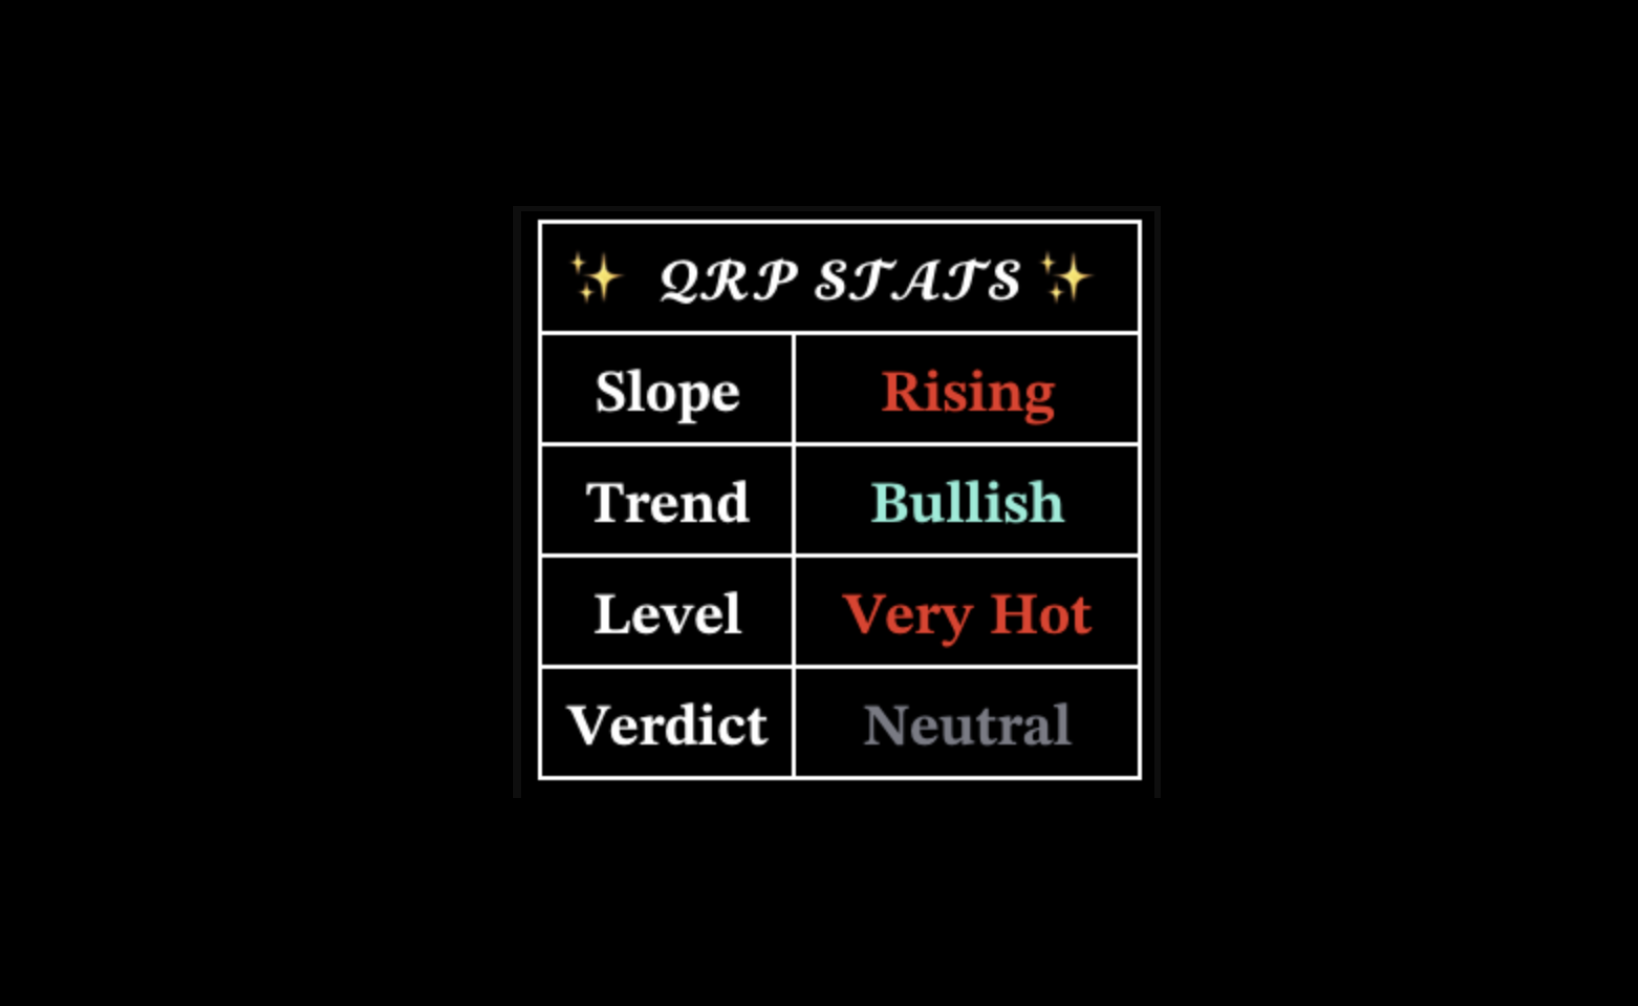
Dashboard
Use aligned slope, trend, level, and verdict to support conviction.
Inputs
Keep the calibrated core defaults. Use Classic for normal trading and Z-Score only in a separately tested advanced workflow. Visibility, colors, and dashboard position can be changed without changing the intended signal setup.
Recommended
Best For
Catching local tops and bottoms so existing trend-following positions can be reduced or exited.
Recommended Setup
Pair Quantum RSI with a trend-following indicator. Follow the trend indicator for direction and use Quantum RSI extremes, divergence, and Cloud turns for profit-taking.
Why
It can warn that the current move is weakening before the slower trend-following indicator produces its exit signal.
Oscillator
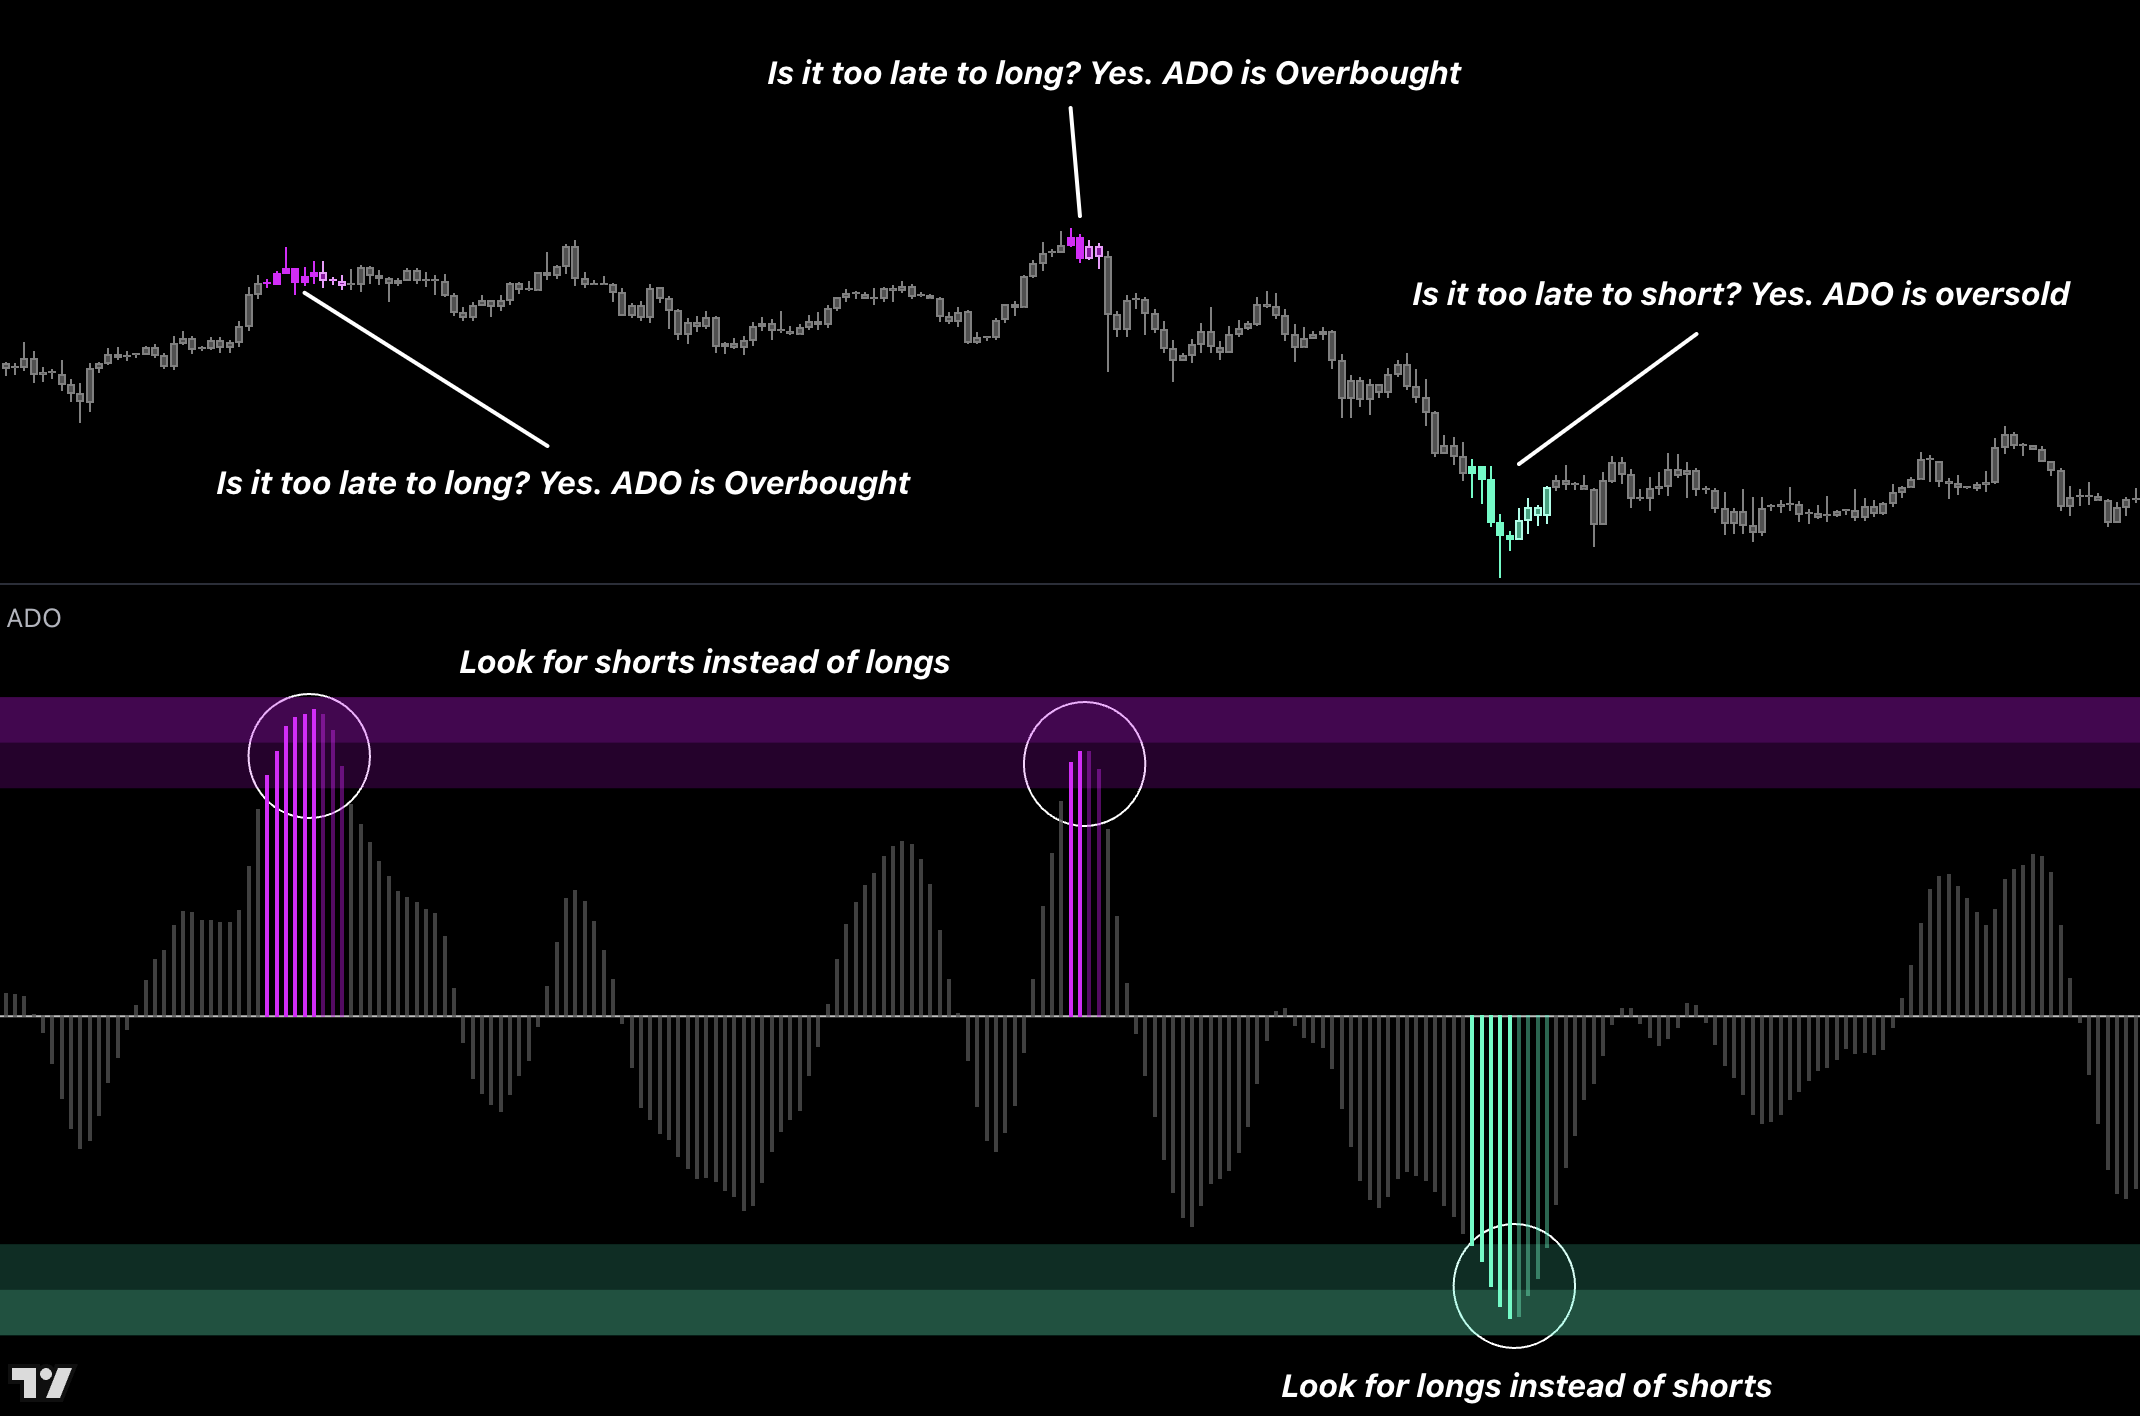
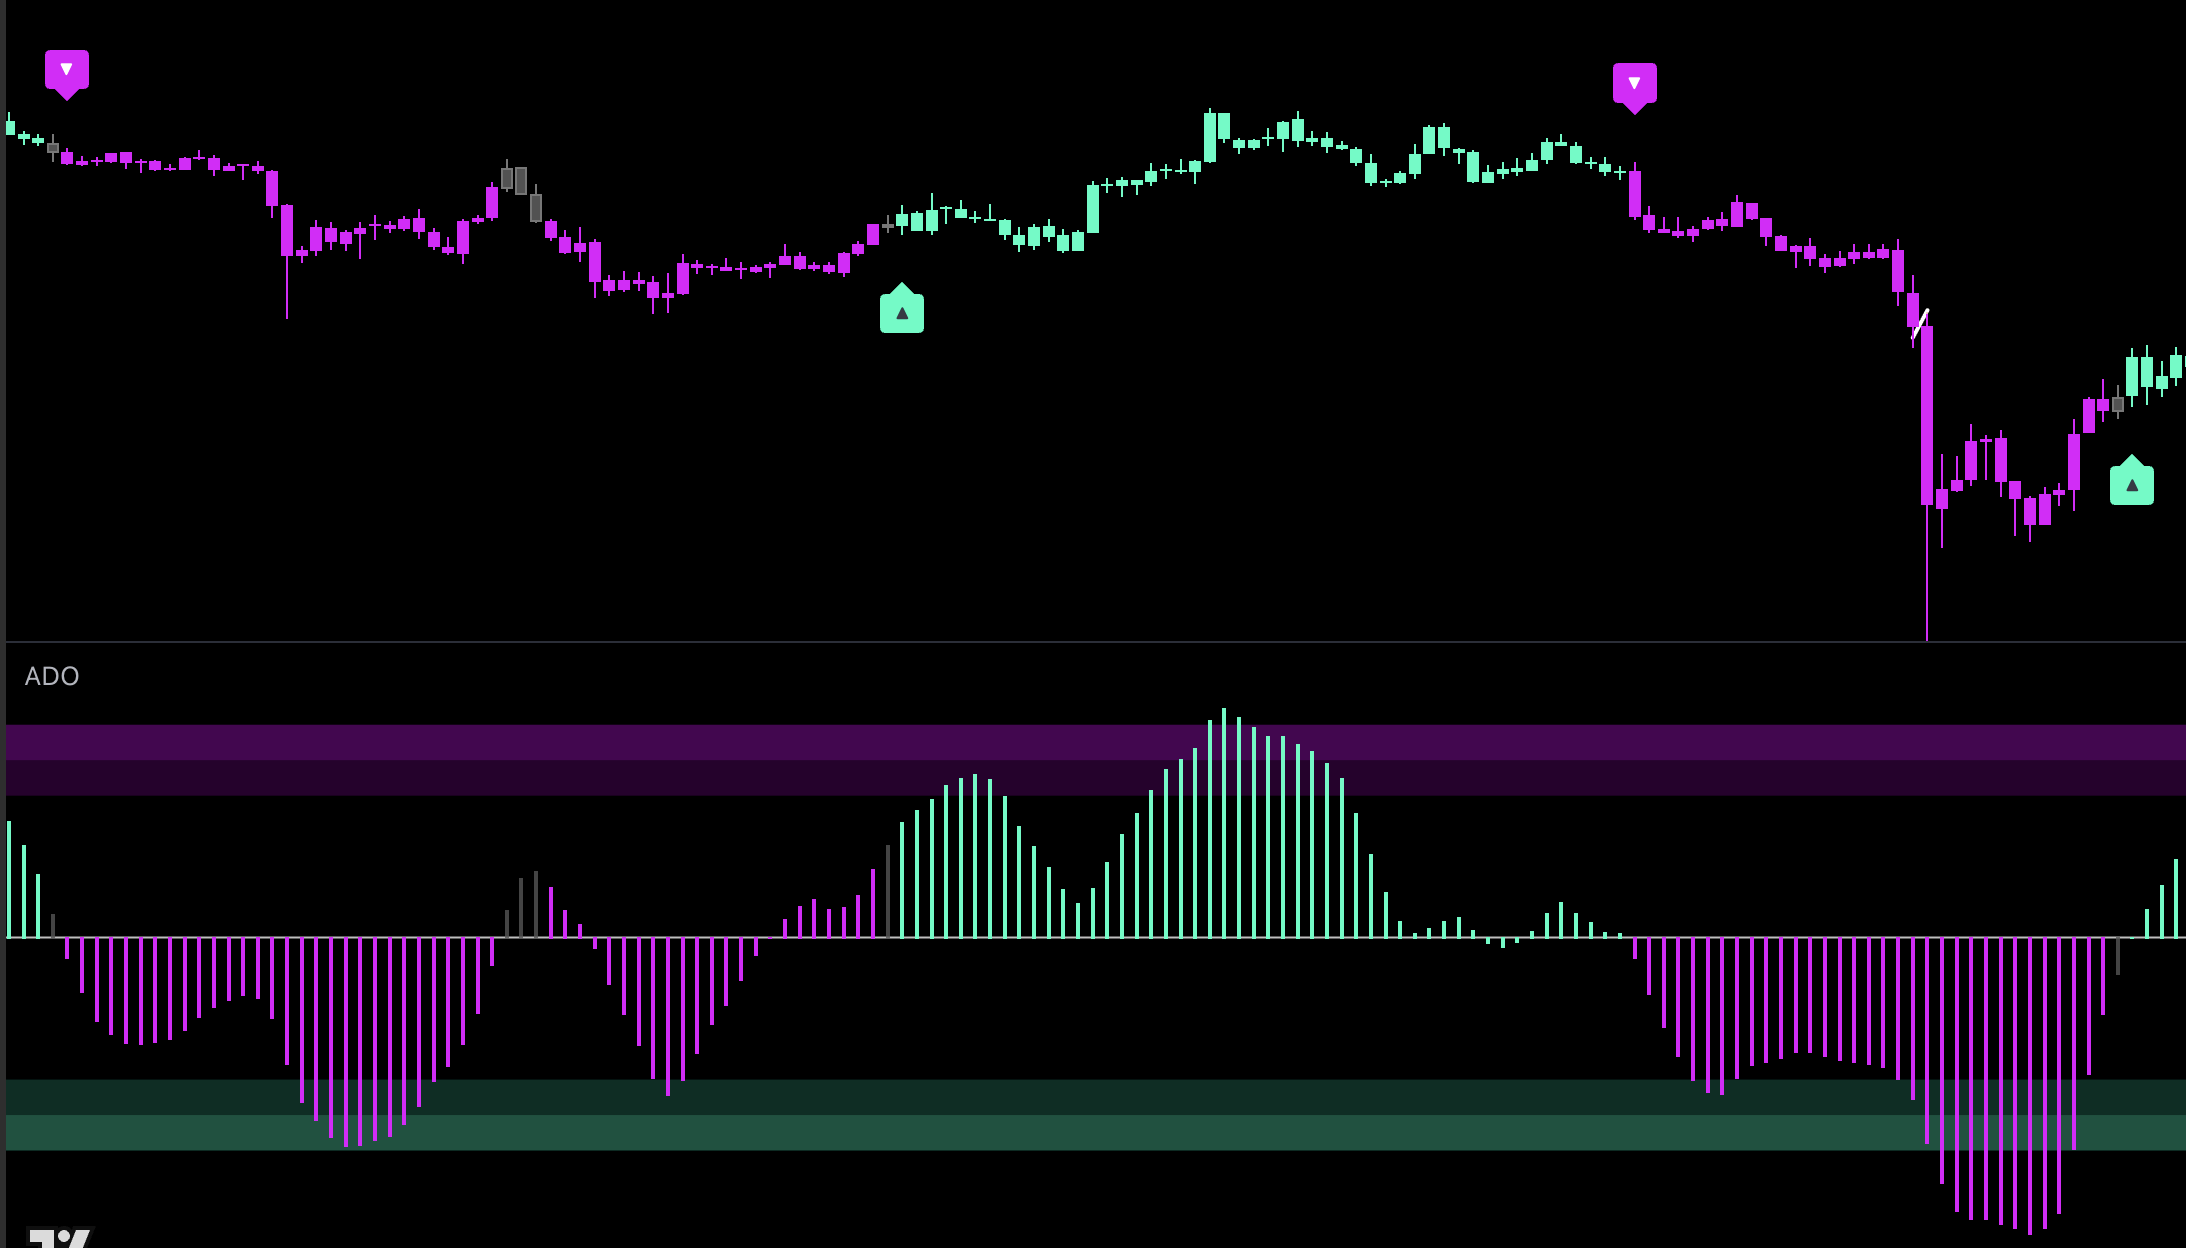
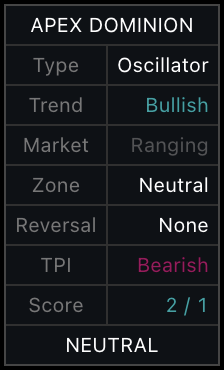
Apex Dominion Oscillator
Build the oscillator your system needs: trend, reversal, market regime, strength, or TPI confirmation.
Introduction
Unlike an oscillator built for one fixed job, Apex Dominion is a customization oscillator. The same ADO reading can be presented for trend following, reversal timing, market-regime identification, strength, or TPI confirmation. Choose the purpose you need and adapt the display to your own system.
How to Use
Choose the job. Use Reversal for stretched zones and turns, Trend or TPI for directional confirmation, Regime / Trend for market state, or Heat for move strength.
Choose the display. Apply the selected view to the histogram, candles, or background, then show only the Zones, Reversal Marks, and Table that help your system.
Build it into your workflow. Use ADO as a reversal oscillator, trend-following confirmation, regime filter, or strength display—and keep one clear purpose for every enabled feature.
Features and Displays
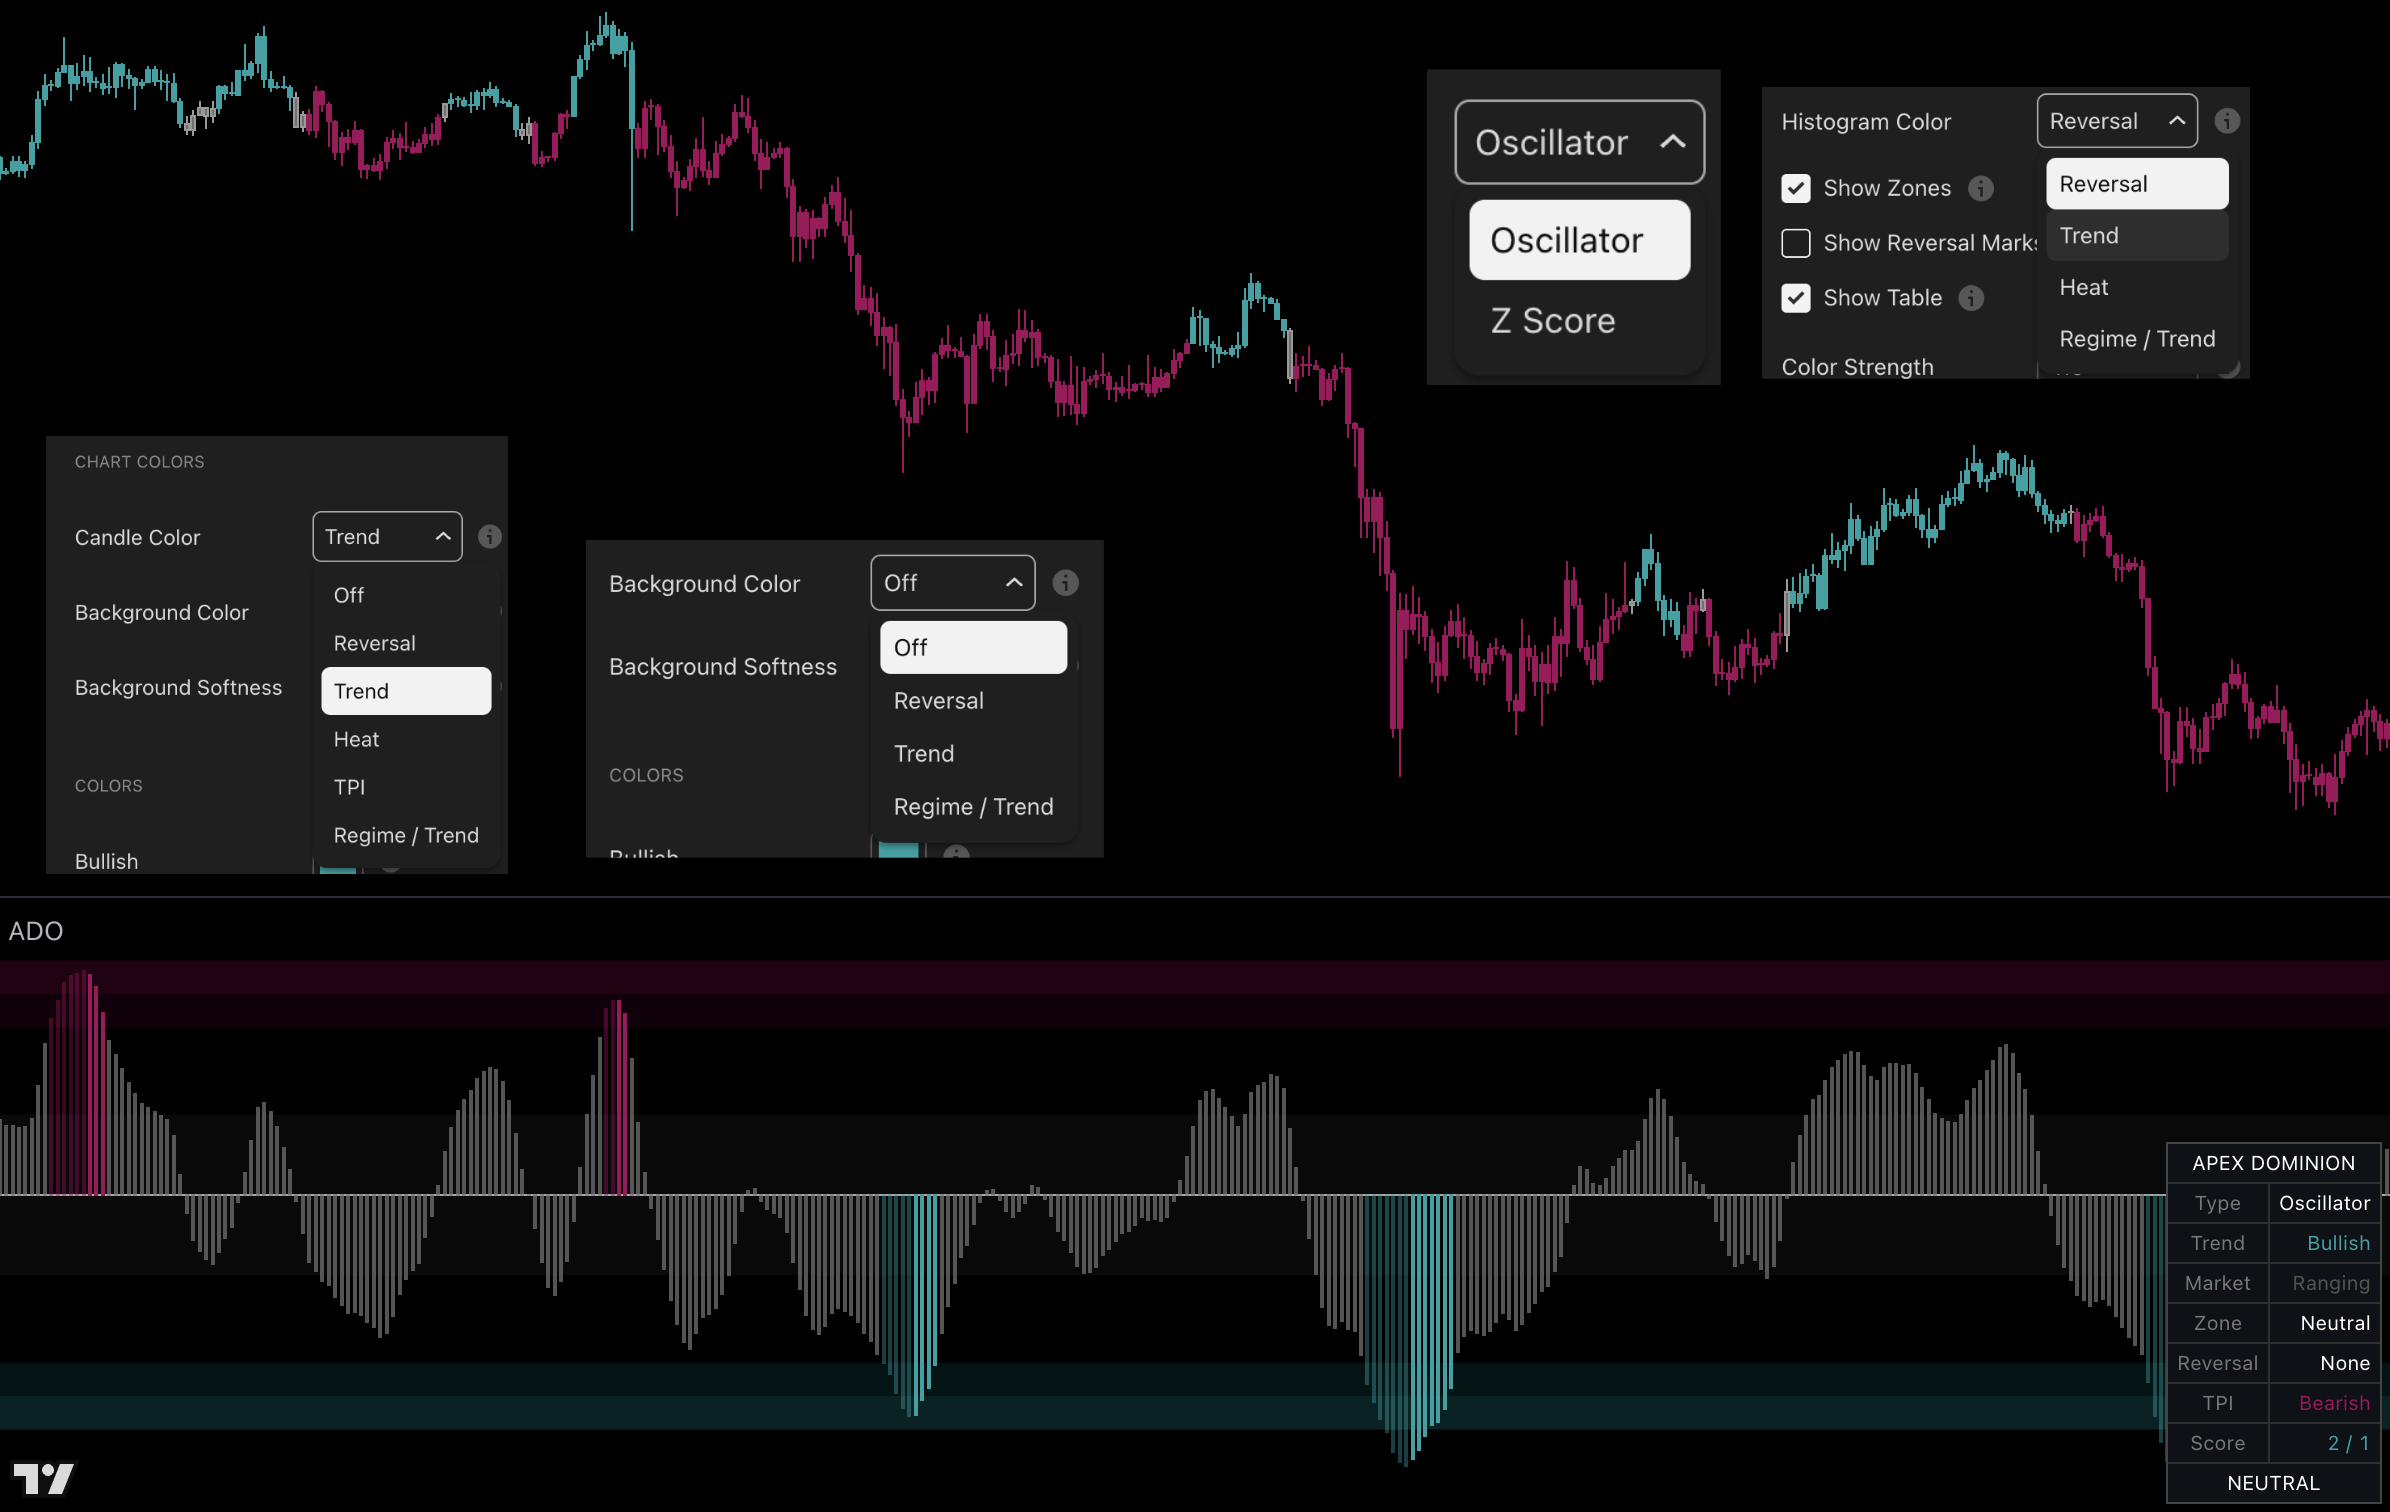
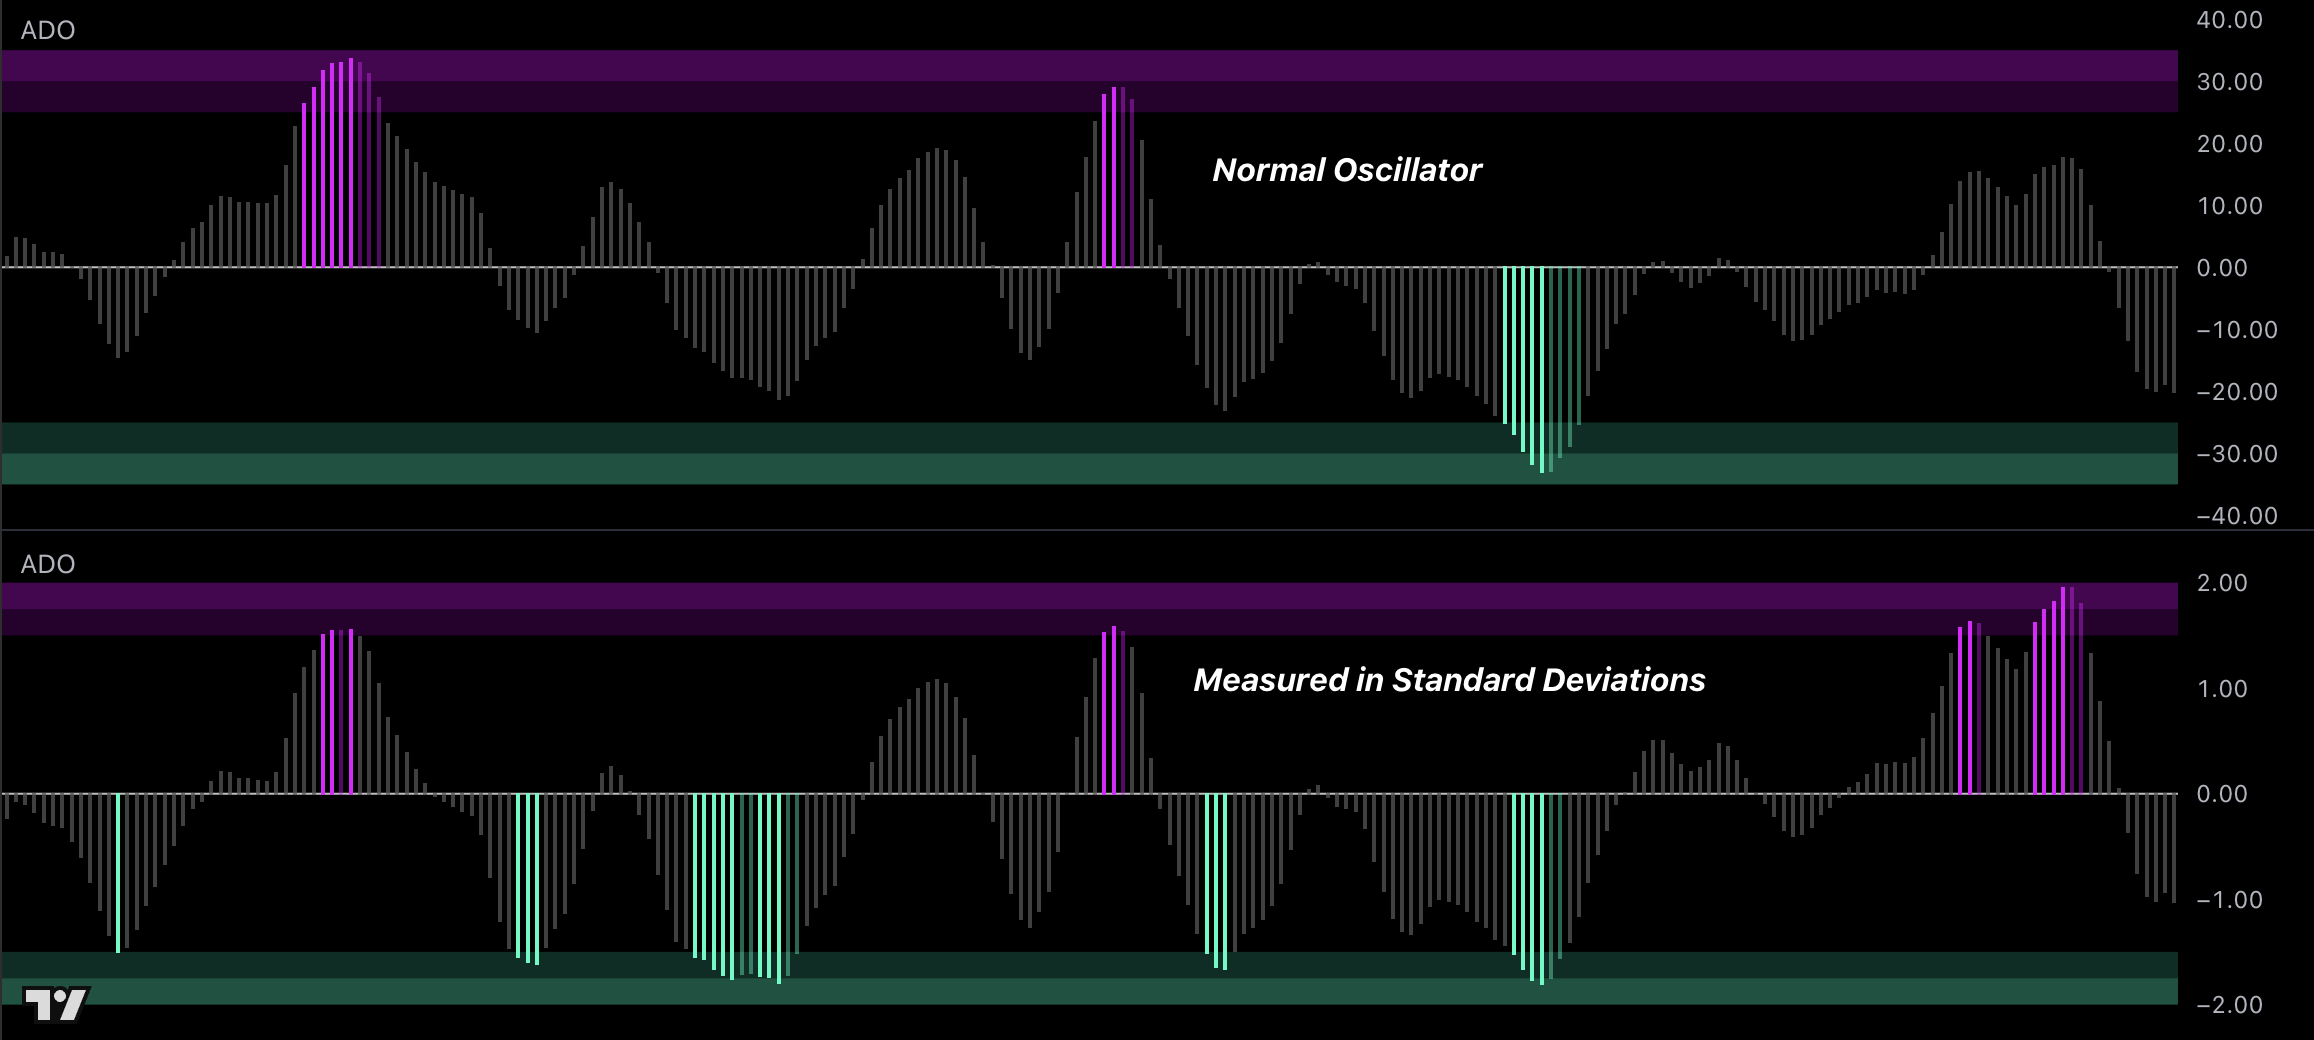
Oscillator Type
Use Oscillator for the standard workflow and Z Score only after separate testing.
Histogram Direction
Above zero supports Longs, below zero supports Shorts, and a flat read means wait.
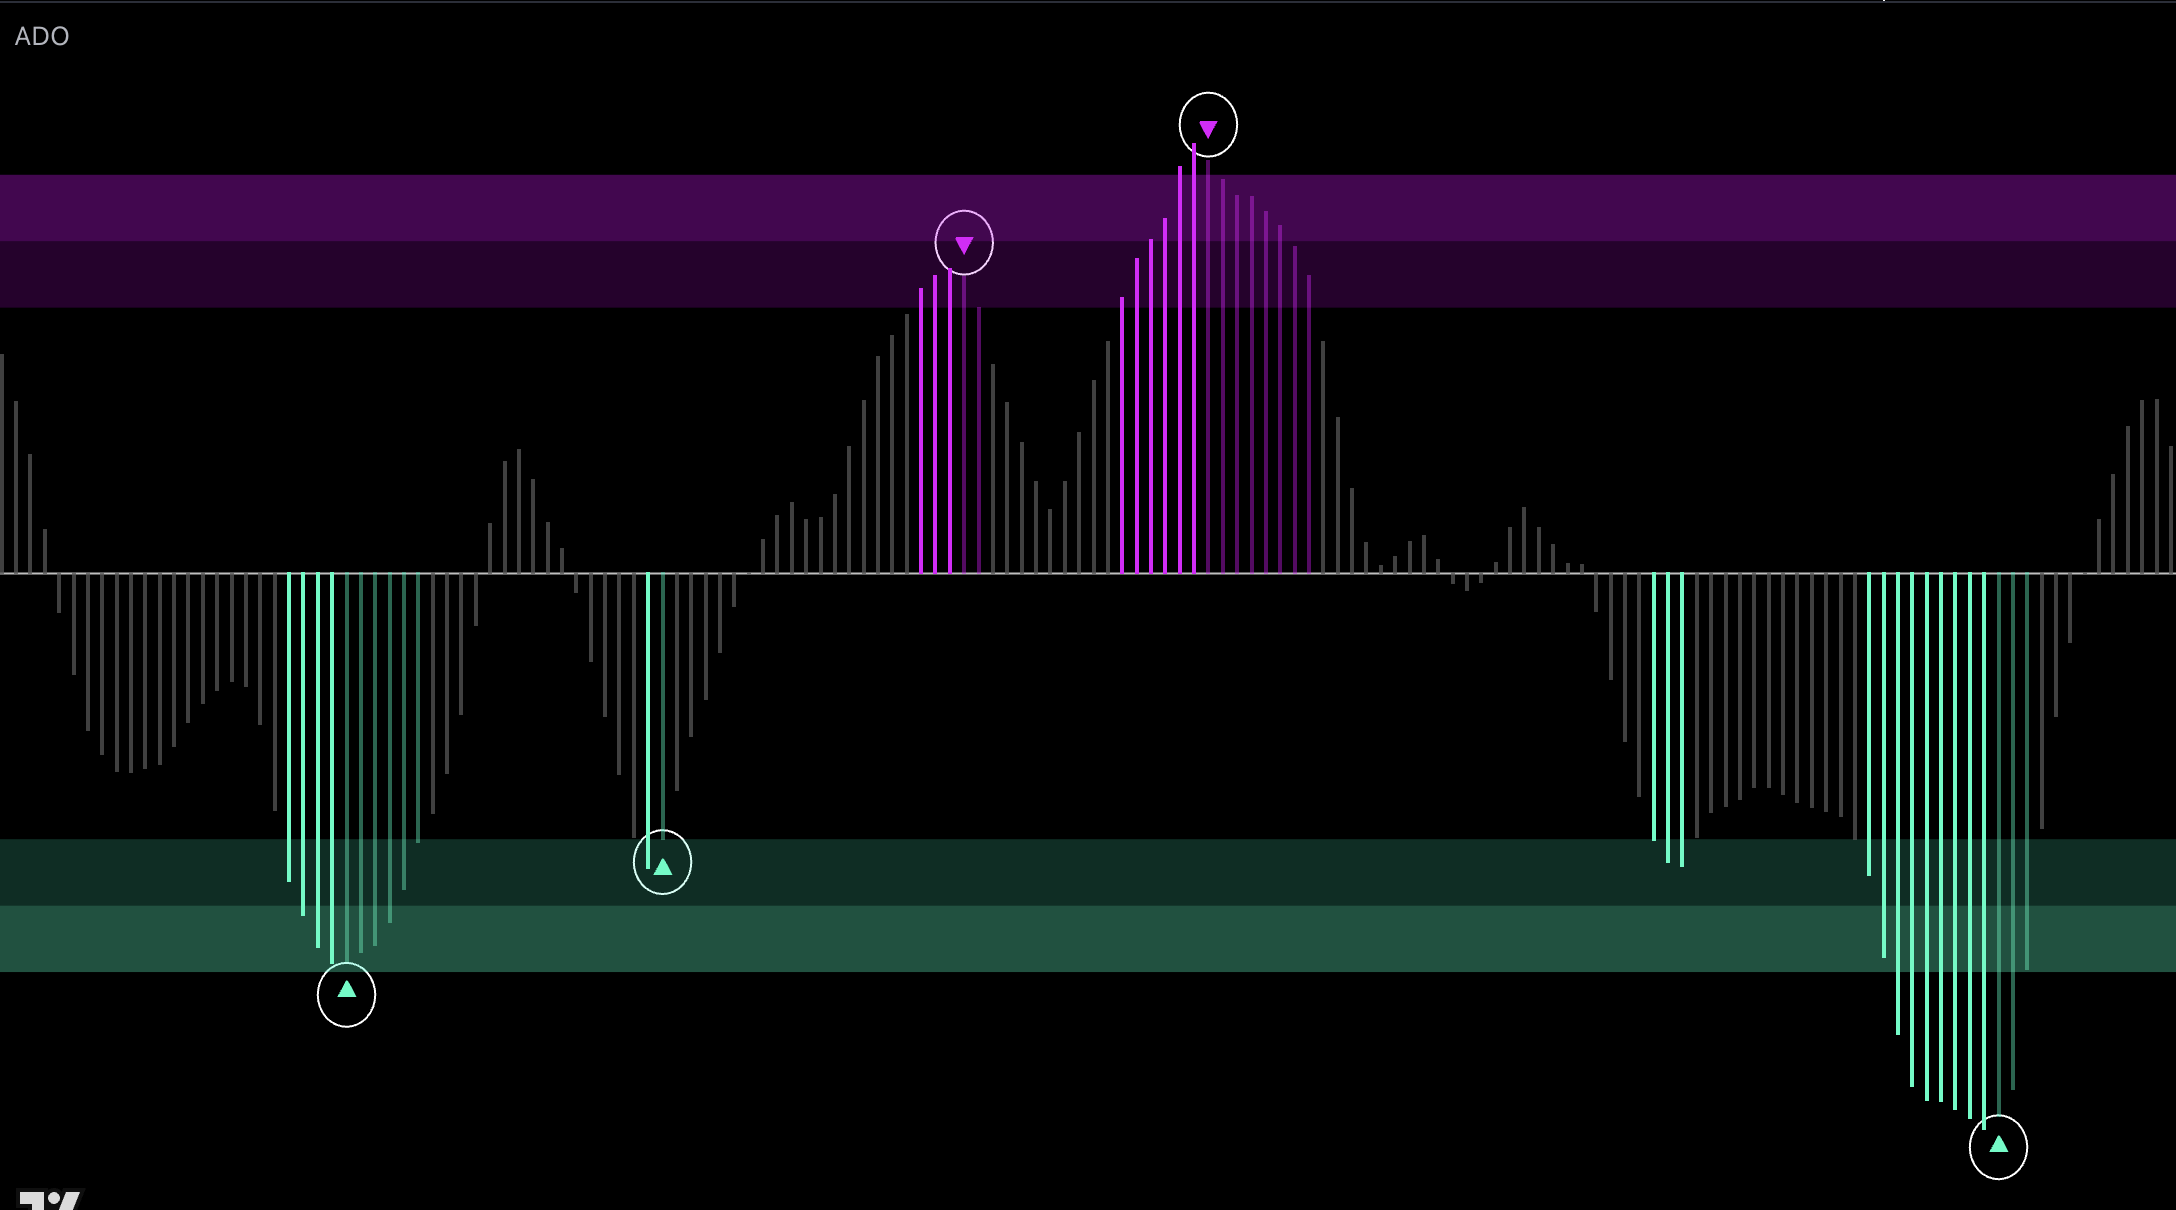
Zones
Turn on Show Zones to display the fixed upper, lower, and ranging areas. Use High and Extreme High to avoid chasing Longs or protect an existing Long; use Low and Extreme Low to avoid chasing Shorts or protect an existing Short.
Reversal Marks
Use a Bull Turn or Bear Turn only with a primary reversal setup and useful zone location.
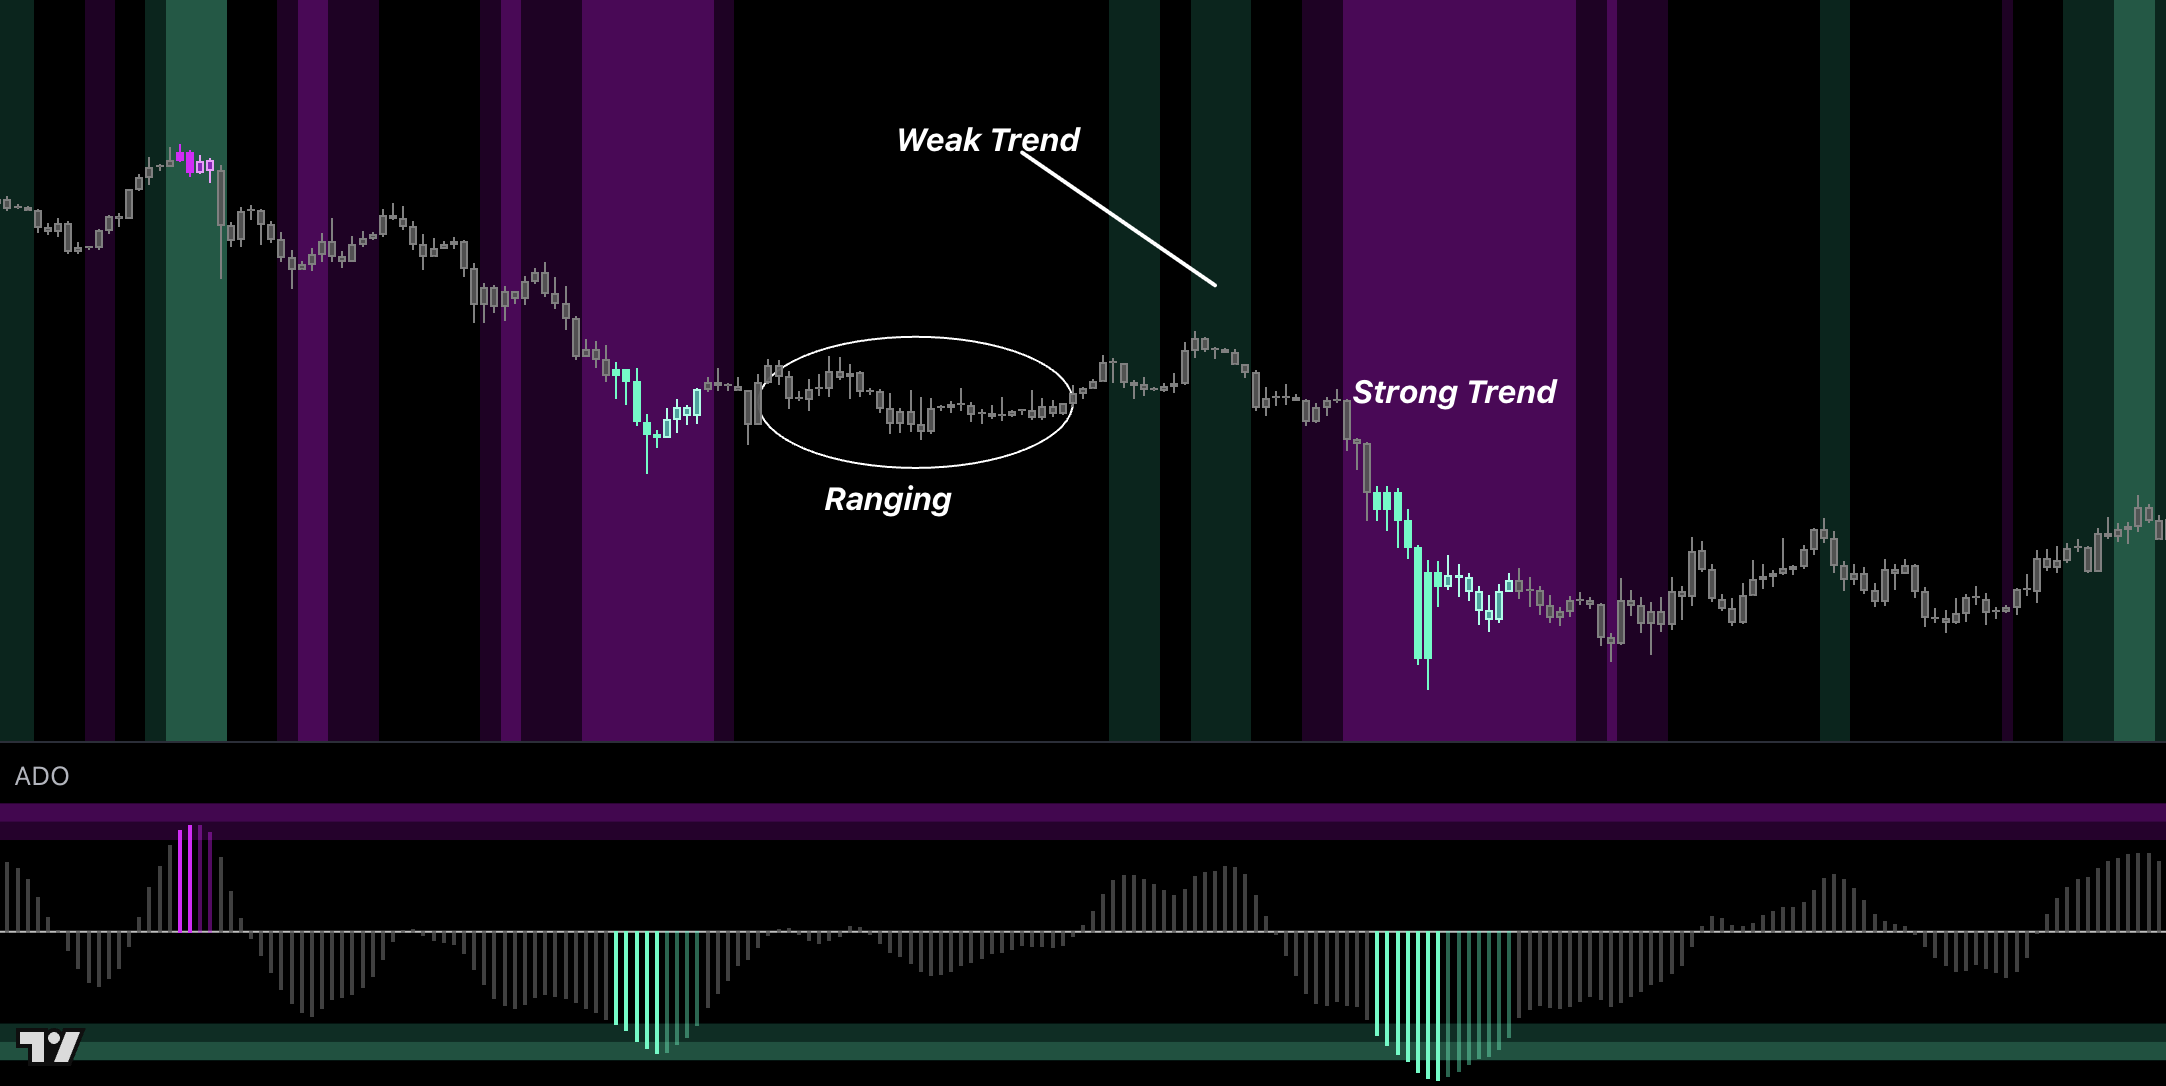
Market Regime
Trending supports continuation, Ranging supports reversals, and Strong Trend should not be faded blindly.
Histogram Color
Choose Reversal to emphasize stretched zones, Trend to separate readings above and below zero, Heat to emphasize stronger moves, or Regime / Trend to distinguish ranging and trending conditions. Color Strength changes only the intensity of Heat mode.
Candle Color
Choose Off, Reversal, Trend, Heat, TPI, or Regime / Trend for the main-chart candles. TPI coloring is available only through Candle Color. Leave it Off when another indicator already colors price.
Background Color
Choose Off, Reversal, Trend, or Regime / Trend for the oscillator background. Increase Background Softness when the shading is too prominent.
TPI Confirmation
Use TPI agreement to confirm the primary setup and disagreement to reduce conviction.
Summary Table
Read the final BUY, SELL, or NEUTRAL verdict first. Then use Type, Trend, Market, Zone, Reversal, TPI, and the Bull / Bear Score to understand the current read. Do not turn every row into a separate required signal.
Inputs and Alerts
Keep Oscillator Type on Oscillator, Histogram Color on Reversal, Show Zones on, Show Table on, Candle Color off, and Background Color off as the standard setup.
Use Z Score only in a separately tested workflow.
Enable reversal marks only if chart arrows improve decisions.
Adjust Bullish, Bearish, and Neutral colors only for visibility. Table Position and Size change presentation, not the reading.
Use alerts for the event your primary setup needs: Bull or Bear Reversal, entry into a High or Low Zone, Trending, Ranging, Strong Trend, or Strong Trend Ended.
Recommended
Best For
Traders who want one oscillator that can be adapted to trend, reversal, regime, strength, or confirmation systems.
Recommended Setup
Start with Oscillator mode, then select the Histogram Color that matches the system you are building. Add chart colors, Zones, Reversal Marks, and the Table only when they have a defined job.
Why
ADO lets the same core oscillator serve different workflows without forcing every trader into one fixed use case.
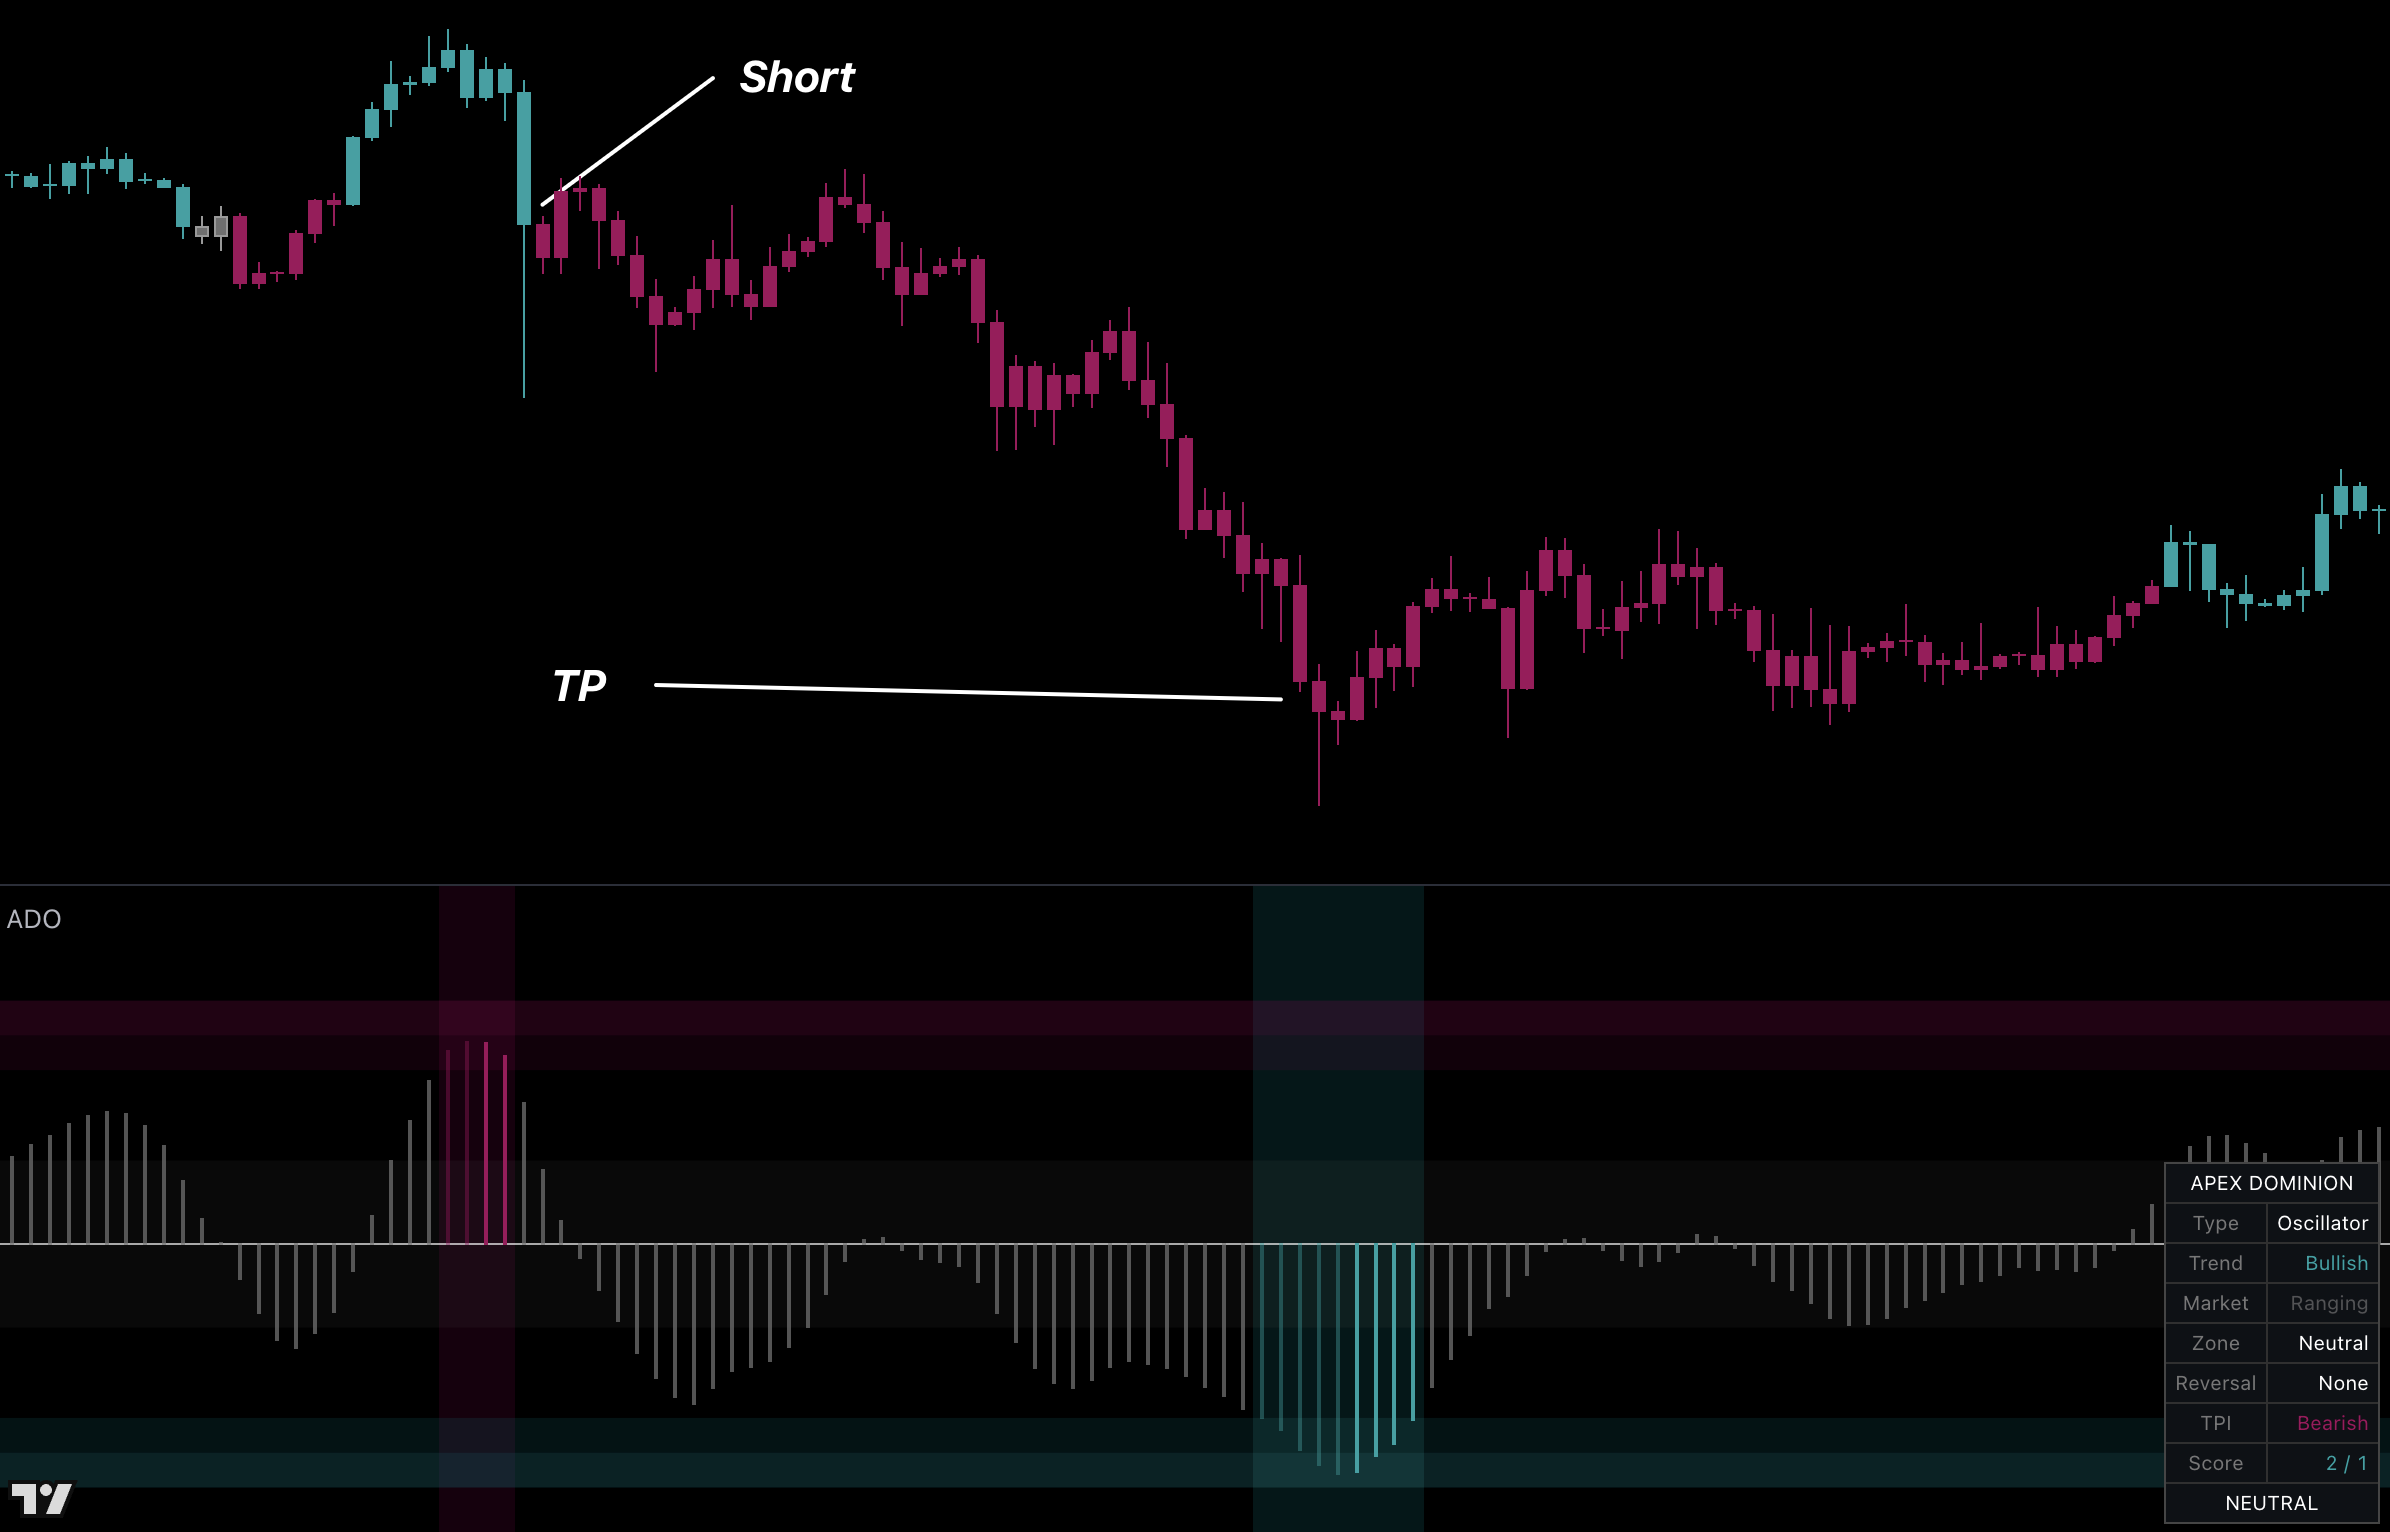
Rotation
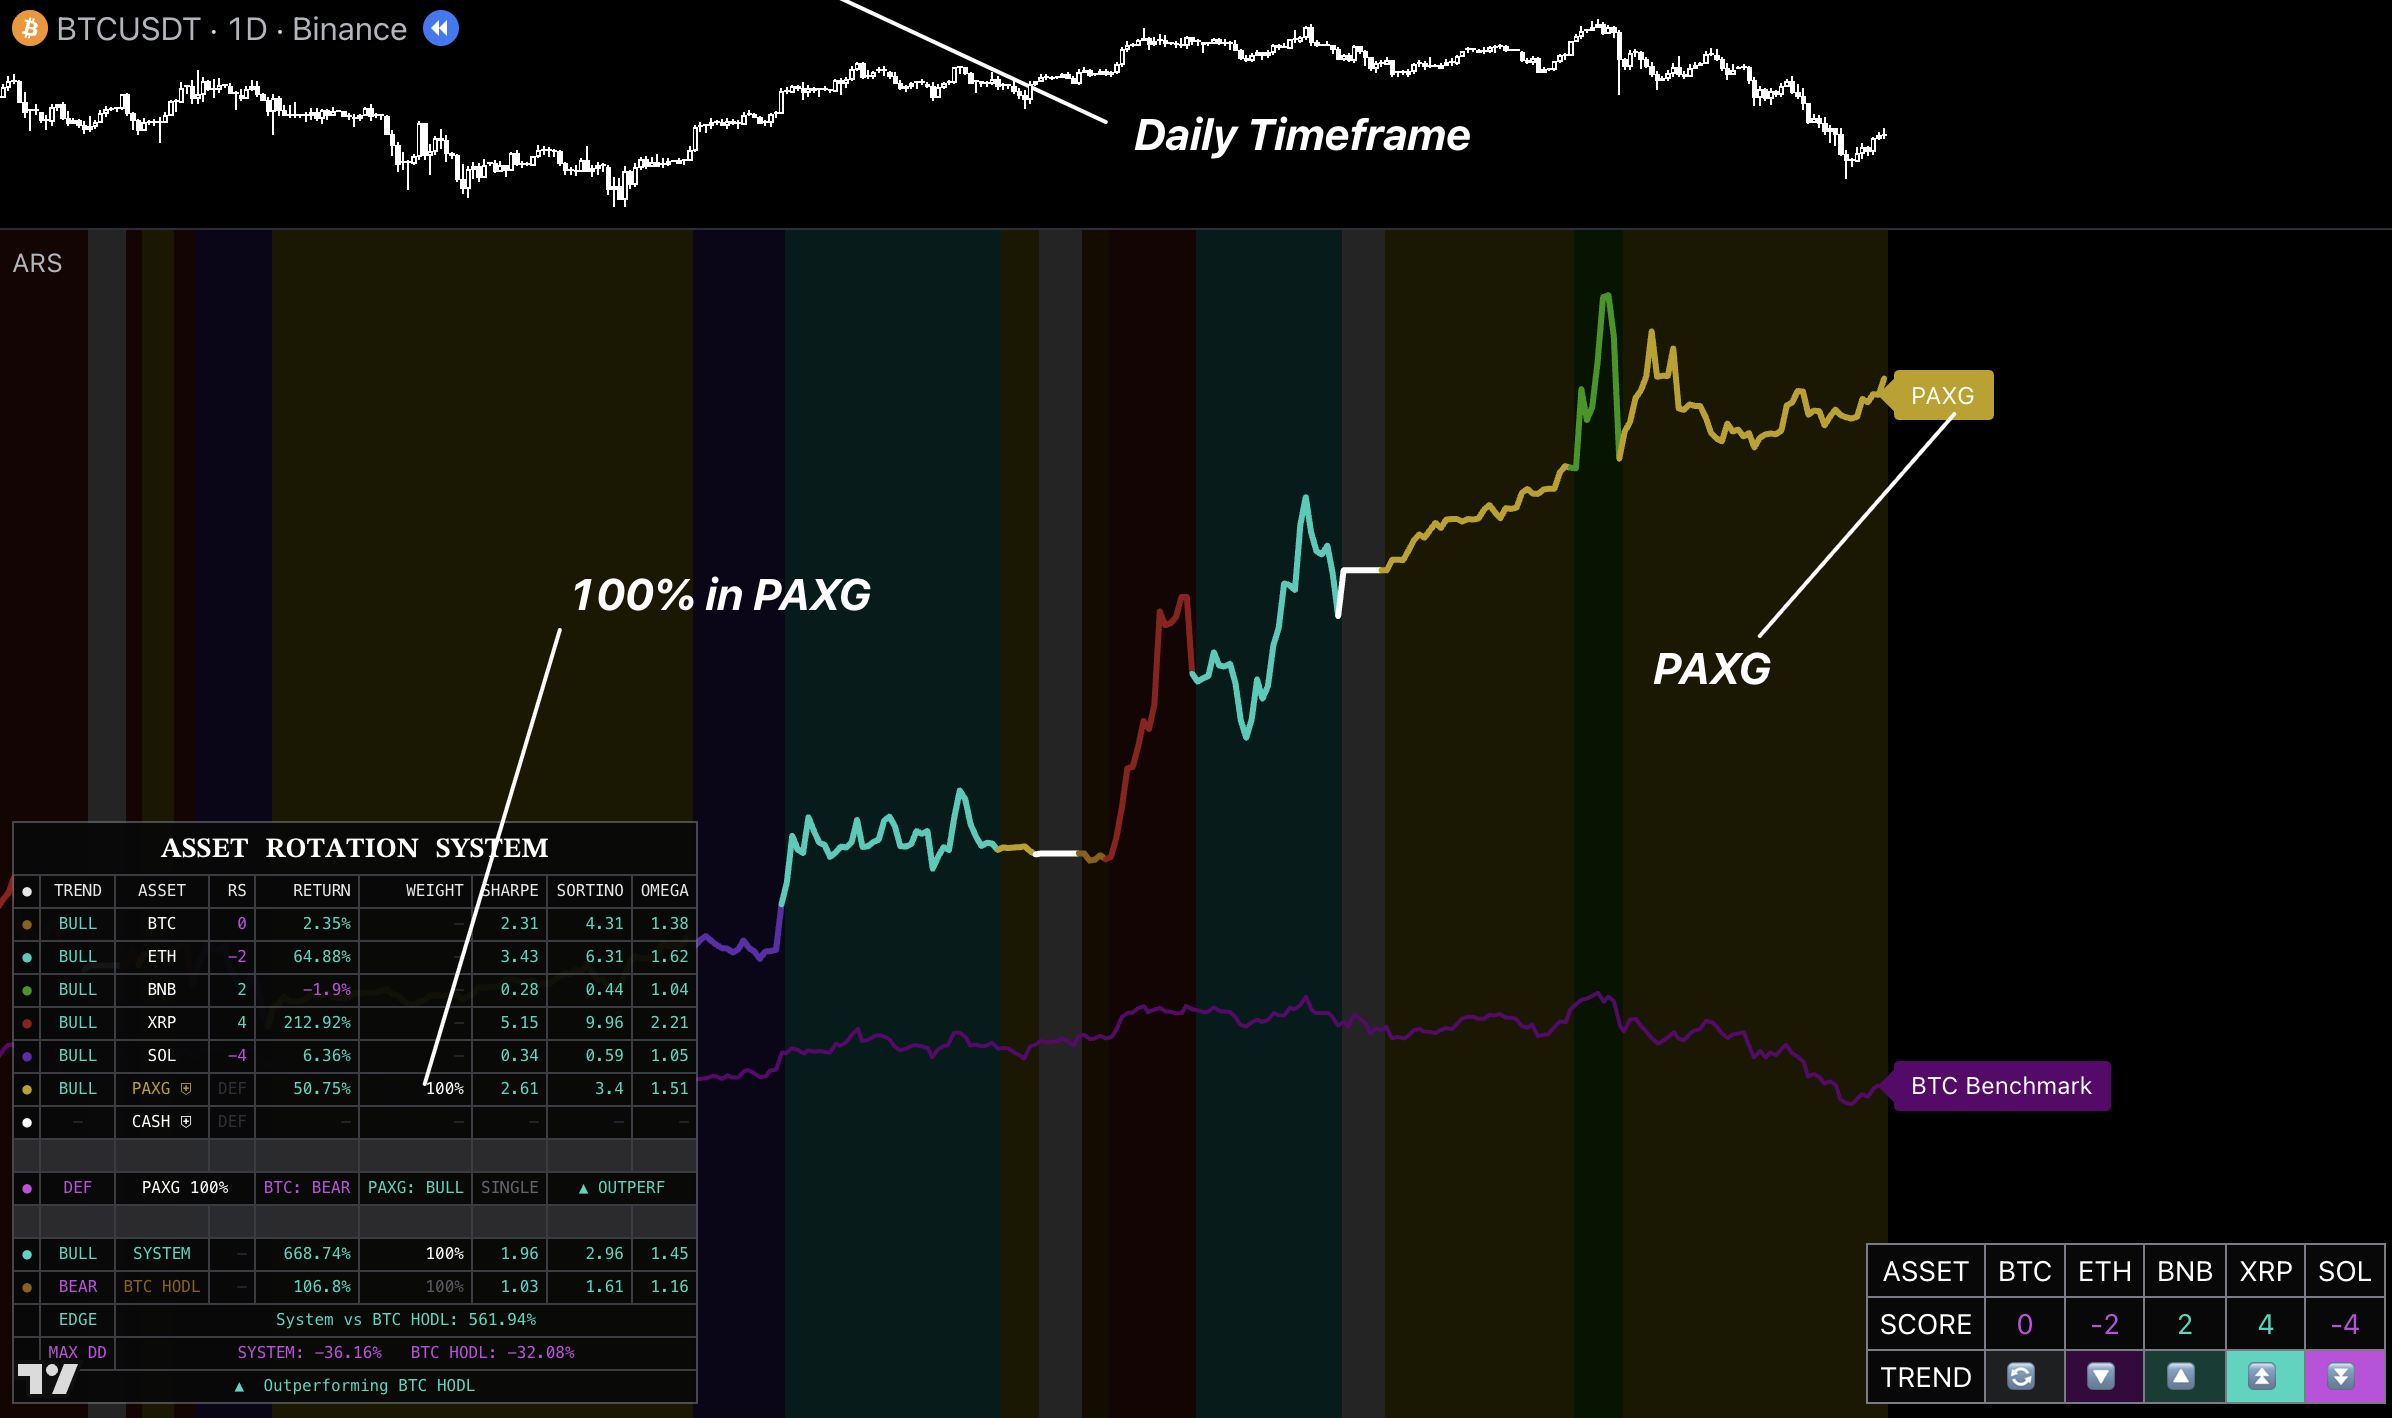
Asset Rotation System
A simplified system that holds one enabled major, PAXG, or CASH at 100% weight.
◆Recommended: use RSRS. RSRS is Uptrick's recommended rotation system and is 10× better than the legacy Asset Rotation System. Every Uptrick rotation system must be used on the 1D chart timeframe.
Introduction
ARS answers one practical question: what does the simplified model hold now? It never splits between two assets. Use RSRS when custom assets, hedges, Shorts, or leverage controls are required.
Single Allocation and Asset Universe
Enable the majors you can hold and follow the one row showing 100% Weight.
How to Use
1
Set the chart to 1D. All rotation systems must remain on the 1D chart timeframe.
2
Enable only assets you can hold. BTC, ETH, BNB, XRP, and SOL are the available risk assets.
3
Choose the safety behavior. The default PAXG then CASH workflow is the balanced starting point.
4
Read the allocation row. LIVE means a risk asset; DEF means PAXG or CASH. Confirm the row with 100% Weight.
5
Mirror one holding. Rotate only when the confirmed allocation changes.
6
Evaluate, do not override. Use Edge, Max DD, and risk statistics to judge the system—not to manually choose another asset.
Safety Modes
Mode
Action
Off
Remain in the strongest enabled crypto asset.
Hold PAXG
Use PAXG whenever BTC is weak.
Hold CASH
Use CASH whenever BTC is weak.
PAXG then CASH
Use PAXG when its safety check supports it; otherwise use CASH.
PAXG Check
Keep the chart itself on 1D. Inside the system, use the default 1D PAXG check for smoother decisions or 12h for a faster defensive check.
Performance and Table Features
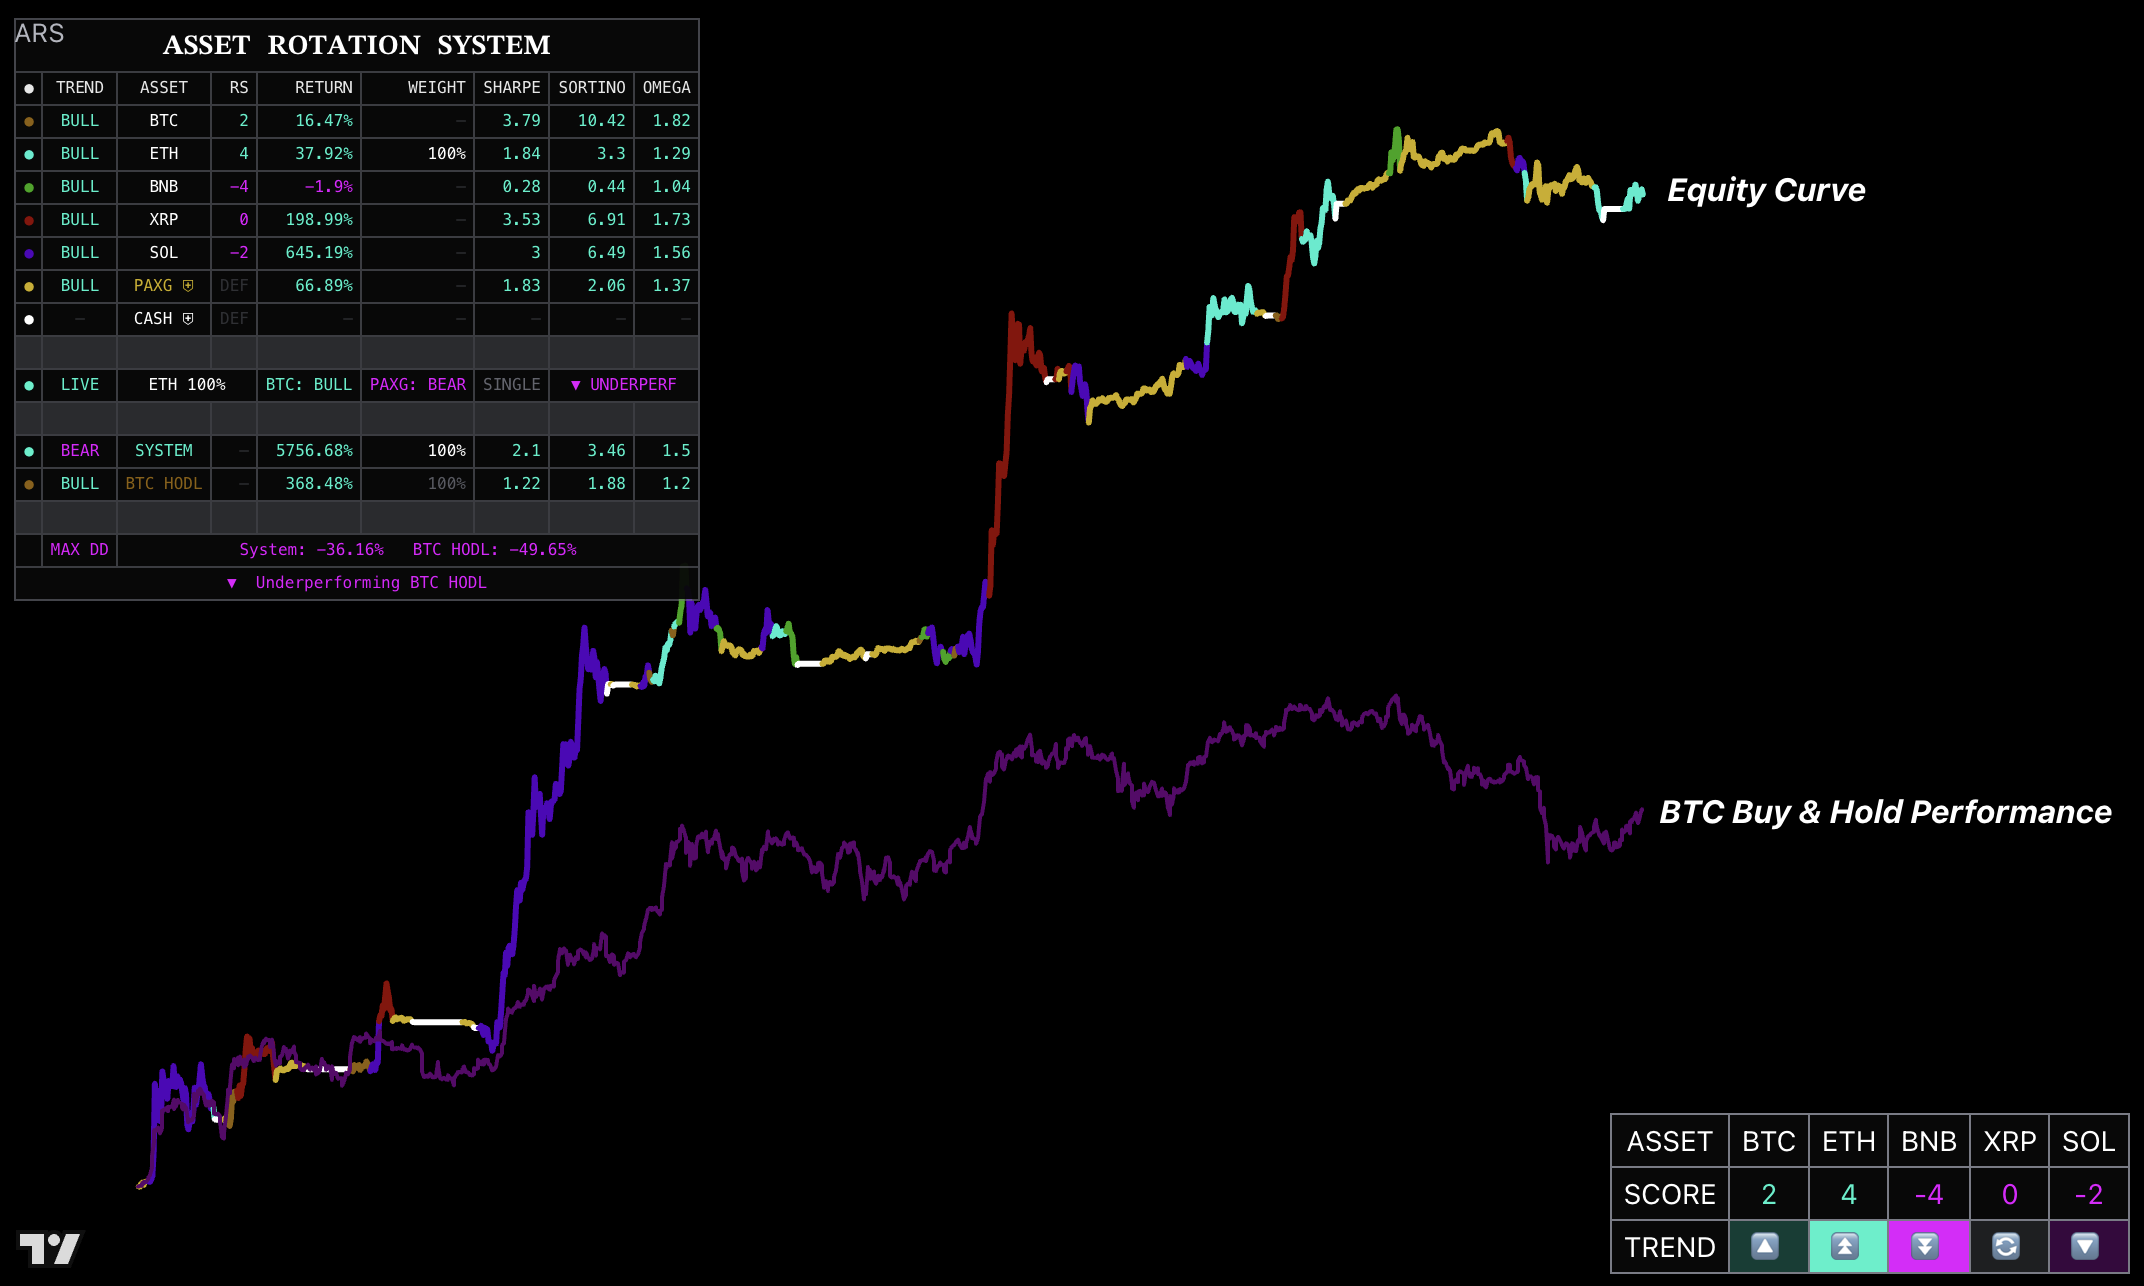
Equity Curve
Use the modeled system line against BTC HODL to evaluate whether rotation added value over the same window.
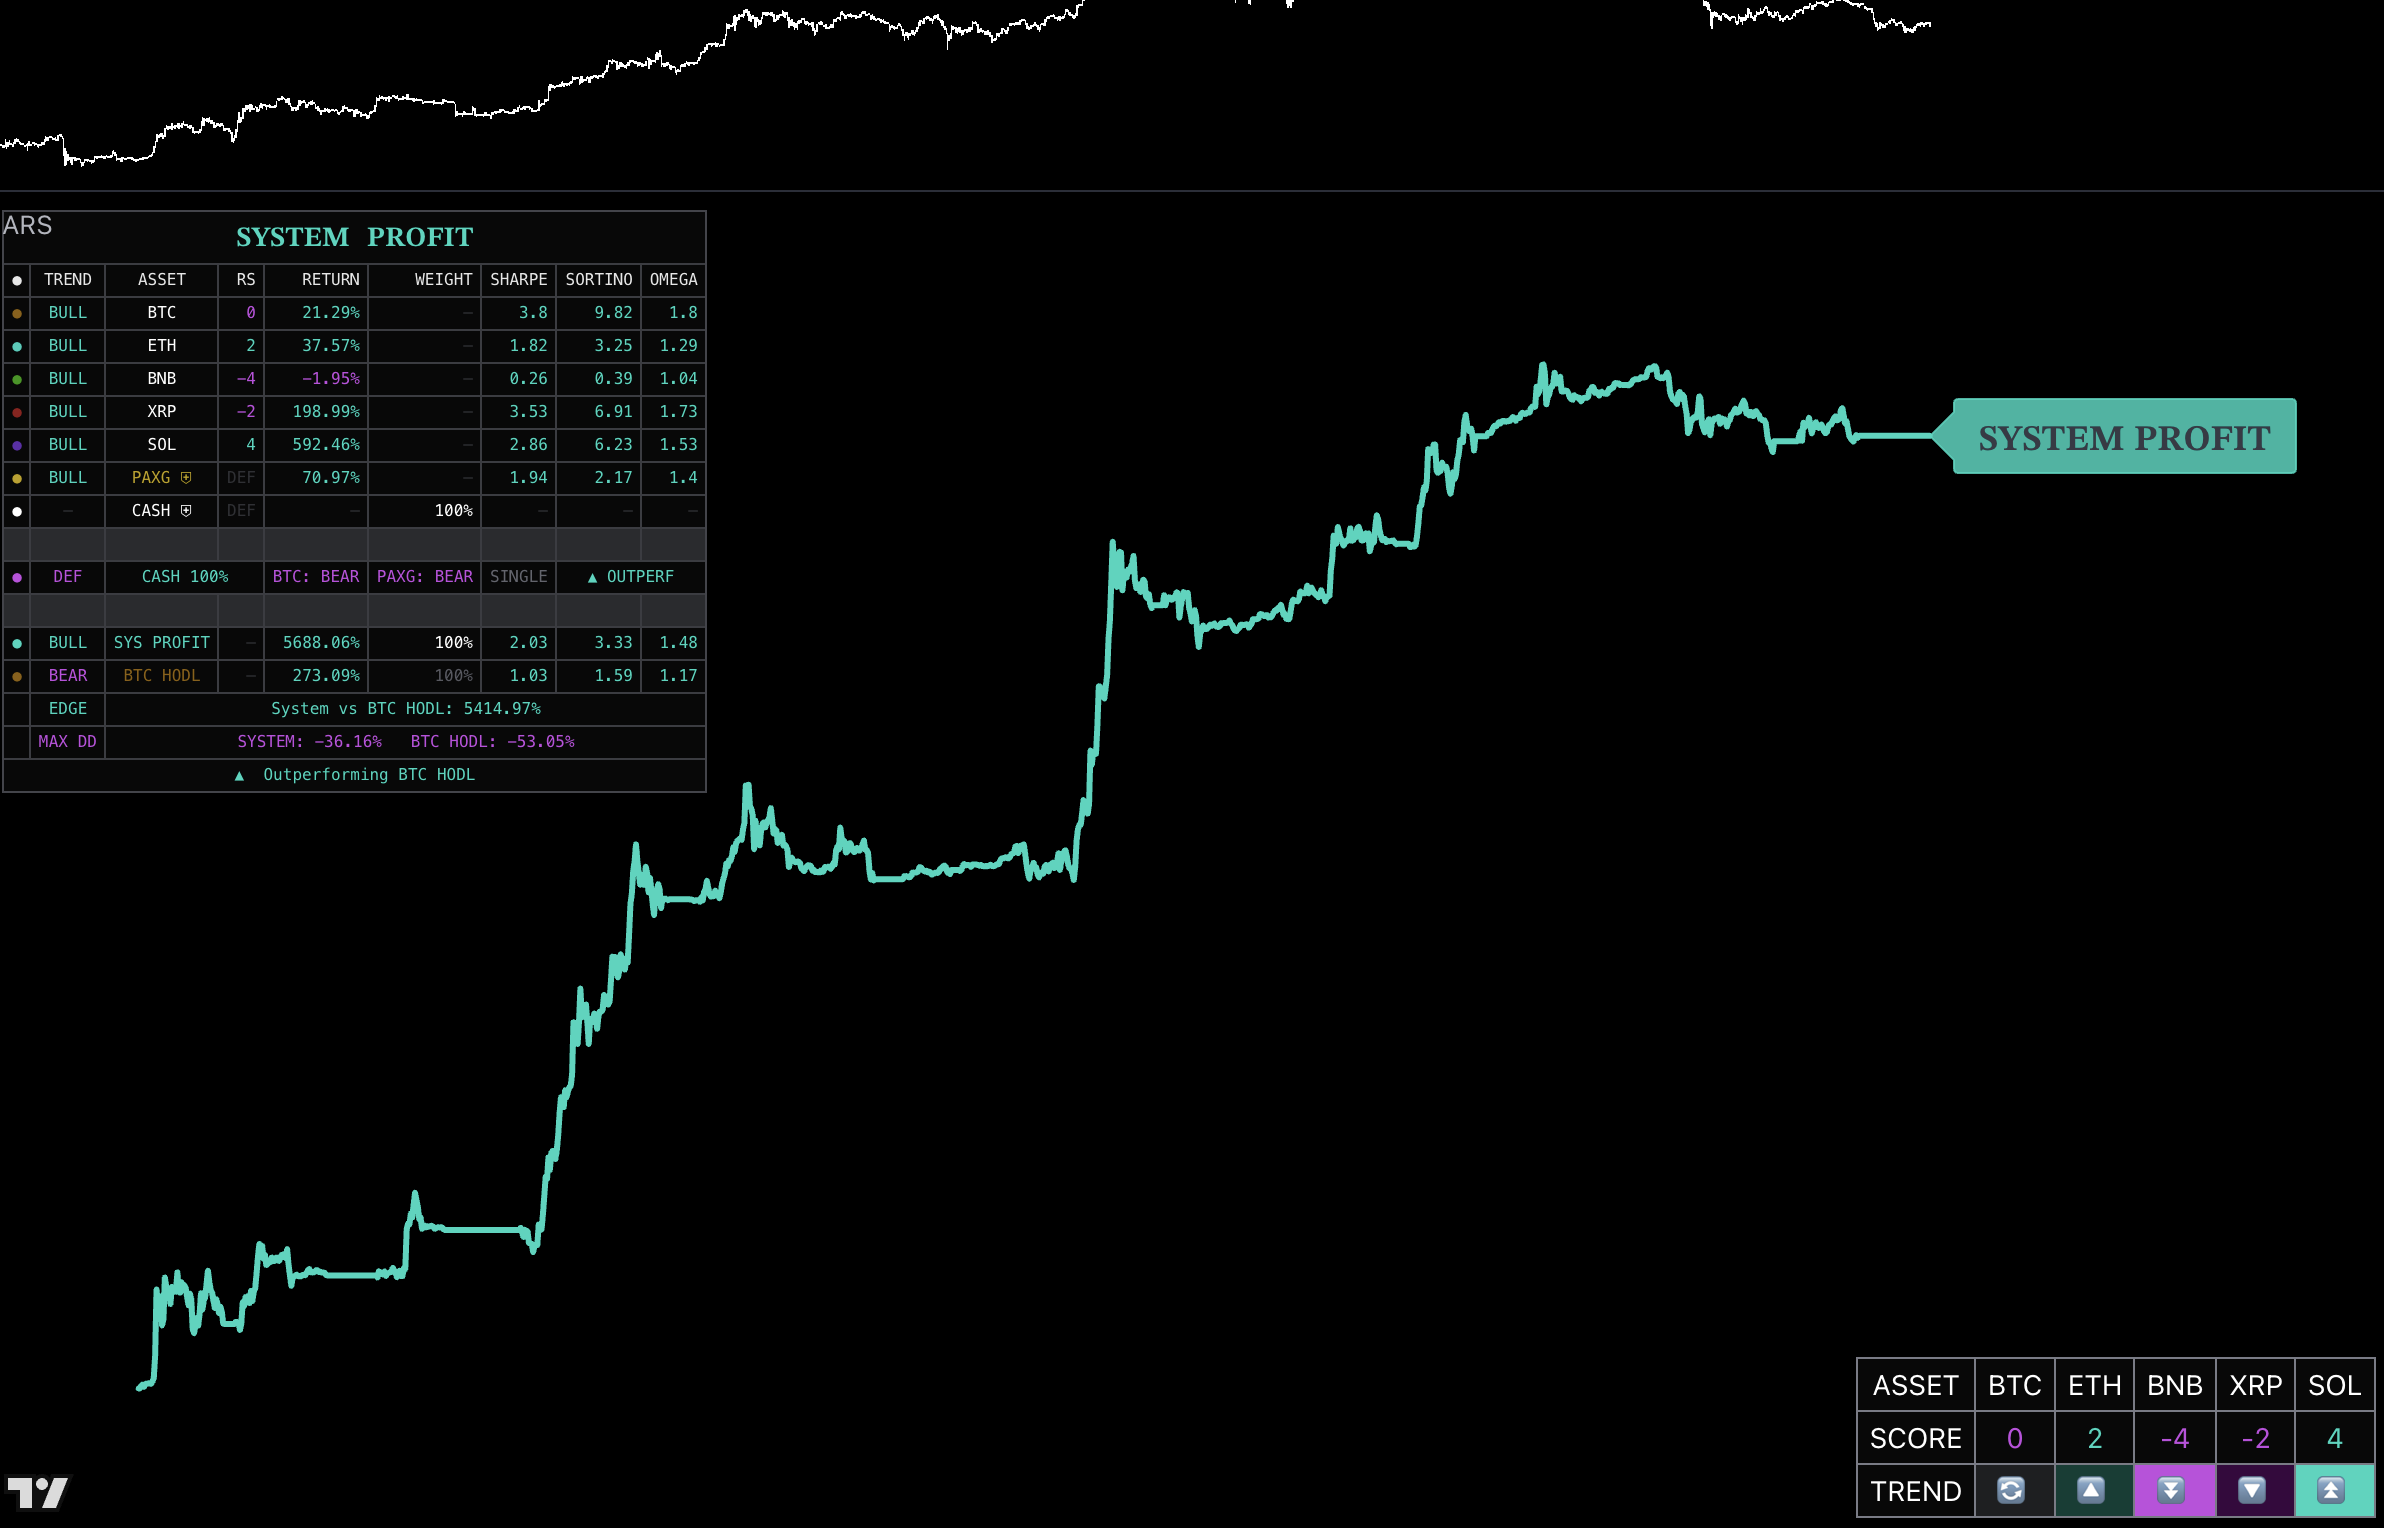
View Mode
Use Standard for comparison and System Profit for a clean system-only curve.
Background Mode
Use Asset to see allocation changes, Profitability to see performance state, or Off for a clean pane.
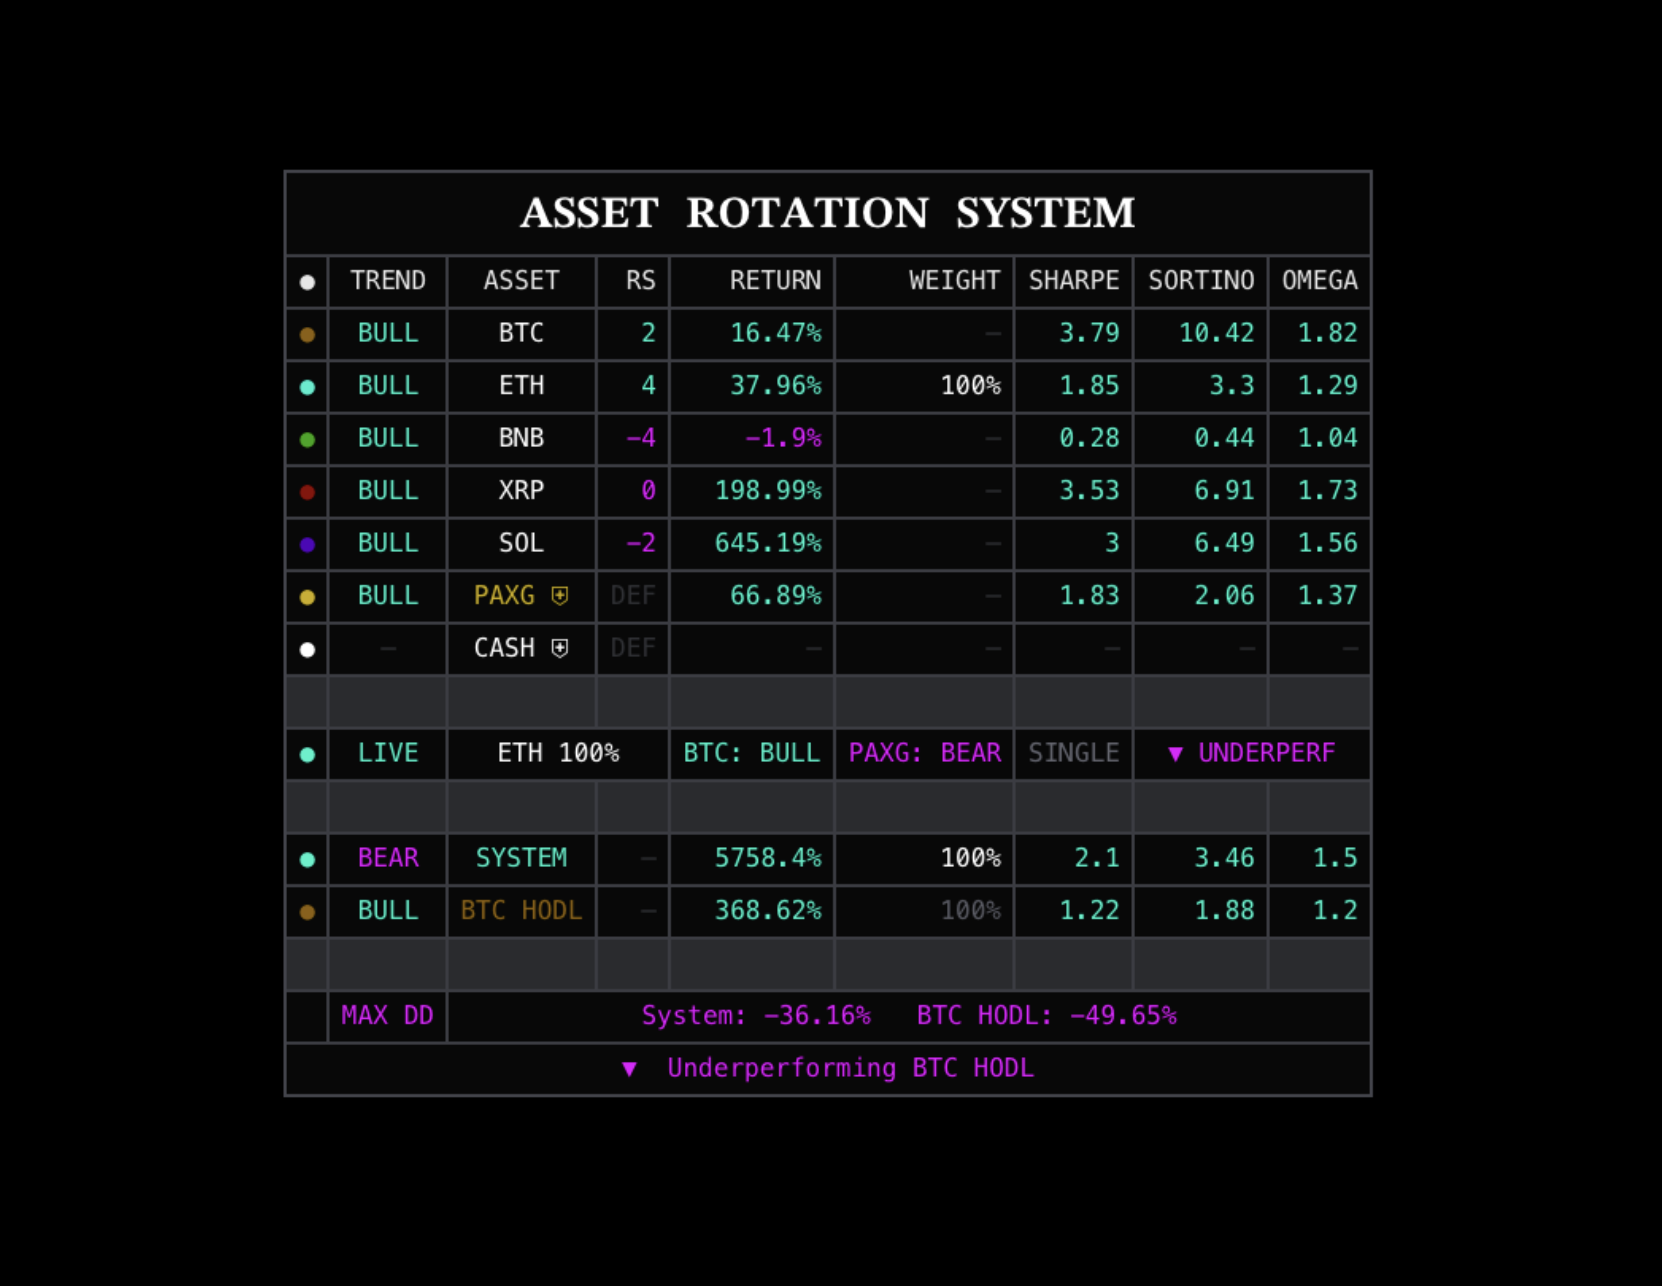
Score and Trend Table
Use it to scan enabled assets; do not manually override the selected 100% allocation.
Full Dashboard
Read LIVE/DEF, active Weight, Edge, risk statistics, and Max DD for the final decision and evaluation.
Input Adjustments
Goal
Adjustment
Recommended setup
All five assets on, PAXG then CASH, PAXG Check 1D, Standard view.
Unsupported asset
Turn it off and re-evaluate history because the universe changed.
Different evaluation window
Change Start Date; Initial Equity only rescales the curve.
Compare with BTC
Use Standard view.
Cleaner presentation
Use System Profit view or hide the background/table; visuals do not change allocation.
⚠The equity curve is modeled performance and does not include every fee, slippage, tax, or execution difference.
Recommended
Best For
Rotating large portfolios with a simple single-allocation workflow.
Recommended Setup
Use the full major-asset pool and PAXG-then-CASH safety, then mirror the one 100% holding.
Why
ARS keeps capital rotation simple for users who do not need custom assets, hedges, Shorts, or leverage.
Rotation
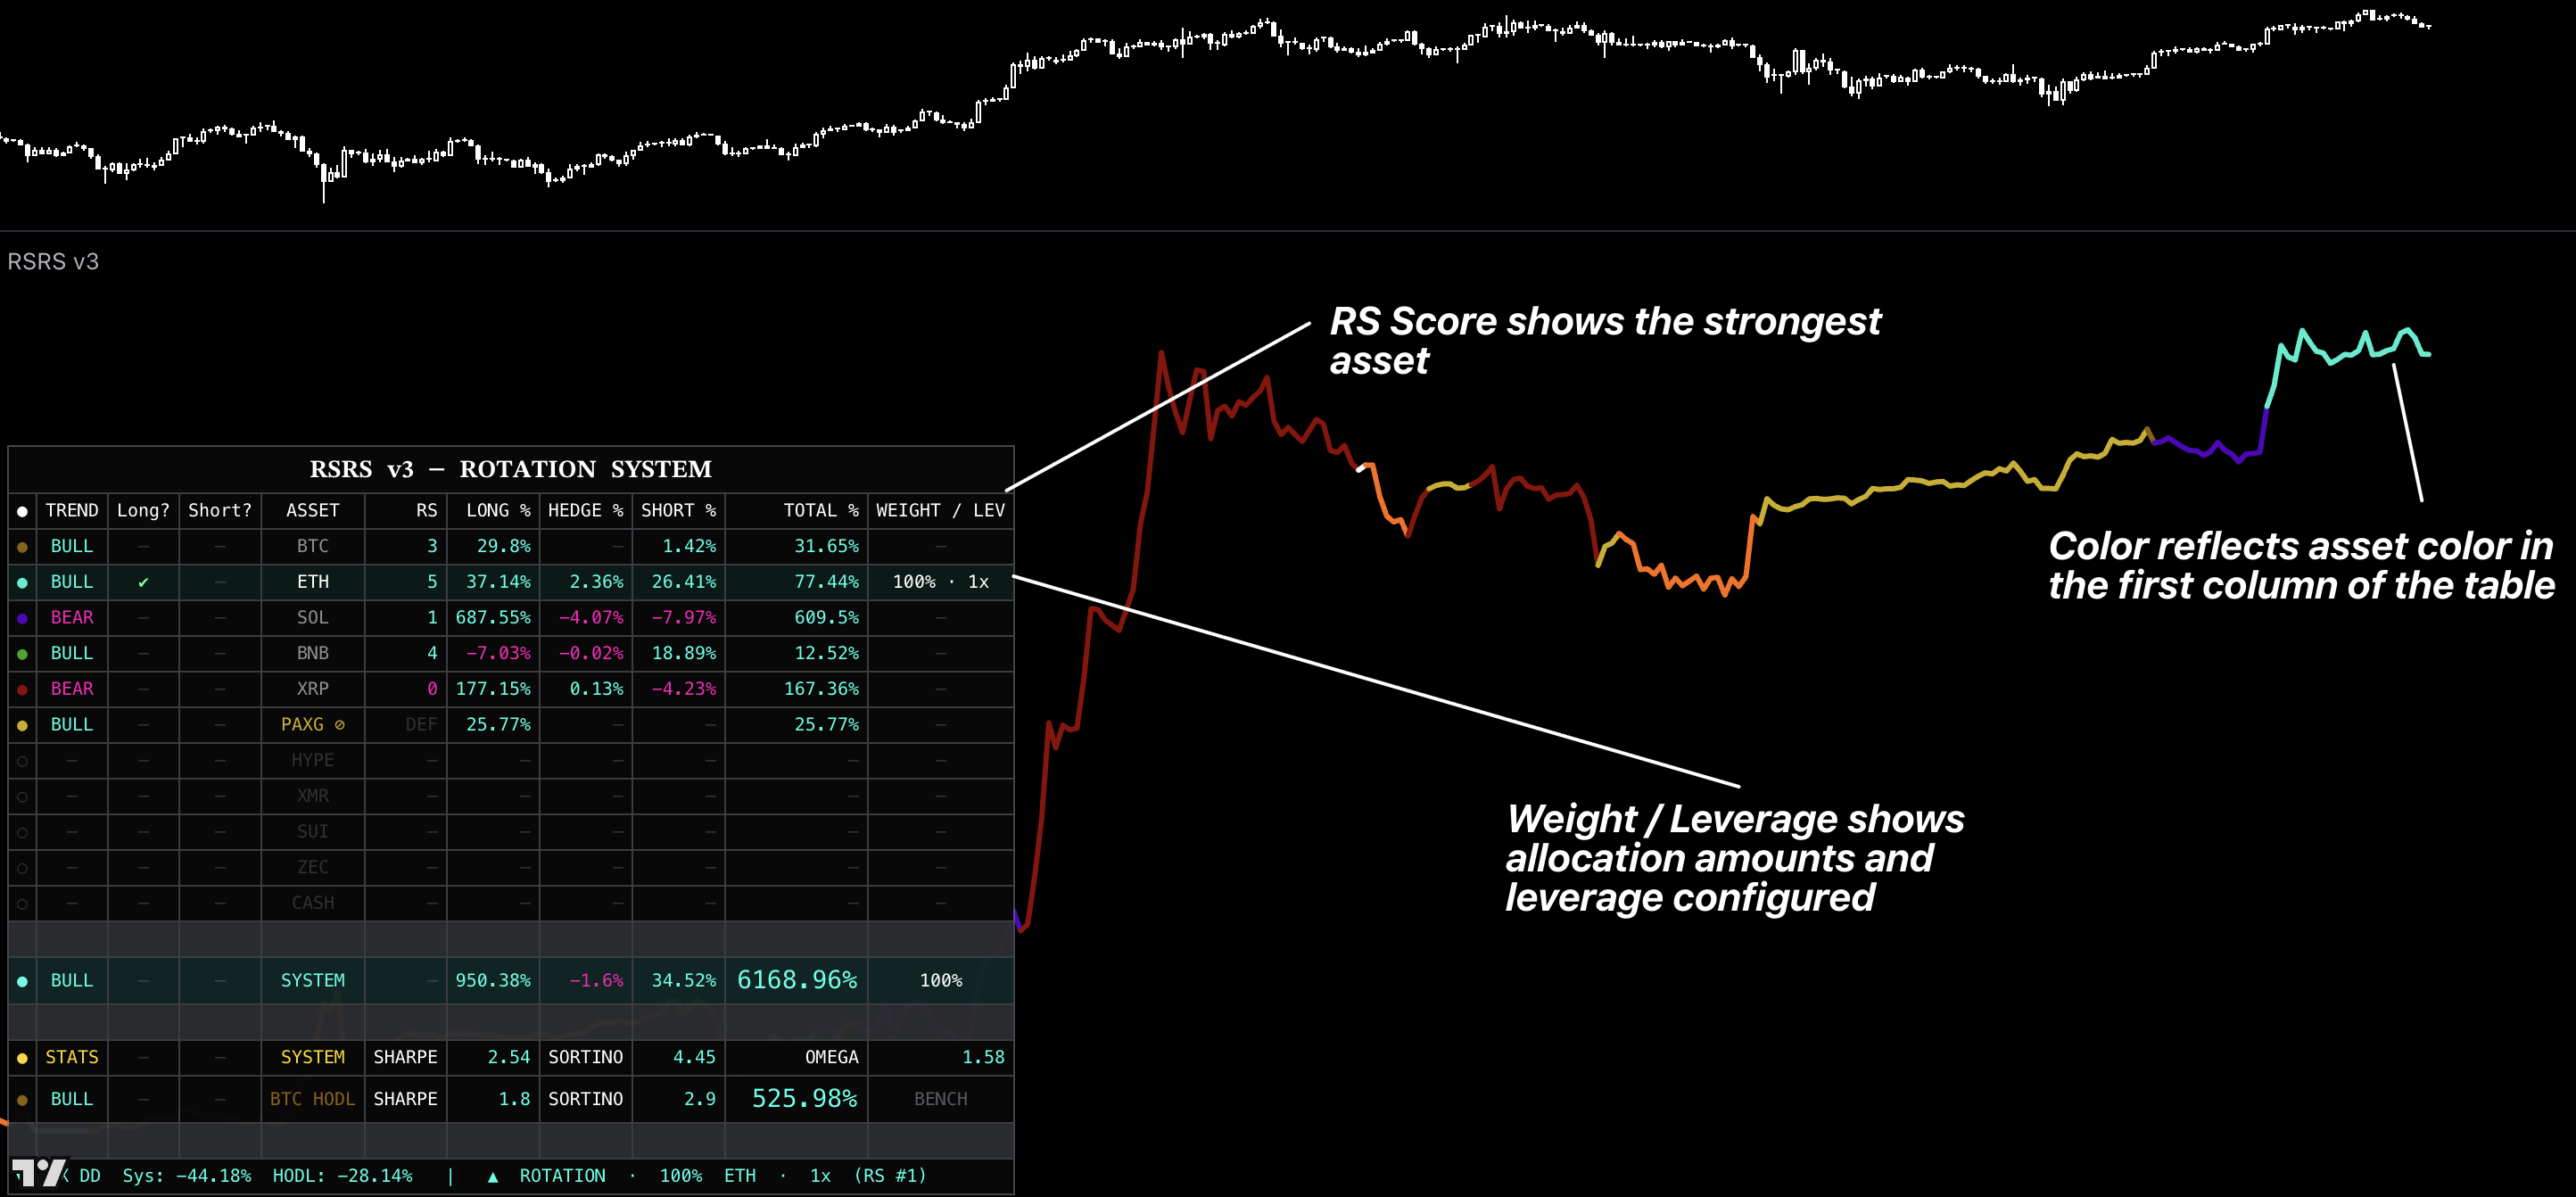
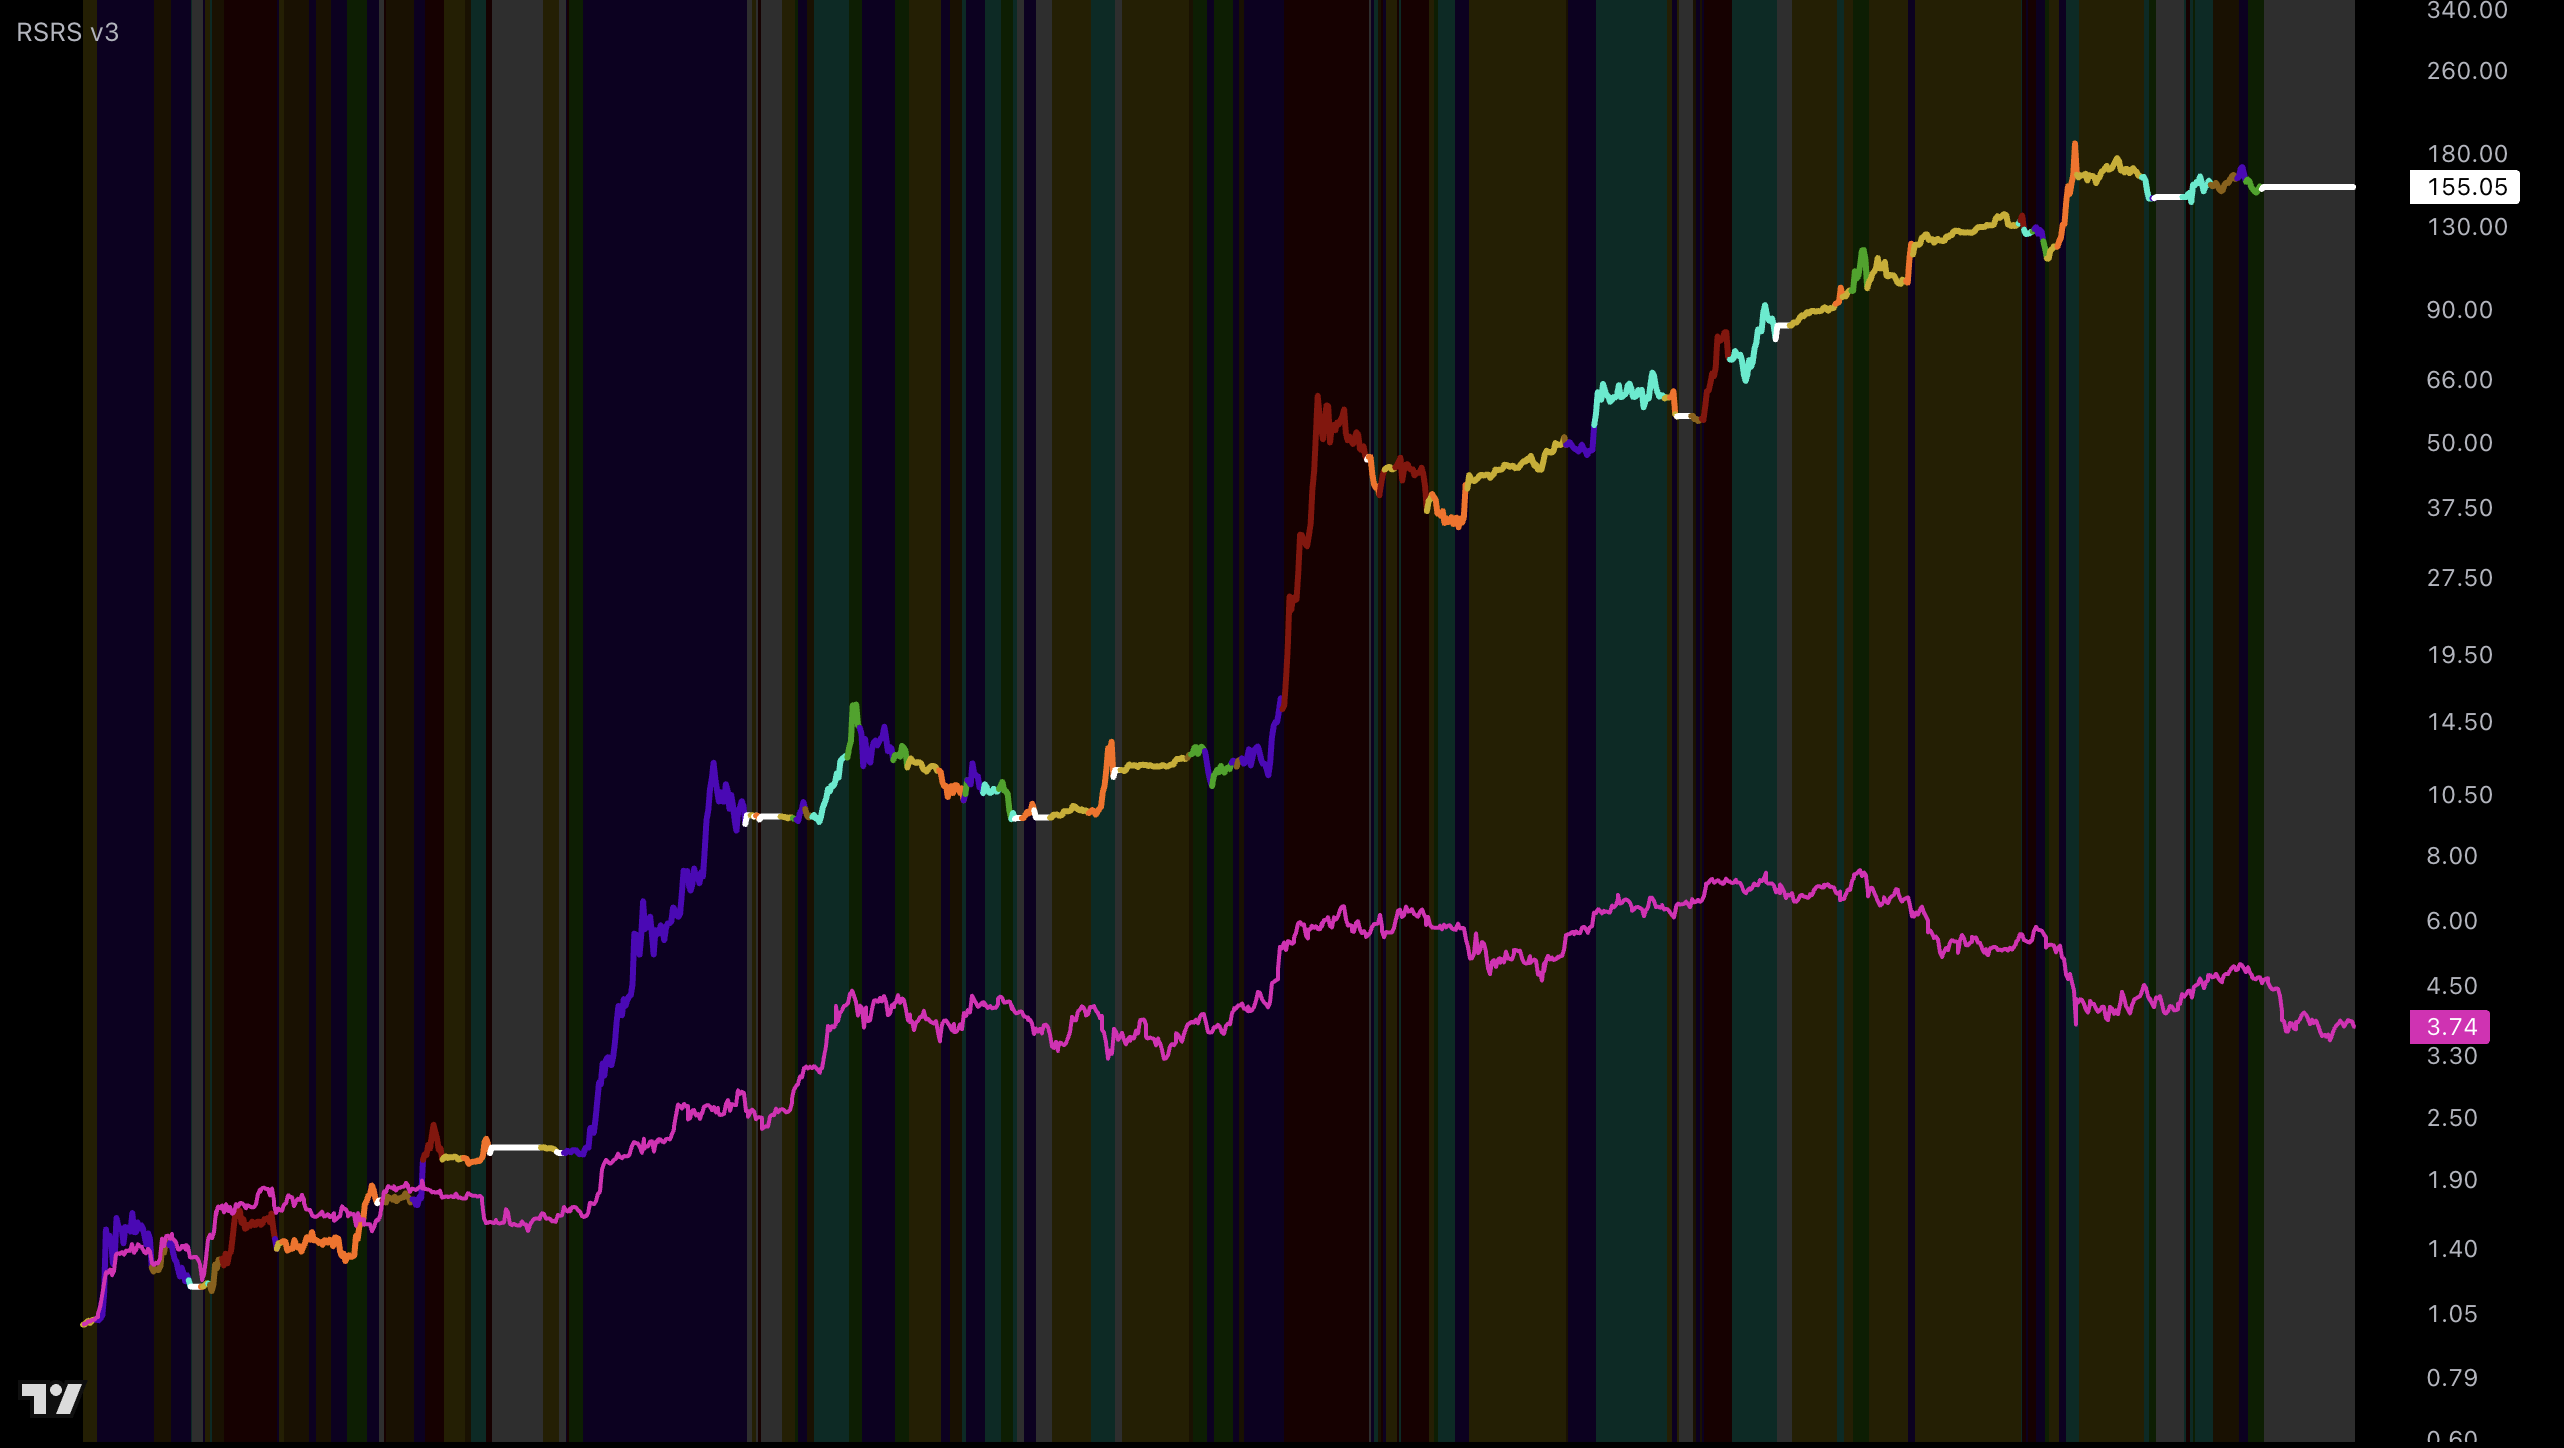
Relative Strength Rotation System v3
A 1D capital-rotation system built to grow portfolios over time through Long, Hedge, Short, and defensive regimes.
◆RSRS is the recommended rotation system. It is 10× better than the legacy Asset Rotation System. Use RSRS—and every Uptrick rotation system—on the 1D chart timeframe only.
Introduction
RSRS is Uptrick's flagship and, in our view, one of—potentially even the best—rotation systems you will find. The recommended defaults provide a complete out-of-the-box portfolio system, so you do not need to configure anything before using it. Traders who want a broader opportunity set can add assets they understand and customize leverage, Short, Hedge, and defensive behavior to pursue stronger long-term growth without changing the core workflow.
Think of RSRS as a team of specialist investors: one specializes in Long rotations, another in hedging transitions, another in Shorting bear markets, and another in protecting capital with PAXG or CASH. RSRS brings those specialties into one system and selects the appropriate role for the current market regime—Long in favorable conditions, Hedge during transitions, Short when bearish conditions call for it, and defensive when preserving capital takes priority.
RSRS is designed to grow portfolios over time, not to act as an entry overlay. Use it on the 1D timeframe only and follow the current table allocation and Weight / Lev instruction. Customization can expand opportunities and risk; it does not guarantee profit.
How to Use
1
Set the chart to 1D. Stop if the red timeframe warning appears.
2
Keep the recommended default: 1x SPOT ONLY. You are holding unleveraged spot assets, so there is no liquidation price. Keep PAXG at 1x too.
3
Keep the default pool inputs whenever possible. Disable only assets you cannot execute: Rotation assets must be available Long, Hedge assets on the required side, and Bear Short assets must be shortable.
4
Read the table. Use it to see the current system mode, active allocation, highlighted asset row or rows, and displayed Weight / Lev.
5
Execute Weight / Lev. In HEDGE mode, execute both the Long and Short legs at their separate weights.
6
Rebalance on Allocation Changed. Replace the old position with the newly confirmed allocation.
7
The default leverage inputs are recommended. Before changing them, review Max DD using the same start date, pools, and settings.
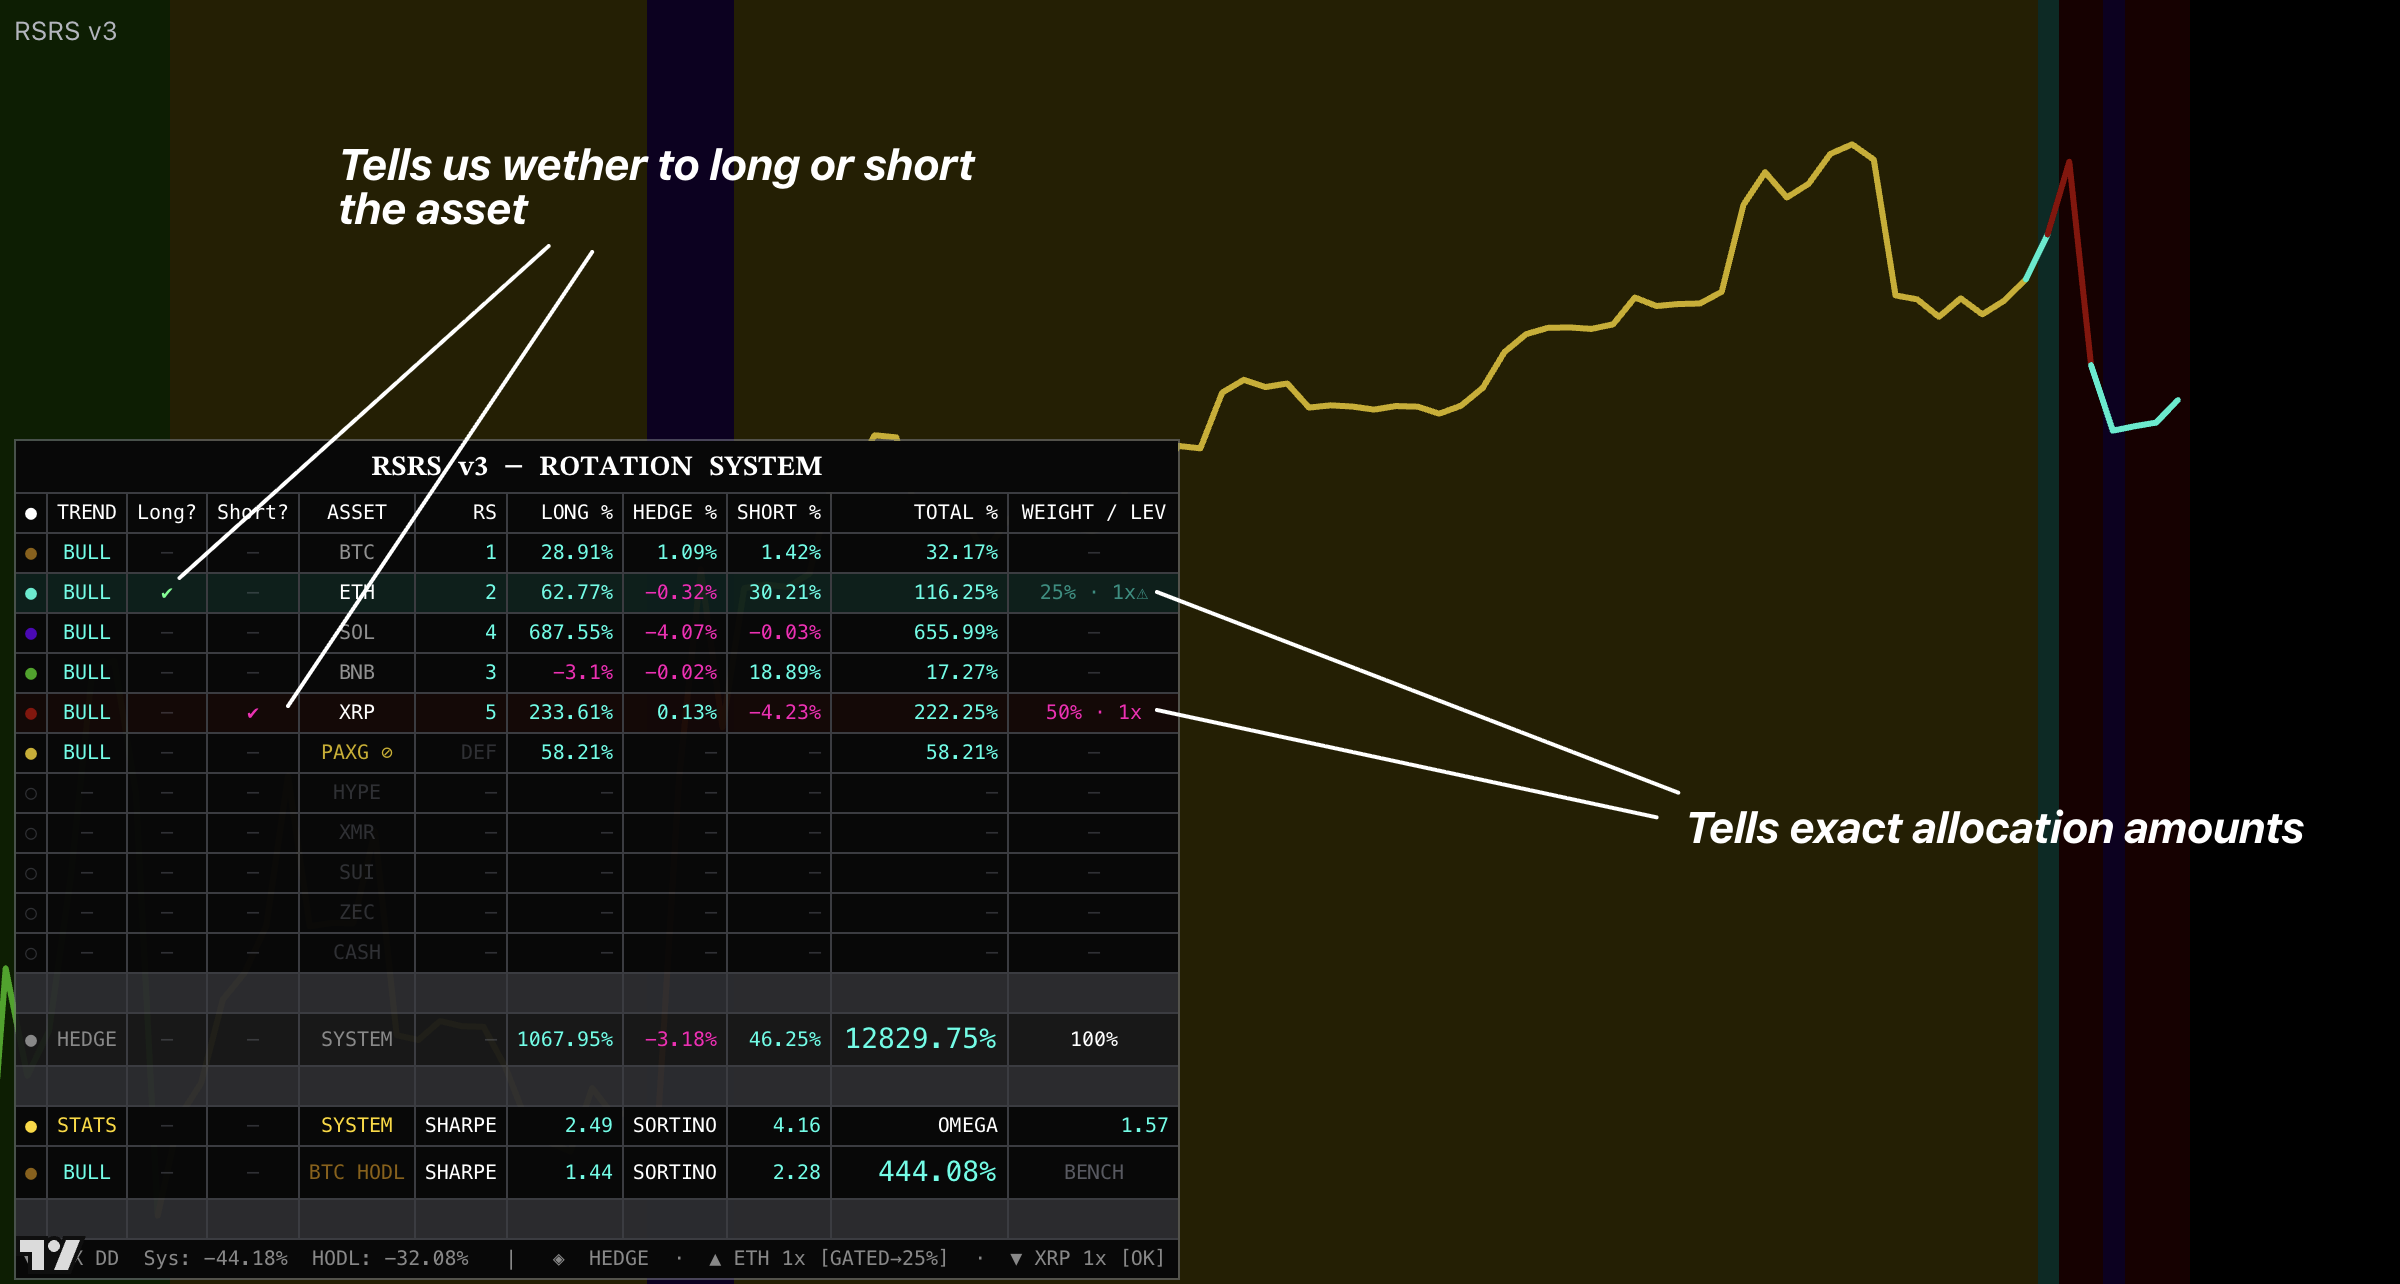
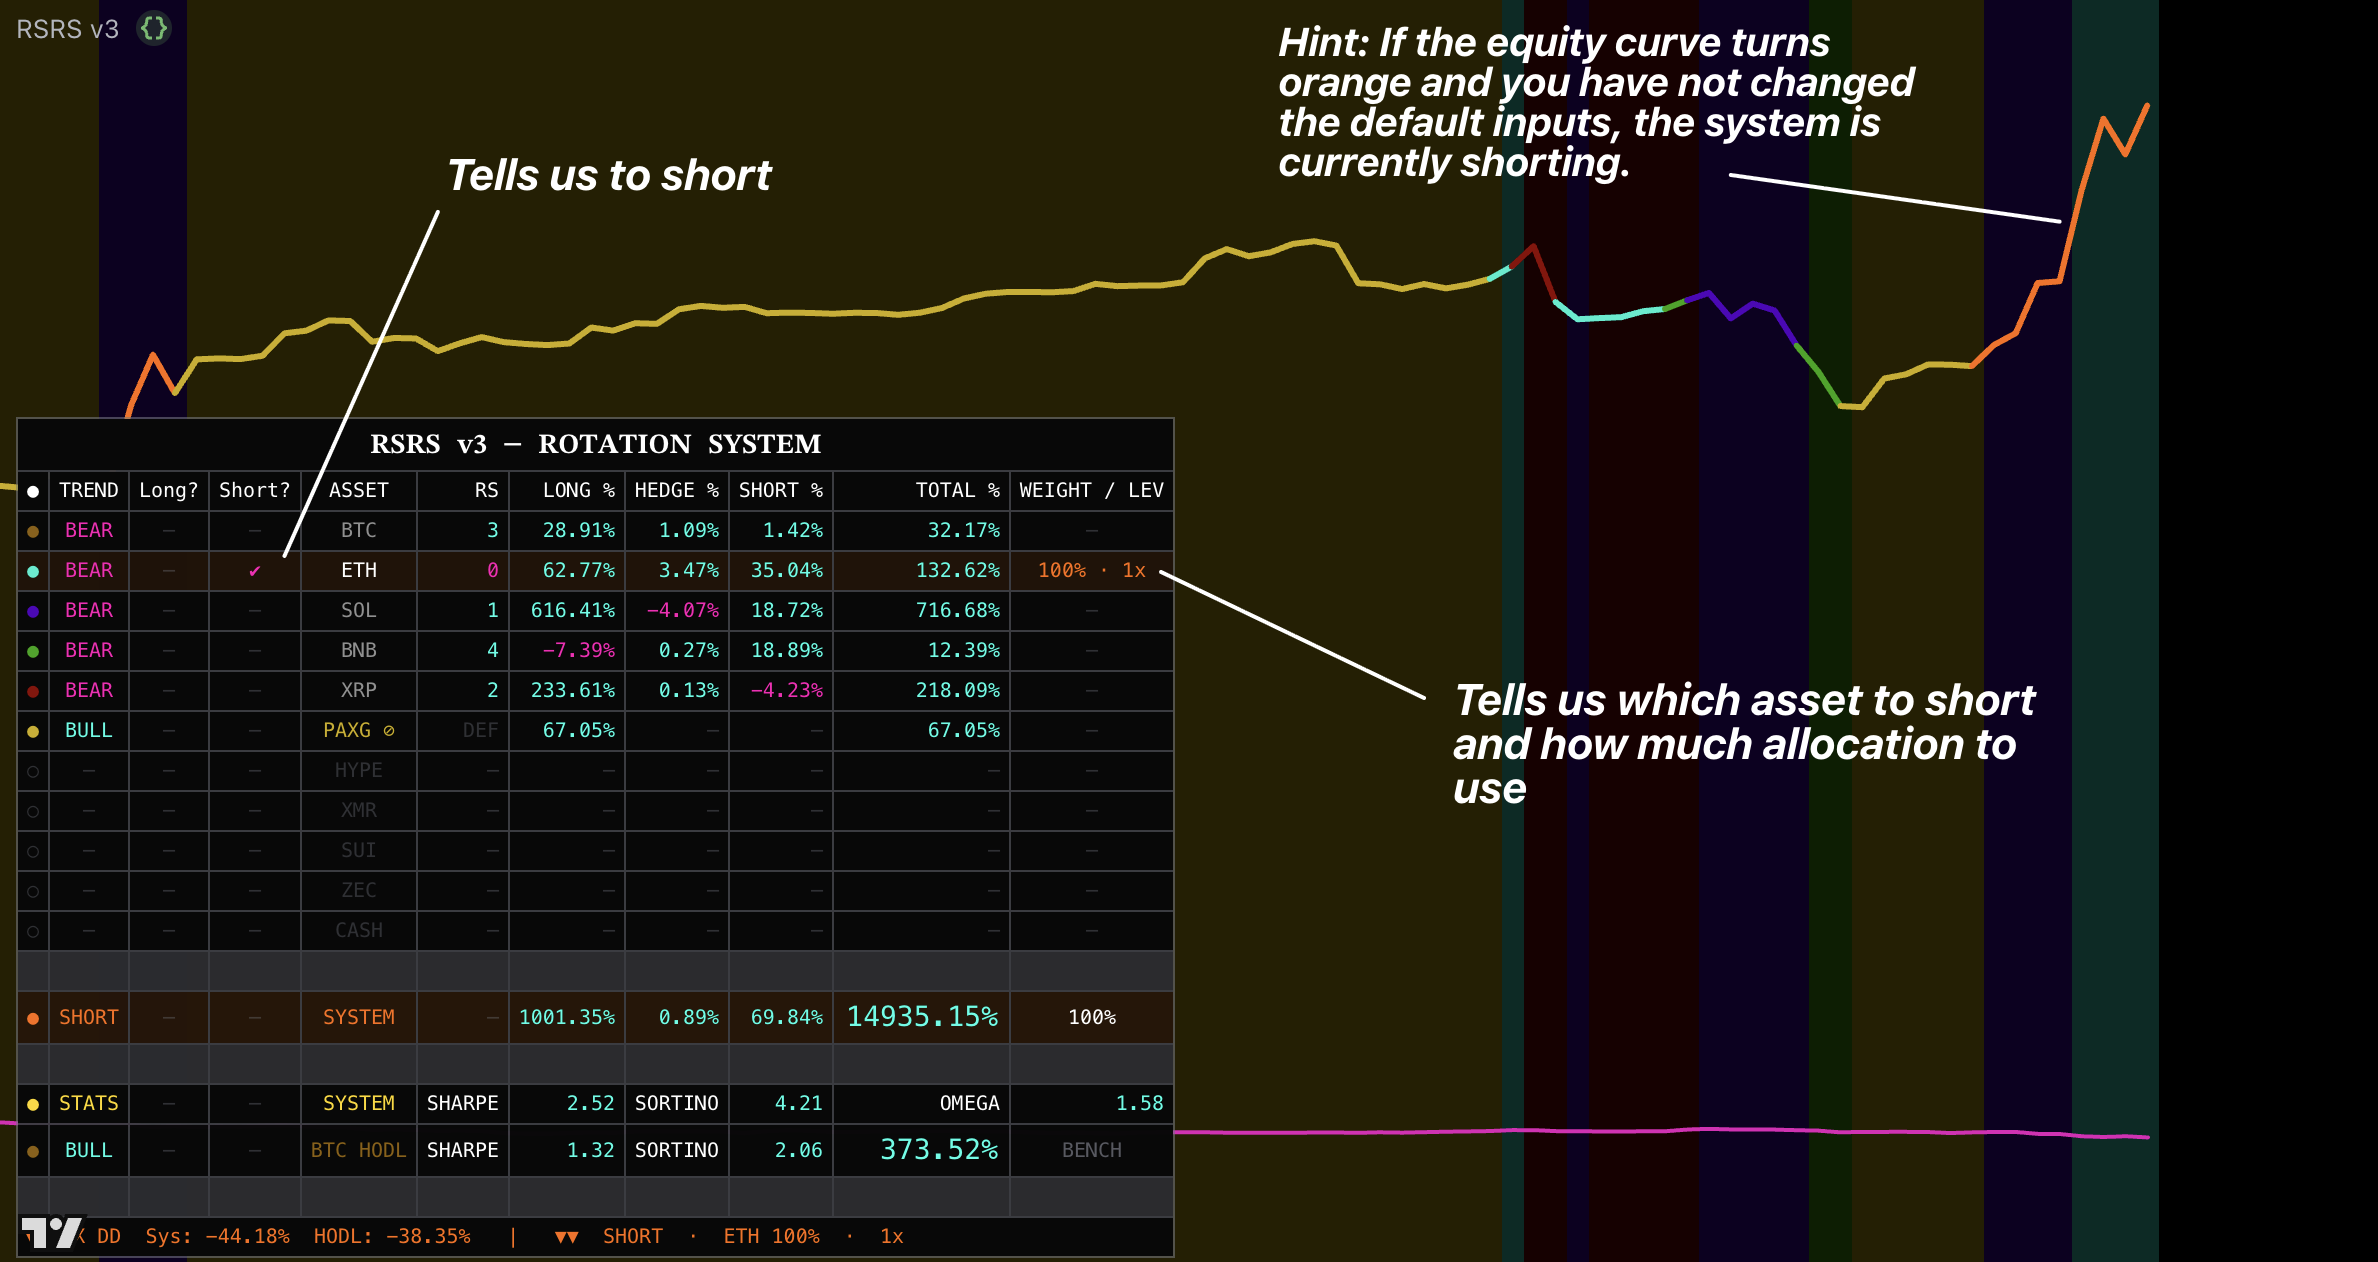
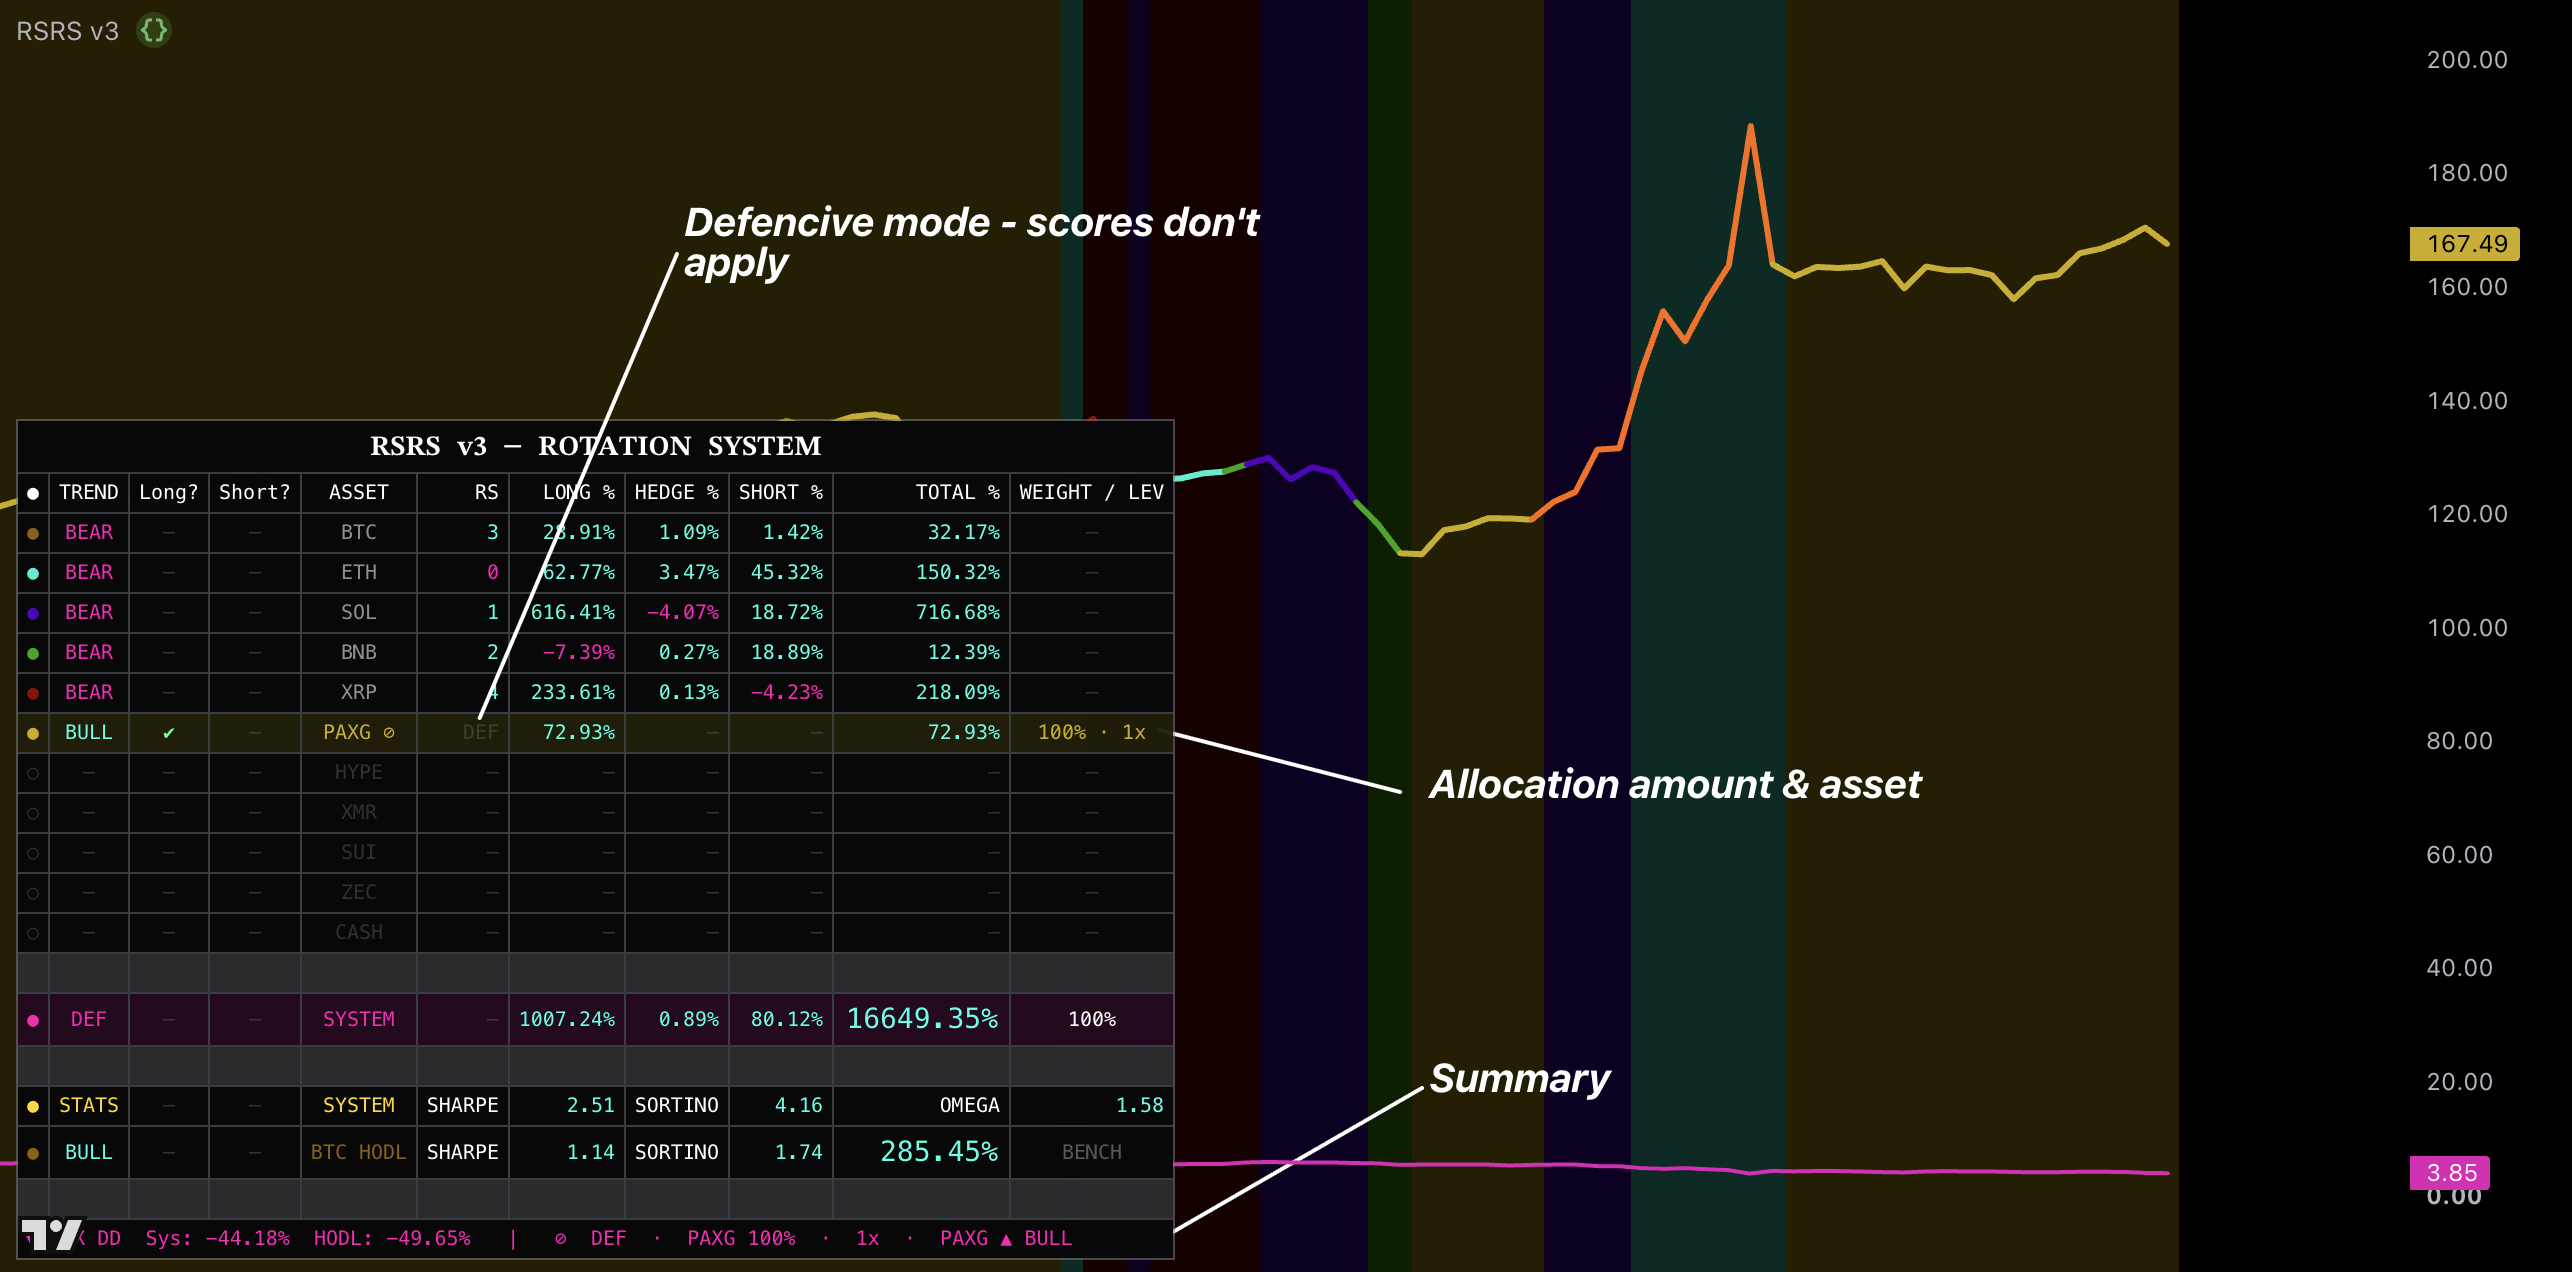
System Modes and Pools
BULL Mode
Long the strongest enabled Rotation asset at 100% and its configured leverage.
HEDGE Mode
Long the strongest Hedge asset and Short the weakest at their displayed 50% or gated 25% weights.
SHORT Mode
Short the selected weakest enabled core asset at 100% and its leverage.
DEF Mode
Hold the displayed PAXG, CASH, or fallback Rotation asset at 100%.
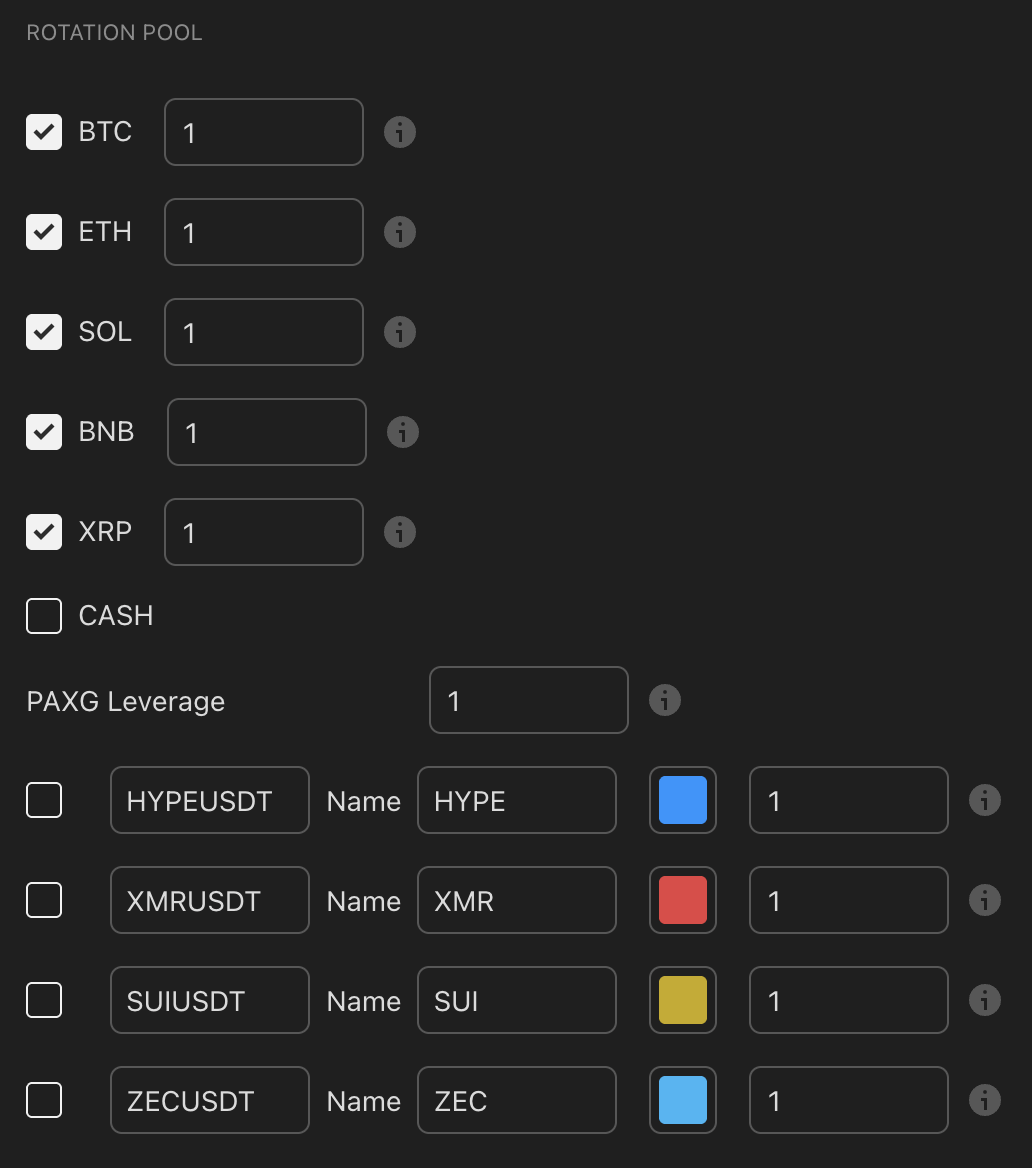
Rotation Pool
Enable only assets you can actually buy for the BULL Long allocation. The built-in assets each have a leverage field on the right; keep the recommended 1x default unless you have separately tested a higher-risk setup.
The lower rows are customizable asset slots. Enter a valid ticker, give it a short display name, choose its table color, set its leverage, and tick the checkbox only when you want that asset included in the Rotation Pool. Color changes presentation only; leverage changes exposure and risk.
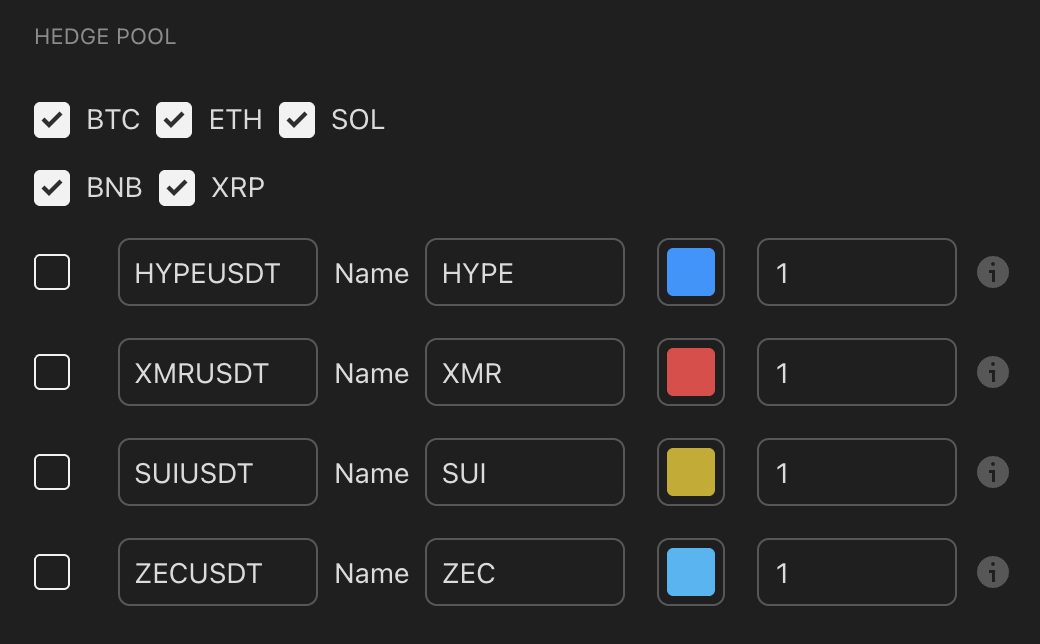
Hedge Pool
Enable only assets available for the required Long or Short hedge leg.
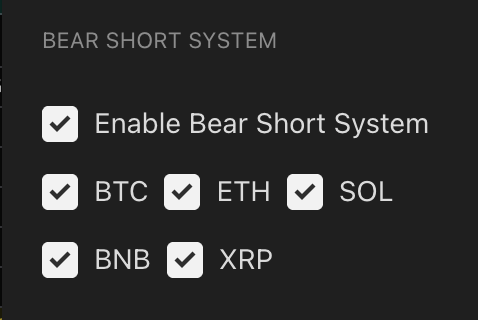
Bear Short Pool
Select which core majors can become the 100% Bear Short allocation.
Leverage: Read This Before Changing It
Leverage multiplies modeled gains and losses only while an asset is active. It does not change ranking, signal timing, or mode selection. Core and custom crypto inputs allow 1x–3x; PAXG allows 1x–100x; CASH is unleveraged.
Position
Approximate Effective Exposure
100% at 2x
200%. A ±5% asset move is roughly ±10% before costs.
50% Hedge leg at 2x
100% exposure on that leg.
25% gated leg at 2x
50% exposure on that leg.
Long 50% at 2x + Short 50% at 2x
200% gross exposure. Nominal net may be zero, but the two assets can move differently.
At 100x PAXG, an adverse move of roughly 1% corresponds to roughly −100% modeled exposure before costs. A real product can liquidate sooner. The indicator does not model funding, borrow costs, maintenance margin, spread, slippage, or intraday liquidation.
⚠Recommended starting point: 1x everywhere. After a 50% loss, the remaining equity needs a 100% gain to recover.
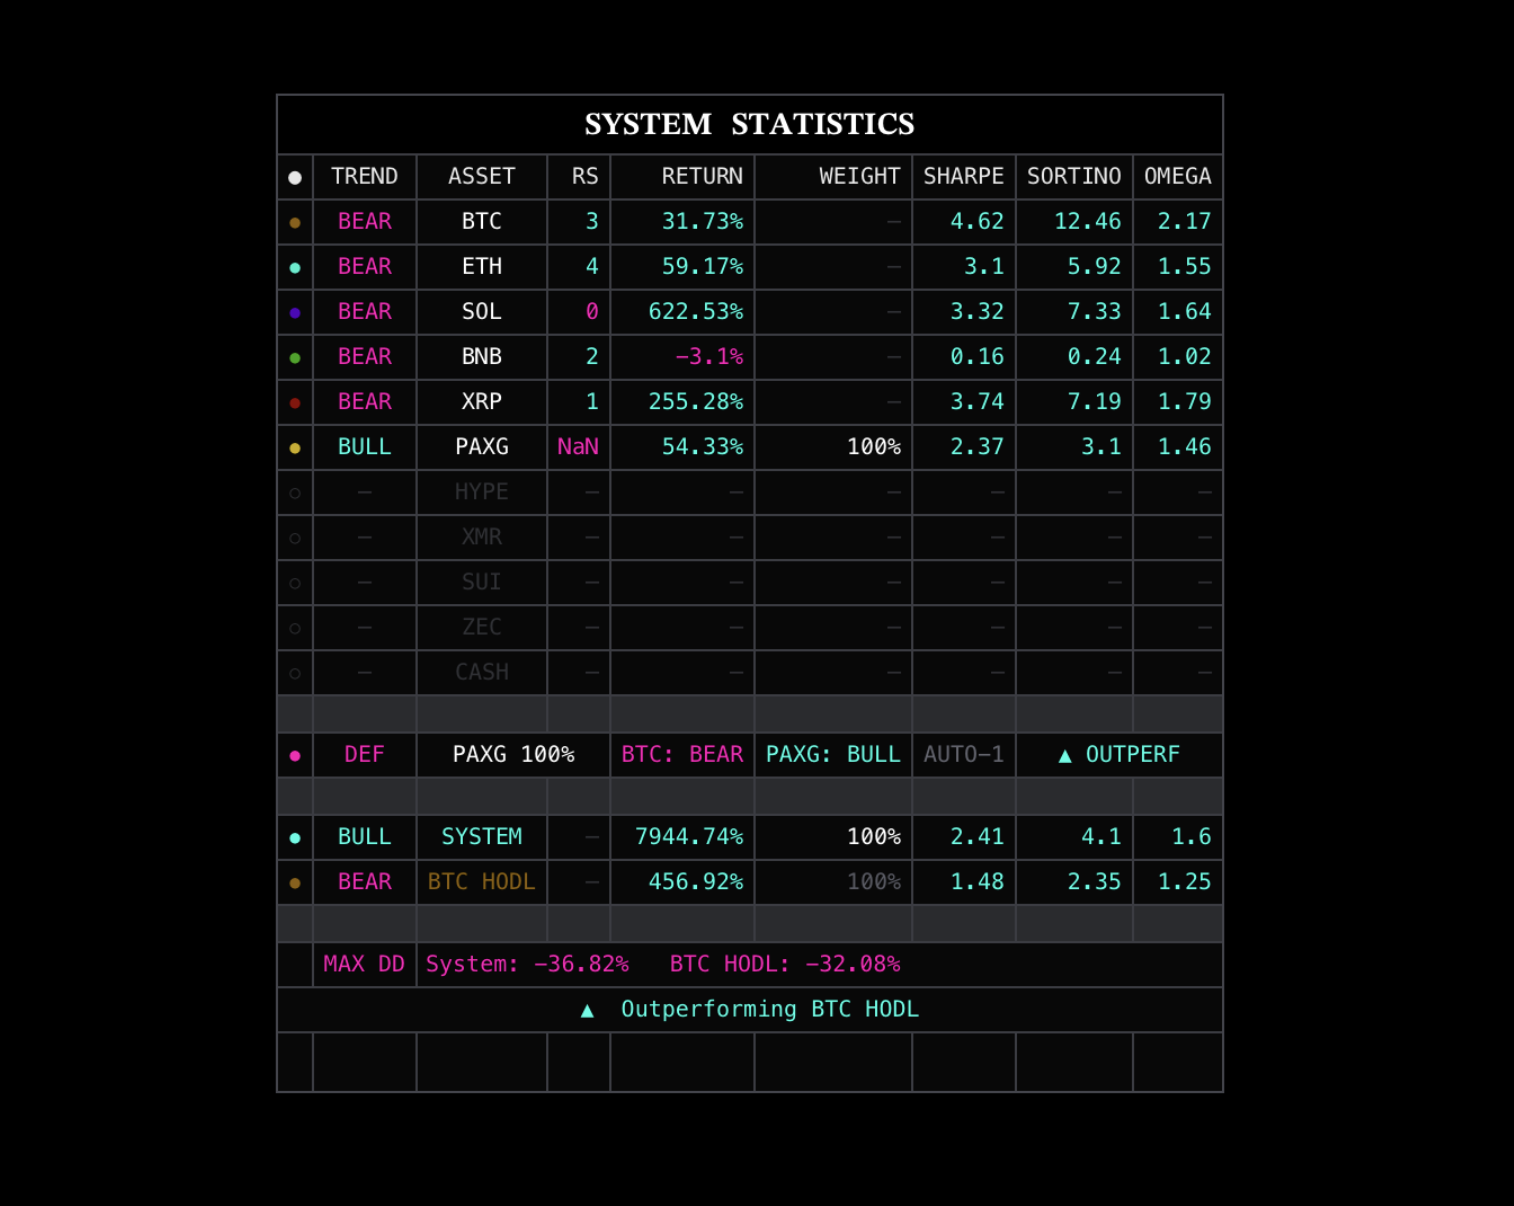
How to Understand the Table
Field
How to Use It
Long? / Short?
Checkmarks identify the active side of each highlighted asset.
RS
Rotation ranking context; do not manually replace the selected allocation.
LONG % / HEDGE % / SHORT % / TOTAL %
Historical P&L attribution—not current position size.
WEIGHT / LEV
The current execution instruction. A dash means inactive.
SYSTEM
Current mode plus total modeled return.
Sharpe / Sortino / Omega
Compare risk quality using identical dates, pools, and leverage.
BTC HODL
Benchmark for return and risk statistics.
MAX DD + bottom line
Worst modeled decline followed by the complete current allocation.
◆Read in this order: SYSTEM mode → bottom allocation line → highlighted row(s) → WEIGHT / LEV. Use the other columns for evaluation.
Other Features and Inputs
Default RSRS inputs are recommended. Change them only when required by the assets you can execute or by a separately tested workflow.
Backtest Start Date
Use it to set the evaluation window for equity, statistics, and Max DD.
Bull Confirmation Filter
Keep Entry Close Check on and the 10-bar window for the standard transitional workflow.
Bear Short System
Enable only when the account can execute the displayed 100% Short allocations.
Defensive Settings
Keep the chart on 1D. Use PAXG with CASH fallback as the starting setup; the internal PAXG check can remain on 1D for smoother decisions or use 12h for faster response.
Standard Equity View
Use the system curve against BTC HODL to compare return and risk.
System Profit View
Use for a focused RSRS-only curve; shadow and gradient settings are visual.
Background Modes
Use Asset for allocation color, State for BULL/HEDGE/SHORT/DEF color, or Off for a clean pane.
Alerts
Use Allocation Changed as the main alert and add state-specific alerts only when needed.
⚠Modeled performance is not live execution. Differences grow with leverage.
Recommended
Best For
Growing portfolios over time through long-term capital rotation across different market regimes.
Recommended Setup
Use the 1D chart, enable only executable pools, and begin at 1x leverage; most users should remain unleveraged.
Why
RSRS can rotate Long, hedge, Short, or defend. It is Uptrick's flagship and, in our view, the strongest rotation system on the market. Its historical model has outperformed BTC with lower-risk regime handling, but future results are not guaranteed.
◈ Support
FAQ
Common questions about Uptrick indicators, access, and usage.
After purchase, enter your TradingView and Discord usernames. Your TradingView account will be granted indicator access and your Discord account will receive the correct role. Access is usually instant, and within 24 hours at most.
Stellar Nexus (Bands Mode) and Trend Alpha ++ are mainly designed for daily and higher. Reversal Matrix X, Mean Reversion, and Trading Signals Suite work best on lower timeframes (5m–1h). Quantum RSI +, Oracle Metrics +, and ATR Model are flexible across timeframes. RSRS v3 must be used on the 1D chart timeframe.
For most indicators — especially Quantum RSI + — the defaults are already optimized. Focus on learning to read the indicator correctly before adjusting any settings. If you do adjust, start small and understand the purpose of each setting first.
Most are designed for crypto markets on TradingView. Oracle Metrics + Strength Mode is limited to its supported Binance pairs, while rotation systems are built for crypto majors. Trading Signals Suite and the redesigned Majors Directional Bias Pro can be applied more broadly.
Different plans give access to different tiers of indicators and Discord channels. Visit the Pricing page at uptrick.io/pricing for the full breakdown of what is included in each plan.
The systems notify you when allocation changes rather than requiring constant chart trading. Read the dashboard and mirror the displayed allocation. ARS can rotate defensively into PAXG or CASH; RSRS v3 can move among BULL Rotation, HEDGE, SHORT, and DEF modes.
Yes. Every purchase includes a 3-day free trial so you can explore all systems and indicators before fully committing.
Join the Discord community after purchase — there are dedicated channels for each indicator with real-time support. You can also contact support@uptrick.io for account-related questions.
Yes, and that is actually the intended approach for advanced users. For example, using Quantum RSI + for exhaustion exits while running Stellar Nexus or Trend Alpha ++ for directional bias creates a multi-layer system. Start with one indicator and master it before combining.
The indicators are built to show confirmed signals based on completed bar data. If you have specific questions about a particular indicator's behavior, ask in the Discord community for clarification.
◈ Final Guide
Conclusion: Choose Your System
A practical map of every Uptrick indicator, who it is for, and how it should fit into a complete trading or portfolio process.
The Core Principle
Indicators are tools inside a system—not autonomous money-making machines.
Every indicator should be used together with a defined market, timeframe, entry rule, invalidation point, position size, profit plan, and review process. Some Uptrick products provide most of that framework; others intentionally solve one specific job such as direction, confirmation, valuation, exits, or portfolio rotation.
This does not mean stacking every indicator on one chart. A simple system may use one primary signal and a risk plan. A more advanced system may combine direction, confirmation, and exit tools. Add an indicator only when it changes a real decision.
No indicator removes risk, judgment, execution differences, or the possibility of loss. If the main objective is growing a portfolio over time rather than actively trading every move, RSRS is Uptrick's first recommendation.
Assign each component one role: direction, entry quality, regime, stop, target, or exit. Test additions one at a time.
Recommended Paths
1
For everyone: RSRS first
If long-term portfolio growth is the objective, start with RSRS on the 1D timeframe using the recommended defaults and 1x spot exposure. It is Uptrick's primary rotation system and does not require active lower-timeframe trading.
2
For a beginner active trader
Start with Stellar Nexus on the Daily chart. Follow Bands Mode without adding unnecessary confirmation. Once the basic workflow is consistent, add Quantum RSI for profit-taking or Oracle Metrics when major-asset strength matters.
3
For a short-term trader
Use TSS for a modular lower-timeframe system, or MDB Precision / Conviction for a structured directional workflow. Follow the selected stop method, take every planned TP, and avoid changing tools during an open trade.
4
For a reversal trader
Use Reversal Matrix X when you understand location, structure, invalidation, and staged targets. Quantum RSI and Mean Reversion can help value the location, but they should not replace the Main reversal trigger.
5
For a system builder
Begin with TSS or ADO at the intermediate level. Move to Trend Alpha ++ for advanced trend-engine combinations. Keep only components that demonstrably improve direction, risk, timing, or exits.
Beginner Checklist
Choose one goal first: portfolio rotation, Daily trend trading, lower-timeframe trading, or reversal trading.
Use the recommended defaults until the normal behavior is fully understood.
Start with one primary indicator and, at most, one companion with a different job.
Define the stop, account risk, and profit plan before entering any active trade.
Use 1x spot for RSRS initially; leverage is optional and materially increases risk.
Review enough examples before changing an input or adding another confirmation layer.
◆Beginners should generally start with RSRS for portfolio growth, Stellar Nexus for simple Daily trading, ATR Model for levels and risk, or Quantum RSI for learning profit-taking. Leave Trend Alpha ++ and Reversal Matrix X until the underlying workflow is understood.
Learn How Systems Work Together
The indicator pages explain each individual workflow. The next step is learning how direction, confirmation, risk, and exits combine without duplicating the same information across several tools.
Learn and discuss complete systems in Discord
See practical combinations, ask questions, and learn when an additional indicator improves a system—and when it only adds noise.


.png)